. 2025 May 21;26(1):137.
doi: 10.1186/s13059-025-03605-7.

H3K4me3 binding ALFIN-LIKE proteins recruit SWR1 for gene-body deposition of H2A.Z

Affiliations

H3K4me3 binding ALFIN-LIKE proteins recruit SWR1 for gene-body deposition of H2A.Z

Linhao Xu et al. Genome Biol. .

Abstract

Background: The H2A.Z histone variant is highly enriched over gene bodies, playing an essential role in several genome-templated processes, including transcriptional regulation and epigenetic patterning across eukaryotes. Deposition of H2A.Z is mediated by the SWR1 remodeling complex. How SWR1 is directed to gene bodies is largely unknown.

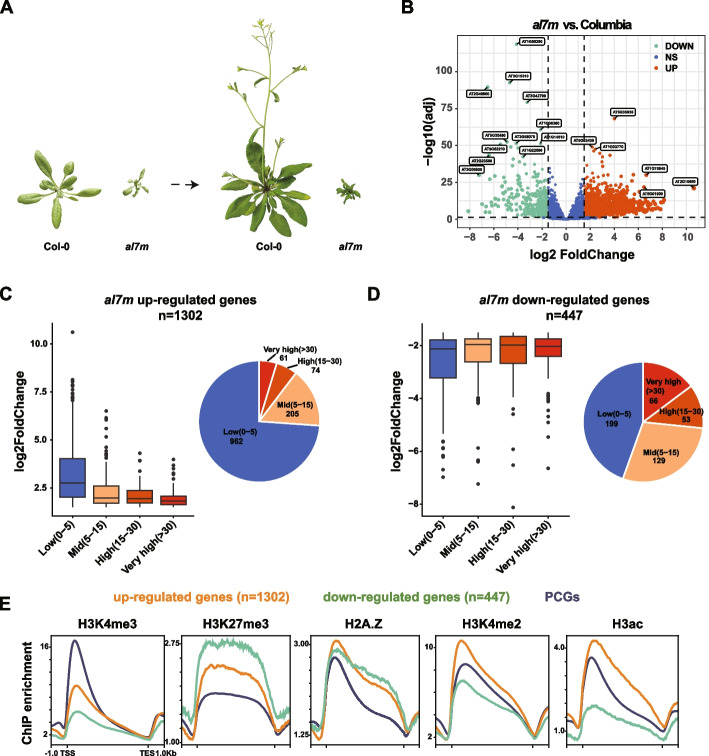
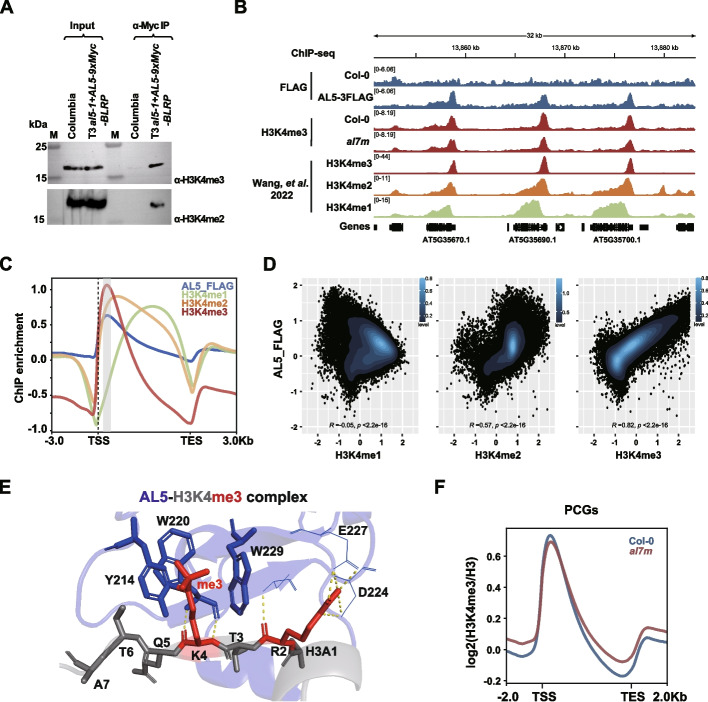
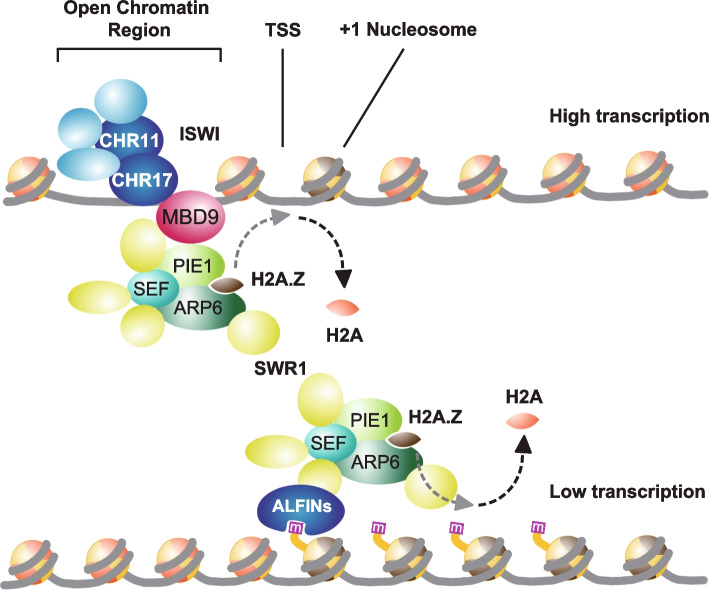
Results: Here, we show that ALFIN-LIKE (AL) proteins are responsible for H2A.Z gene body patterning in Arabidopsis. AL proteins encode H3K4me3-binding PHD domains, and by ChIP-seq, we confirm preferential binding of AL5 to H3K4me3 over H3K4me1/2 in planta. We observe a global reduction in H2A.Z in al septuple mutants (al7m), especially over H3K4me3-enriched genic regions. While MBD9 recruits SWR1 to nucleosome-free regions, ALs act non-redundantly with MBD9 for deposition of H2A.Z. Notably, al7m mutants show severe developmental abnormalities and upregulation of H2A.Z gene body-enriched responsive genes.

Conclusions: Therefore, we propose a model whereby AL proteins direct gene body enrichment of H2A.Z by recruiting SWR1 to H3K4me3-containing responsive genes.


Conflict of interest statement

Declarations. Ethics approval and consent to participate: Not applicable. Competing interests: The authors declare no competing interests.

Figures

Fig. 1
Fig. 1
alfin-like septuple mutant (al7m) phenotype and analysis of the al7m transcriptome. A The visual phenotype of the wildtype and al7m on 28 (left) and 40 (right) days after germination. B Volcano plot showing deregulated genes in the al7m mutant background. A cut-off of log2 > ± 1.5 and FDR < 0.05 was used for the differential expression level and statistical significance, respectively. C Box plot and pie plot showing differential expression of up-regulated genes in al7m divided by expression level classes in the wild type. The boxplot's top, mid-line, and bottom represent the upper quartile, median, and lower quartile, respectively. D Box plot and pie plot showing differential expression of down-regulated genes in al7m divided by expression level classes in the wild type. The boxplot's top, mid-line, and bottom represent the upper quartile, median, and lower quartile, respectively. E Metaplots showing the typical profile of the epigenetic marks H3K4me3 (GSE181489), H3K27me3 (SRR10905142), H2A.Z (SRR8695714), H3K4me2 (GSE181489) and H3ac (SRR5837284) over deregulated genes in the al7m background and all protein-coding genes (PCGs)
Fig. 2
Fig. 2
AL5 is an H3K4me3 binder. A Co-immunopurification assays confirming the interaction of AL5 with H3K4me3 and H3K4me2 in vivo. Immunoprecipitation lane (α-Myc IP) showing co-purification of AL5. The antibody used to detect the target is indicated at the bottom of the blot. Extracts from the same lines are included to identify the co-precipitating band (Input). B Genome browser image showing the colocalization of AL5-FLAG peaks with H3K4me3 peaks at selected genes. C Metaplot showing the ChIP-seq signals of AL5-FLAG and published data sets of H3K4me1, H3K4me2 and H3K4me3 (Wang, et al. 2022) over all genes. D Scatterplots showing the correlation of AL5-FLAG and H3K4me (Wang, et al. 2022) over all PCGs. Spearman was used as a correlation method. The colored bin represents the density level of dots. E AlphaFold three predicted the structure models of the AL5-H3K me3 complex. The AL5 is shown in blue, H3 is shown in grey, and the histone H3K4me3 and H3R2 me peptides are shown in red. AL5 residues involved in H3K4me3 recognition are labeled. F Metaplot showing the ChIP-seq signal of H3K4me3 in Col-0 and al7m over PCGs
Fig. 3
Fig. 3
ALs are required for the deposition of H2A.Z. A Co-immunopurification assays confirming the interaction of AL5 with ARP6 in vivo. Immunoprecipitation lane (α-AL5 IP) showing co-purification of AL5. The antibody used to detect the target is indicated at the bottom of the blot. Extracts from the same lines are included to identify the co-precipitating band (Input). The red star indicates ARP6-3xFLAG-BLRP or ARP6-9xMYC-BLRP bands in both input and IP samples. B H2A.Z abundance in al7m. Western blot (right) and quantification of H2A.Z relative to H3 levels (left) in total histone extracts from the wild type and al7m. The upper band in the H2A.Z blot likely represents the ubiquitinated form of H2A.Z. Only the lower band was used for quantification purposes. The data are presented as the average levels of five independent replicates ± SE. A paired two-tailed Student’s t-test was used to determine the significance between wildtype and al7m. C Metaplot showing the normalized ChIP-seq signal (RPGC) of H2A.Z in two biological replicates of Col-0 and al7m over all PCGs. D Genome browser image showing the FLAG ChIP-seq signals of AL5-3 FLAG, H2A.Z ChIP-seq signals of Col-0 and al7m, as well as the RNA-seq signals of three biological replicates of Col-0 and al7m over representative al7m up-regulated genes. E Metaplots showing the ChIP-seq signal of H2A.Z in Col-0 and al7m over PCGs and al7m deregulated genes
Fig. 4
Fig. 4
ALs repress transcription via gene body H2A.Z deposition. A Metaplots and heatmaps showing the ChIP-seq signals of FLAG, H2A.Z, and H3K4me3 over AL5 peaks (n = 15,705) in Col-0 and al7m. B Boxplots showing the H2A.Z levels over AL5 bound genes (n = 14,866) and AL5 unbound genes (n = 17,775). The boxplot's top, mid-line, and bottom represent the upper quartile, median, and lower quartile, respectively. Wilcoxon test was used to determine the significance. C Metaplots showing the ChIP-seq enrichments of AL5-FLAG and H2A.Z over all PCGs and al7m deregulated genes
Fig. 5
Fig. 5
Comparison between AL5-FLAG and MBD9-FLAG ChIP-seq. A Metaplots and heatmaps showing the FLAG ChIP-seq signals of MBD9-FLAG (Potok, et al. 2019) and AL5-FLAG over all PCGs. B Metaplot showing the binding position of MBD9-FLAG (Potok, et al. 2019), AL5-FLAG and the position of nucleosomes around TSS from MNase-seq (Diego-Martín, et al. 2022). C Venn diagram (top) analysis of MBD9 peaks and AL5 peaks, and violin plot inlaid with boxplot (bottom) showing H2A.Z levels over MBD9 unique peaks (n = 7,004), common peaks (n = 4,751) and AL5 unique peaks (n = 10,954). The boxplot's top, mid-line, and bottom represent the upper quartile, median, and lower quartile, respectively
Fig. 6
Fig. 6
Proposed model of the role of ALFINs in transcription regulation. Unlike MBD9, which binds to the open chromatin regions and recruits the SWR1 complex to facilitate the deposition of H2A.Z at the + 1 nucleosome, thereby enhancing transcription, ALFINs recognize H3K4me3 marks and recruit the SWR1 complex to deposit H2A.Z within the gene bodies of low-expressed genes

Similar articles

References

    1. Luger K, Mader AW, Richmond RK, Sargent DF, Richmond TJ. Crystal structure of the nucleosome core particle at 2.8 A resolution. Nature. 1997;389:251–260. - PubMed
    1. Arents G, Burlingame RW, Wang BC, Love WE, Moudrianakis EN. The nucleosomal core histone octamer at 3.1 A resolution: a tripartite protein assembly and a left-handed superhelix. Proc Natl Acad Sci U S A. 1991;88:10148–10152. - PMC - PubMed
    1. Kornberg RD. Chromatin structure: a repeating unit of histones and DNA. Science. 1974;184:868–71. - PubMed
    1. Candela-Ferre J, Diego-Martin B, Perez-Alemany J, Gallego-Bartolome J. Mind the gap: Epigenetic regulation of chromatin accessibility in plants. Plant Physiol. 2024;194:1998–2016. - PMC - PubMed
    1. Probst AV. Deposition and eviction of histone variants define functional chromatin states in plants. Curr Opin Plant Biol. 2022;69: 102266. - PubMed

MeSH terms

LinkOut - more resources