. 2025 May 22;17(1):58.
doi: 10.1186/s13073-025-01467-z.

Untargeted proteomics enables ultra-rapid variant prioritisation in mitochondrial and other rare diseases

Collaborators, Affiliations

Untargeted proteomics enables ultra-rapid variant prioritisation in mitochondrial and other rare diseases

Daniella H Hock et al. Genome Med. .

Abstract

Background: Only half of individuals with suspected rare diseases receive a genetic diagnosis following genomic testing. A genetic diagnosis allows access to appropriate care, restores reproductive confidence and reduces the number of potentially unnecessary interventions. A major barrier is the lack of disease agnostic functional tests suitable for implementation in routine diagnostics that can provide evidence supporting pathogenicity of novel variants, especially those refractory to RNA sequencing.

Methods: Focusing on mitochondrial disease, we describe an untargeted mass-spectrometry based proteomics pipeline that can quantify proteins encoded by > 50% of Mendelian disease genes and > 80% of known mitochondrial disease genes in clinically relevant sample types, including peripheral blood mononuclear cells (PBMCs). In total we profiled > 90 individuals including undiagnosed individuals suspected of mitochondrial disease and a supporting cohort of disease controls harbouring pathogenic variants in nuclear and mitochondrial genes. Proteomics data were benchmarked against pathology accredited respiratory chain enzymology to assess the performance of proteomics as a functional test. Proteomics testing was subsequently applied to individuals with suspected mitochondrial disease, including a critically ill infant with a view toward rapid interpretation of variants identified in ultra-rapid genome sequencing.

Results: Proteomics testing provided evidence to support variant pathogenicity in 83% of individuals in a cohort with confirmed mitochondrial disease, outperforming clinical respiratory chain enzymology. Freely available bioinformatic tools and criteria developed for this study ( https://rdms.app/ ) allow mitochondrial dysfunction to be identified in proteomics data with high confidence. Application of proteomics to undiagnosed individuals led to 6 additional diagnoses, including a mitochondrial phenocopy disorder, highlighting the disease agnostic nature of proteomics. Use of PBMCs as a sample type allowed rapid return of proteomics data supporting pathogenicity of novel variants identified through ultra-rapid genome sequencing in as little as 54 h.

Conclusions: This study provides a framework to support the integration of a single untargeted proteomics test into routine diagnostic practice for the diagnosis of mitochondrial and potentially other rare genetic disorders in clinically actionable timelines, offering a paradigm shift for the functional validation of genetic variants.

Keywords: Genetic diagnostics; Mendelian disease; Proteomics; Ultra-rapid genome sequencing; Variant prioritisation.


Conflict of interest statement

Declarations. Ethics approval and consent to participate: This study was conducted in accordance with the revised Declaration of Helsinki and following the Australian National Health and Medical Research Council statement of ethical conduct in research involving humans. Samples were obtained after receiving written, informed consent for diagnostic or research investigations and publication from the respective responsible human ethics institutional review boards. HREC/RCH/34228, HREC/RCH/34183, HREC/89419/RCHM-2022 and HREC/82160/RCHM-2022 were approved by the Royal Children’s Hospital, Melbourne, Ethics in Human Research Committee. HREC/16/MH/251 was approved by the Melbourne Hospital Ethics in Human Research Committee. The REC reference 2002/205 by the Newcastle and North Tyneside Local Research Ethics Committee. Protocol 10/CHW/45 renewed with protocol 2019/ETH11736 (July 2019–March 2025) was approved by Sydney Children’s Hospitals Network Human Research Ethics Committee. Consent for publication: Details from most participants have been published previously as noted in Additional file 1: Table S1. Unless specified below, participants were enrolled into one of a range of Institutional Review Board (IRB) approved study protocols listed in the Ethics approval and consent to participate section, including consent for data sharing and publication. Three of the validation cohort (VC) participants have not been published previously, and the parents of two (VC15, VC24) provided written consent for publication and clinical summaries are provided in Additional file 2. VC13 was lost to follow-up and we are unable to include identifiable data thus clinical details are not included for privacy reasons. If these data are needed for valid clinical reasons, such as variant curation, please contact david.thorburn@mcri.edu.au. Competing interests: S.T.C is named inventor of Intellectual Property (IP) related to novel methods to identify splicing variants (WO2020097660A1, WO2020/181333). This IP is owned jointly by The University of Sydney and Sydney Children’s Hospitals Network. S.T.C is Director of Frontier Genomics Pty Australia which has licensed this IP. S.T.C currently receives no remuneration for this Director role. The remaining authors declare that they have no competing interests.

Figures

Fig. 1
Fig. 1
Study design and validation cohort analysis. A Quantitative proteomics experimental design overview. A fibroblast validation cohort (VC), HEK293T knockout cohort (KC), undiagnosed patient cohort (UDP) and supporting cohort (SC) prepared using S-Trap™ columns. Digested peptides were subjected to liquid chromatography tandem mass spectrometry (LC–MS/MS) data-independent acquisition (DIA). Pooled control peptides were fractionated using strong cation exchange (SCX) chromatography and data acquired as data-dependent acquisition (DDA) to generate spectral libraries for fibroblasts (Fbs), HEK293T (HEK) and PBMCs. Raw data were searched using Spectronaut® software and data analyses were performed with a combination of Perseus software, Python and R. B Principal component analysis (PCA) of the fibroblast validation cohort (N = 24) relative to controls based on the differential abundance of whole cell proteins calculated from a two-sided t-test. C Venn diagram showing the coverage of Mitochondrial disease (v. 0.787, top panel) and Mendeliome (v. 0.12869, bottom panel) lists including green (diagnostic-grade) and amber (borderline diagnostic-grade) genes retrieved from PanelApp Australia [44]. D Summary of the genetic variant types analysed in the validation cohort (VC). E Summary of the findings in the VC based on protein identification and abundance. In 42% (10/24) of the cases, the protein expected to be affected by the genetic variant is not detected in the patient while it is detected in the controls. In 29% (7/24) of the cases, the protein is not detected via quantitative proteomics, in 21% (5/24) of the cases, the protein is decreased in abundance in the patient compared to the 5 controls, and in 4% (1/24) of the cases, the protein is increased compared to the controls analysed. SNV = single nucleotide variant. F Protein standard deviation from control median of the respective affected gene in controls (purple) and probands (red) in the validation cohort (VC). Standard deviation was calculated from the median control variance
Fig. 2
Fig. 2
Proteomics outperforms clinical respiratory chain enzymology in detection of mitochondrial disorders. A (left) Summary of the RCE results in fibroblasts according to the Bernier criteria [50]. (right) Summary of the RCE results in tissues (skeletal muscle, SKM or lymphoblastoid cell line, LCL) according to the Bernier criteria [50]. B Summary of the RCA results from quantitative proteomic data. C Pearson correlation between RCA results and respiratory chain enzymology results for complexes I, III and IV. D RCA results of OXPHOS complexes from the validation cohort showing the predicted affected complexes for each cell line. CI-V = complex I–V. Tr. = translation. Middle bar represents mean complex abundance. Upper and lower bars represent 95% confidence interval. Significance was calculated from a two-sided t-test between the individual protein means. **** = p < 0.0001, *** = p < 0.001, ** = p < 0.01, * = p < 0.05, ns = not significant, p > 0.05
Fig. 3
Fig. 3
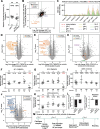
Proteomics supports the diagnosis of patients with suspected mitochondrial disorders. A Relative complex abundance (RCA) of complex V subunits in undiagnosed patient UDP1 (MT-ATP6) and diagnosed VC20 (MT-ATP6) patient. Middle bar represents mean complex abundance. Upper and lower bars represent 95% confidence interval. Significance was calculated from a two-sided t-test between the individual protein means. ns = not significant, p > 0.05. B Correlation between log2 fold-changes from whole-cell proteins from run-wise imputed data between undiagnosed patient UDP1 (MT-ATP6) and diagnosed patient VC20 (MT-ATP6) harbouring mutations in MT-ATP6 and controls showing reduced abundance in late assembly proteins, MT-ATP6 and ATP5MPL, for both patients. C Spectral intensity of the peptide containing the ATAD3A p.Thr228Met variant detected in the UDP1 patient but not in controls. D Volcano plot of whole cell proteins from SC1 (TMEM70) whole-cell skeletal muscle compared to controls (N = 3) showing reduced abundance of complex V subunits (orange dots). Vertical lines represent ± twofold-change equivalent and horizontal lines represent significance p value = 0.05 equivalent from a two-sided t-test. E Volcano plot of whole cell proteins from SC2 (TMEM70) whole-cell skeletal muscle compared to controls (N = 3) showing reduced abundance of complex V subunits (orange dots). Vertical lines represent ± twofold-change equivalent and horizontal lines represent significance p value = 0.05 equivalent from a two-sided t-test. F Relative complex abundance (RCA) of OXPHOS subunits in undiagnosed patient SC1 (TMEM70). Middle bar represents mean complex abundance. Upper and lower bars represent 95% confidence interval. Significance was calculated from a two-sided t-test between the individual protein means. **** = p < 0.0001, *** = p < 0.001, * = p < 0.05, ns = not significant, p > 0.05. G Relative complex abundance (RCA) of OXPHOS subunits in undiagnosed patient SC2 (TMEM70). Middle bar represents mean complex abundance. Upper and lower bars represent 95% confidence interval. Significance was calculated from a two-sided t-test between the individual protein means. **** = p < 0.0001, *** = p < 0.001, ** = p < 0.01, * = p < 0.05. H Volcano plot of whole cell proteins using run-wise imputed data from UDP4 (CCDC47) fibroblasts compared to controls showing reduced abundance of CCDC47. No significant changes to complex V proteins (orange). Vertical lines represent ± twofold-change equivalent and horizontal lines represent significance p value = 0.05 equivalent from a two-sided t-test. I Relative complex abundance (RCA) of OXPHOS complexes from UDP4 (CCDC47) fibroblasts compared to controls. * = p < 0.05, ns = not significant, p > 0.05. J Volcano plot of whole cell proteins from UDP5 (NDUFA10) fibroblasts compared to controls showing reduced abundance of NDUFA10 and other structural subunits of complex I. Vertical lines represent ± twofold-change equivalent and horizontal lines represent significance p value = 0.05 equivalent. Blue = complex I subunits. K Relative complex abundance (RCA) of OXPHOS complexes from UDP5 (NDUFA10) fibroblasts compared to controls (N = 4) showing isolated complex I defect. Middle bar represents mean complex abundance. Upper and lower bars represent 95% confidence interval. Significance was calculated from a two-sided t-test between the individual protein means. **** = p < 0.0001, * = p < 0.05, ns = not significant, p > 0.05. L NDUFA10 and HIBCH protein abundance from two-side t-test in SC3, a confirmed HIBCH proband, and UDP5 (NDUFA10) whole-cell fibroblasts compared to controls, showing an approximate half reduction in HIBCH levels in UDP5 (NDUFA10, HIBCH carrier) compared to SC3 and unchanged NDUFA10 levels in SC3. M Timeline for the rapid proteomics from live fibroblast sample receipt to results for UDP5 (NDUFA10) case achieved in less than 5 days
Fig. 4
Fig. 4
Utility of ultra-rapid proteomics supports the diagnosis of critically ill infants with suspected mitochondrial disorders. A Venn diagram showing the coverage of Mendeliome genes (PanelApp Australia Green and Amber entries, 4264 genes) in the fibroblast spectral library (55% of Mendeliome list of genes) and PBMC library (52% of Mendeliome list of genes). B Principal component analysis (PCA) of the pilot PBMC normative data (N = 36) for whole-cell proteins (top panel) and MitoCarta3.0 proteins (lower panel). C Scatter plot showing the correlation between PBMC (SC4) and fibroblast (SC5) samples based on log2 fold-changes from whole-cell proteins in a diagnosed patient with variants in MRPL50 relative to controls [26] showing reduced abundance of the proteins belonging to the large subunits of the mitochondrial ribosome (mtLSU; purple), mtSSU = mitoribosome small subunit (orange). D Volcano plot of whole cell proteins from UDP6 (NDUFA13) PBMCs compared to controls (N = 5) showing reduced abundance of NDUFA13 (orange dot) and other structural subunits of complex I. Vertical lines represent ± twofold-change equivalent and horizontal lines represent significance p value = 0.05 equivalent. Blue = complex I subunits. E Relative complex abundance (RCA) of OXPHOS complexes from UDP6 (NDUFA13) PBMCs compared to controls (N = 5) showing an isolated complex I defect. Middle bar represents mean complex abundance. Upper and lower bars represent 95% confidence interval. Significance was calculated from a two-sided t-test between the individual protein means. **** = p < 0.0001, * = p < 0.05, ns = not significant, p > 0.05. F Protein range for NDUFA13 in PBMCs in UDP6 (NDUFA13, red dot) and controls (N = 5, purple dots) showing standard deviation of − 12.2 from the control median. G Volcano plot of whole cell proteins from UDP7 (NDUFAF6) PBMCs compared to controls (N = 5) showing reduced abundance of NDUFS8 and other structural subunits of complex I. Vertical lines represent ± twofold-change equivalent and horizontal lines represent significance p value = 0.05 equivalent. Blue = complex I subunits. H Relative complex abundance (RCA) of OXPHOS complexes from UDP7 (NDUFAF6) PBMCs compared to controls (N = 5) showing an isolated complex I defect. Middle bar represents mean complex abundance. Upper and lower bars represent 95% confidence interval. Significance was calculated from a two-sided t-test between the individual protein means. **** = p < 0.0001, ** = p < 0.01, ns = not significant, p > 0.05. I Timeline for ultra-rapid proteomics from PBMC sample receipt to results for UDP8 (NDUFS8) case achieved in less than 3 business days. J Volcano plot of whole cell proteins from UDP8 (NDUFS8) PBMCs compared to controls (N = 5) showing reduced abundance of NDUFS8 protein (orange dot) and other structural subunits of complex I. Vertical lines represent ± twofold-change equivalent and horizontal lines represent significance p value = 0.05 equivalent. Blue = complex I subunits. K Relative complex abundance (RCA) of OXPHOS complexes from UDP8 (NDUFS8) PBMCs compared to controls (N = 5) showing isolated complex I defect. Middle bar represents mean complex abundance. Upper and lower bars represent 95% confidence interval. Significance was calculated from a two-sided t-test between the individual protein means. **** = p < 0.0001, ** = p < 0.01, * = p < 0.05, ns = not significant, p > 0.05. L Protein range for NDUFS8 in PBMCs in UDP8 (NDUFS8, red dot) and controls (N = 5, purple dots) showing standard deviation of − 9.3 from the control median

Comment in

References

    1. Haack TB, Haberberger B, Frisch EM, Wieland T, Iuso A, Gorza M, et al. Molecular diagnosis in mitochondrial complex I deficiency using exome sequencing. J Med Genet. 2012;49(4):277–83. - PubMed
    1. Taylor RW, Pyle A, Griffin H, Blakely EL, Duff J, He L, et al. Use of whole-exome sequencing to determine the genetic basis of multiple mitochondrial respiratory chain complex deficiencies. JAMA. 2014;312(1):68–77. - PMC - PubMed
    1. Ohtake A, Murayama K, Mori M, Harashima H, Yamazaki T, Tamaru S, et al. Diagnosis and molecular basis of mitochondrial respiratory chain disorders: exome sequencing for disease gene identification. Biochim Biophys Acta. 2014;1840(4):1355–9. - PubMed
    1. Wortmann SB, Koolen DA, Smeitink JA, van den Heuvel L, Rodenburg RJ. Whole exome sequencing of suspected mitochondrial patients in clinical practice. J Inherit Metab Dis. 2015;38(3):437–43. - PMC - PubMed
    1. Davis RL, Kumar KR, Puttick C, Liang C, Ahmad KE, Edema-Hildebrand F, et al. Use of whole-genome sequencing for mitochondrial disease diagnosis. Neurology. 2022;99(7):e730–42. - PMC - PubMed

LinkOut - more resources