. 2025 May 21;21(1):24.
doi: 10.1186/s13223-025-00968-1.

Association of myeloid cell reactivity patterns with safe food predictions in FPIES patients

Affiliations

Association of myeloid cell reactivity patterns with safe food predictions in FPIES patients

Georgiana M Sanders et al. Allergy Asthma Clin Immunol. .

Abstract

Background: Food protein-induced enterocolitis syndrome (FPIES) is an understudied non-IgE-mediated food allergy, which is distinct from and lacks diagnostic testing akin to IgE testing. FPIES affects infants and toddlers but can persist into adulthood. As there are no extant methods to identify safe foods for FPIES patients, food ingestion trials are performed at home and often lead to reactions and development of food aversions, which may lead to failure-to-thrive and gastric feeding tube requirements. We hypothesized that foods that fail to elicit responses in immune cells of FPIES patients would be safe to ingest, which could support development of a diagnostic method to headstart safe food identification in patients.

Methods: We developed an ex vivo model of FPIES using food-stimulated white blood cells (WBCs) from pediatric FPIES patients and controls by defining a 9-gene panel representative of FPIES ex vivo responses and conducted a single-arm pilot clinical trial.

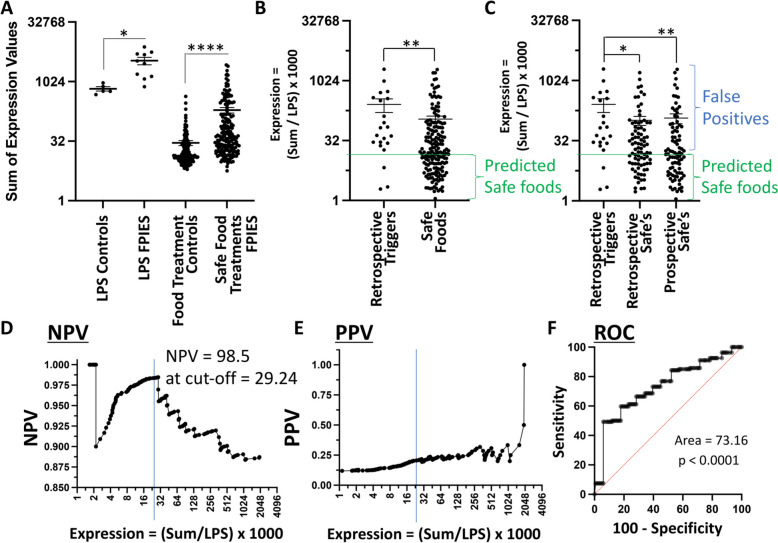
Results: Myeloid cells of FPIES patients displayed variable individual-specific myeloid cell reactivity patterns (iMCRPs) to different foods. Foods that failed to elicit repsonses in patients' immune cells were safe to ingest with a negative predictive value of 98.5%. This, when utilized in prospective predictions, reduced newly introduced food reaction rates from 19.5 to 0% while increasing food repertoire diversity.

Conclusions: iMCRPs represent a novel and potentially useful tool that associates with safe food ingestion in FPIES patients for foods that fail to elicit immune cell reactions. Trial Registration The trial has been registered at registered at ClinicalTrials.gov # NCT04644783.

Keywords: Diarrhea; FPIES; Food allergy; Gastrointestinal inflammation; Non-IgE food allergy; Vomiting.


Conflict of interest statement

Declarations. Ethics approval and consent to participate: The study was approved by the Institutional Review Board (IRB) at the University of Michigan under IRB protocol # HUM00156027. Written informed consent was signed for by one one of the participants’ parents or guardians. Recruitment of FPIES participants was conducted under a single-arm clinical trial of 10 FPIES participants, registered at ClinicalTrials.gov (NCT04644783). Blood samples from 5 de-identified non-FPIES participants were collected independently of the clinical trial, serving as an external control arm under IRB protocol #HUM00208717. Consent for publication: Not applicable. Competing interests: The authors declare no competing interests.

Figures

Fig. 1
Fig. 1
Case study identifies 9-gene panel associated with FPIES triggers. A Microarray heatmap of 208 genes that are induced by treating FPIES patient’s WBCs ex vivo with 2 known triggers versus 2 known safe foods. Each column represents one treatment including untreated, LPS, 2 known safe foods, 2 known trigger foods, and individual food treatments of unknown safe or trigger status. B 9-gene RT-qPCR panel representative of the gene induction in (A). C Correlation of the sum of expression of the 9-gene panel vs the 208-gene panel. Each data point represents one treatment comprising untreated, LPS, or individual food treatments. D Clustering of foods by a k-means clustering algorithm, for the 30 highest induced genes by the two trigger foods, separates a response-lacking food cluster (Cluster 1) from a response-triggering food cluster (Cluster 2). The two clusters are also listed under the heatmap in (B)
Fig. 2
Fig. 2
Corroboration of the association of the 9-gene panel with FPIES reactions. A Different FPIES participants exhibit individual-specific inter-participant variability in their WBC response to the same food treatments. Each data point per treatment represents one participant. Values are normalized to the responses in control non-FPIES participants. B UMAP clustering showing induction of the 9-gene panel in myeloid cells in response to LPS or trigger food stimulation (black arrow), by scRNA-Seq. C Violin plots of the 9-gene panel (scRNA-Seq) expression in myeloid cells. D-F PCA plots showing the clustering of genes following untreated, safe food, trigger food, or LPS treatment after clustering for myeloid cell genes (D), T cell genes (E), or total cell genes (F). G Corroboration of the induction of each gene of the 9-gene panel by scRNA-Seq from 2 safe food treatments versus 3 trigger food treatments from 2 patients
Fig. 3
Fig. 3
Prediction of safe foods for FPIES participants. A Expression values of the 9-gene panel of FPIES participants’ WBC responses to LPS or safe food treatments relative to non-FPIES control participants’ WBCs. The data points are representative of pooled responses from 10 FPIES participants relative to 5 non-FPIES controls B, C Expression values from the 9-gene panel in safe versus trigger foods pooled from 10 FPIES participants and normalized to LPS. The NPV threshold of 29.24 for safe food predictions is annotated. Foods known to be safe retrospectively versus prospective safe food predictions are stratified in (C). ****p < 0.0001; **p < 0.01; *p < 0.05. D Graph representing NPV values relative to expression values. The optimal cutoff expression value of 29.3 for an NPV value of 98.5% is annotated. E Graph representing PPV values. F ROC curve. ****p < 0.0001
Fig. 4
Fig. 4
Improved outcomes in participants following assay predictions relative to standard of care. A Percentage of participants with subsequent reactions after first encounter with an allergist who followed the standard of care recommendations versus assay predictions. B Percentage of newly introduced foods causing FPIES reactions in a representative 20-participant sub-cohort (of the 113-patient cohort) who followed the standard of care recommendations relative to 10 participant cohort who followed assay predictions. * p < 0.05. C The number of foods introduced per patient in the 20-participant sub-cohort (following SOC) relative to 10-participant cohort (following assay predictions). D Percentages of successfully introduced foods by food category (low, medium, or high risk) in the representative 20 sub-cohort participants who followed the standard of care recommendations versus the 10 participant cohort who followed assay predictions

References

    1. Nowak-Wegrzyn A, Chehade M, Groetch ME, Spergel JM, Wood RA, Allen K, et al. International consensus guidelines for the diagnosis and management of food protein-induced enterocolitis syndrome: executive summary-workgroup report of the adverse reactions to foods committee, American academy of allergy, asthma & immunology. J Allergy Clin Immunol. 2017;139(4):1111-26 e4. - PubMed
    1. Berin MC. Advances in understanding immune mechanisms of food protein-induced enterocolitis syndrome. Ann Allergy Asthma Immunol. 2021;126(5):478–81. - PubMed
    1. Leonard SA, Pecora V, Fiocchi AG, Nowak-Wegrzyn A. Food protein-induced enterocolitis syndrome: a review of the new guidelines. World Allergy Organ J. 2018;11(1):4. - PMC - PubMed
    1. Nowak-Wegrzyn A, Warren CM, Brown-Whitehorn T, Cianferoni A, Schultz-Matney F, Gupta RS. Food protein-induced enterocolitis syndrome in the US population-based study. J Allergy Clin Immunol. 2019;144(4):1128–30. - PMC - PubMed
    1. Anvari S, Ruffner MA. Adult food protein-induced enterocolitis syndrome. Front Allergy. 2022;3: 889879. - PMC - PubMed

Associated data

LinkOut - more resources