. 2025 May 22;13(1):111.
doi: 10.1186/s40478-025-02039-3.

Dose-dependent CHCHD10 dysregulation dictates motor neuron disease severity and alters creatine metabolism

Affiliations

Dose-dependent CHCHD10 dysregulation dictates motor neuron disease severity and alters creatine metabolism

Sandra Harjuhaahto et al. Acta Neuropathol Commun. .

Abstract

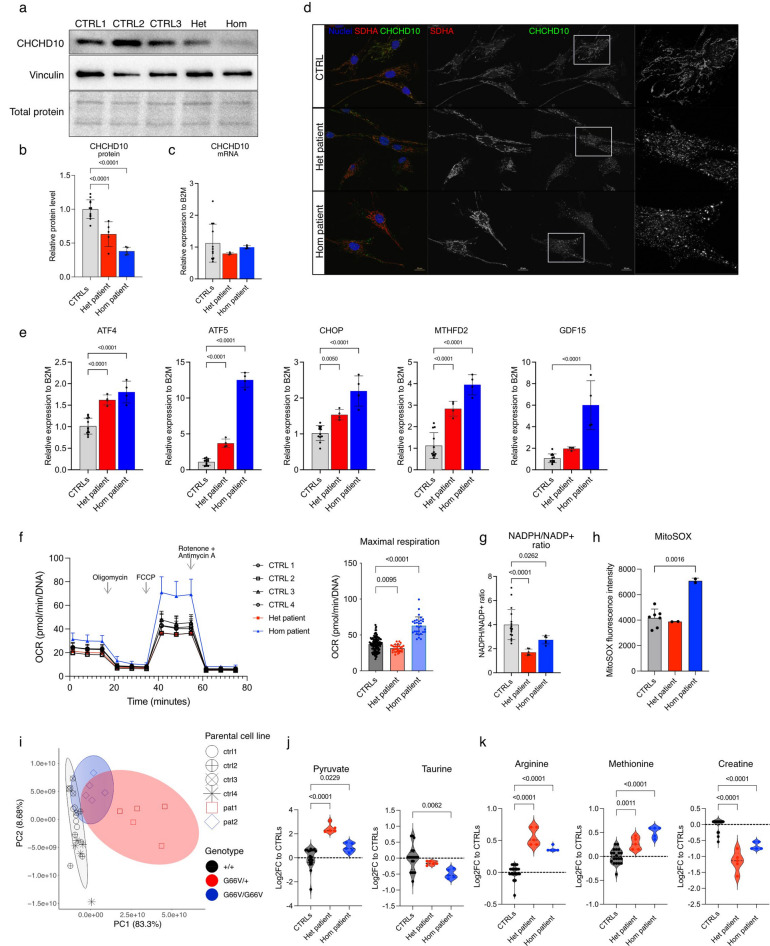
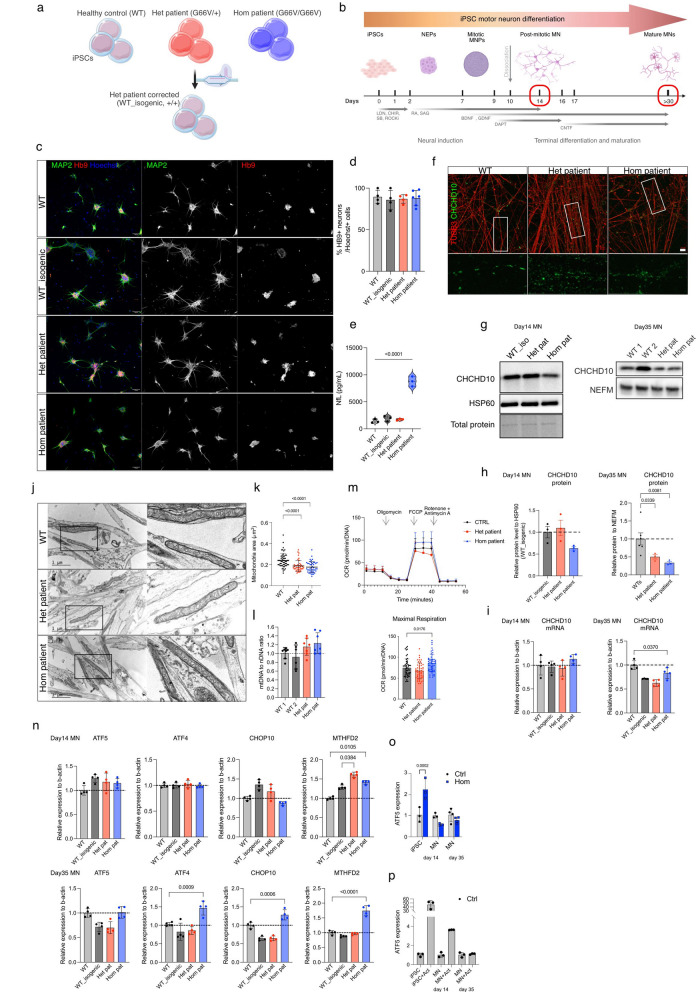
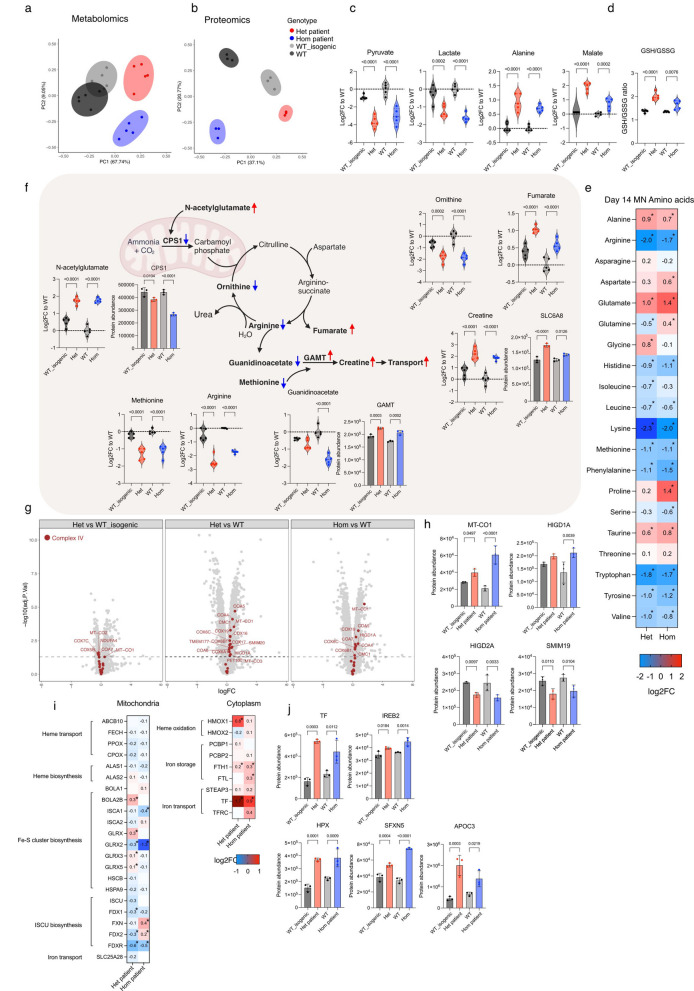
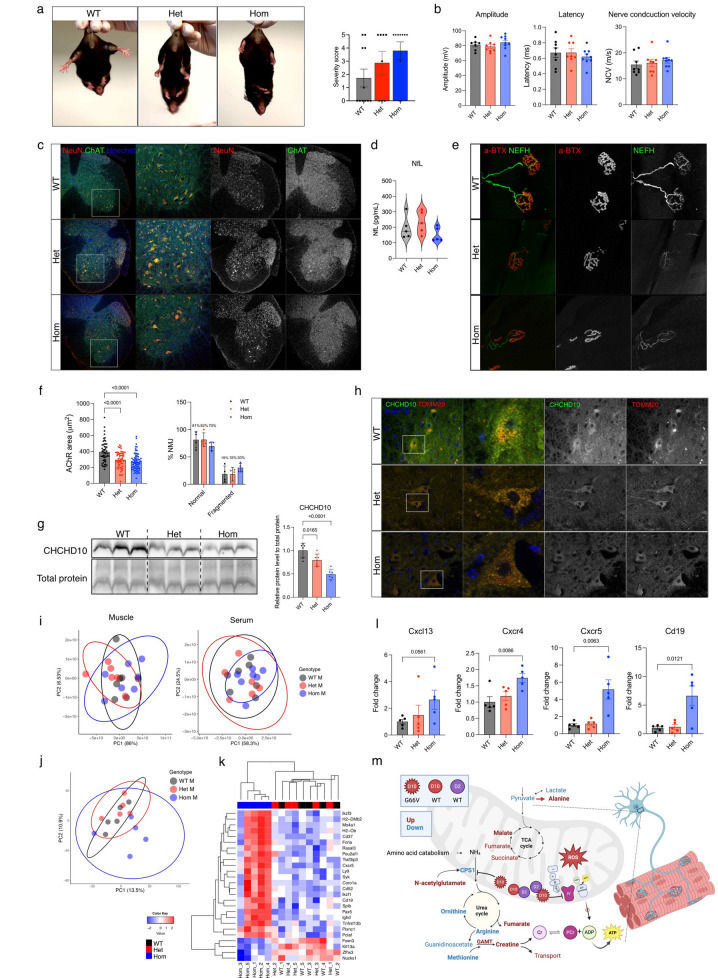
Dominant defects in CHCHD10, a mitochondrial intermembrane space protein, lead to a range of neurological and muscle disease phenotypes including amyotrophic lateral sclerosis. Many patients present with spinal muscular atrophy Jokela type (SMAJ), which is caused by heterozygous p.G66V variant. While most disease variants lead to aggregation of CHCHD10 and activation of proteotoxic stress responses, the pathogenic mechanisms of the p.G66V variant are less clear. Here we report the first homozygous CHCHD10 patient, and show that the variant dosage dictates the severity of the motor neuron disease in SMAJ. We demonstrate that the amount of the mutant CHCHD10 is reduced, but the disease mechanism of p.G66V is not full haploinsufficiency as residual mutant CHCHD10 protein is present even in a homozygous state. Novel knock-in mouse model recapitulates the dose-dependent reduction of mutant CHCHD10 protein and the slow disease progression of SMAJ. With metabolome analysis of patients' primary fibroblasts and patient-specific motor neurons, we show that CHCHD10 p.G66V dysregulates energy metabolism, leading to altered redox balance and energy buffering by creatine metabolism.

Keywords: ALS; CHCHD10; CHCHD2; Creatine; Metabolomics; Mitochondria.


Conflict of interest statement

Declarations. Ethics approval and consent to participate: Animal experiments were performed in compliance with the national ethical guidelines set by the European Union and were approved by the National Animal Experiment Board (Project Authorisation Board, project license ESAVI-12691-2021). The ethical practice of handling laboratory animals was strictly followed throughout the procedures. The generation of the human induced pluripotent stem cell lines used in this study was approved by the Coordinating Ethics Committee of the Helsinki and Uusimaa Hospital District (Nro 423/13/03/00/08) with informed consent of the donor. Consent for publication: Written and informed consent of patient was received prior examination for results and the usage of photographs for publication. Competing interests: The authors declare that they have known competing financial interests or personal relationships that could have appeared to influence the work reported in this paper. L.E. is a co-founder of NADMED Ltd. L.V.D.B. is the scientific founder of Augustine Therapeutics and is head of the Scientific Advisory Board. L.V.D.B. is also part of the Investment Advisory Board of Droia Ventures (Meise, Belgium). Authors declare no other conflicts of interest.

Figures

Fig. 1
Fig. 1
Phenotype of the unique patient with biallelic CHCHD10 p.G66V variant. (A) Family tree of the investigated patient. Black square indicates the proband. (B) Clinical assessment of the proband showed moderate upper limb weakness and severe lower limb atrophy, also in tongue. Metacarpophalangeal hyperextension and the distal and proximal interphalangeal joint flexion caused by weakness of small intrinsic hand muscles (claw hand) (upper panel). Distal lower limb weakness, patient is trying to dorsiflex ankles (middle panel). Weak, atrophic tongue (lower panel). (C) MRI showing significant muscle atrophy and fatty tissue replacement of lower limb muscles. (D) Mitochondrial pathology with 15–20% COX-negative-SDH hyperreactive fibers, ragged red fibers (Gomori Trichorme) with fiber size variability and internalized nuclei in 80% of muscle fibers. (E) Transmission electron micrograph from patient muscle biopsy showing severely disorganized cristae (indicated by red asterisk). (F) XL-PCR revealed multiple deletions in mtDNA of the skeletal muscle in the patient with homozygous p.G66V mutation in CHCHD10. Lane 1: positive control for single mtDNA deletion from an unrelated patient’s muscle biopsy; lane 2: a control subject with no deletions in mtDNA in skeletal muscle; lanes 3 and 4, replicates of the muscle biopsy with homozygous p.G66V variant in CHCHD10; lane 5, positive control for multiple mtDNA deletions from an unrelated patient’s muscle biopsy; lane 6, size marker. Black arrow indicates the size of intact mtDNA. Black arrow indicates the size of intact mtDNA
Fig. 2
Fig. 2
Dose dependent changes in expression of integrated stress response markers and one-carbon metabolism in CHCHD10 p.G66V patient fibroblasts. (A) Immunoblot of CHCHD10 levels from whole cell lysates. (B) Quantification of CHCHD10 levels from whole cell lysates normalized to total protein (4 control cell lines, n = 3 technical replicates/ctrl, n = 5 technical replicates/patient). (C) Expression of CHCHD10 in patient fibroblasts relative to B2M (3 control lines, n = 4 technical replicates each). (D) Representative immunocytochemistry images of control and heterozygous and homozygous patient fibroblasts stained with antibody against CHCHD10 (green), SDHA (red) and nucleus (blue). Scale bar 20 μm. (E) Expression of ATF4, ATF5, CHOP, MTHFD2 and GDF15 in patient fibroblasts relative to B2M (3 control lines pooled, n = 4 technical replicates). (F) Oxygen consumption rate (OCR) measurement in fibroblasts using Seahorse XF96 Analyzer. Maximal respiration was assessed following mitochondrial uncoupling by FCCP. 4 ctrl lines pooled, 13–16 technical replicates/cell line/run. All data points shown. Two independent experiments. (G) Ratio NADPH/ NADP + was measured with colorimetric assay. Results normalized to total protein amount (3 ctrl lines pooled, 6 technical replicates each). (H) Mitochondrial superoxide production measured with MitoSOX assay as fluorescence intensity 4 ctrl lines pooled, 2 technical replicates/cell line). (I) PCA plot describing overall variance within metabolite profiles. 4 control cell lines, 5 technical replicates/cell line. (J) Increased pyruvate and decreased taurine metabolite levels determined from metabolomics data. 4 control cell lines, 5 technical replicates/cell line (represented as log2(fold change) [log2(FC)]). (K) Increased arginine and methionine metabolite levels and decreased creatine in patient fibroblasts determined from metabolomics data. 4 control cell lines, 5 technical replicates/cell line (represented as log2(fold change) [log2(FC)]). Data shown as mean ± standard deviation; P < 0.05 were considered significant by one-way ANOVA followed by Fisher’s LSD’s multiple comparison post-hoc test. Quantifications show all measured data points, results are presented relative to the average of all measured control data points
Fig. 3
Fig. 3
mtISR induction is diminished upon motor neuron differentiation of patient-specific iPSC. (A) Diagram showing the cell lines used for motor neuron differentiation. (B) Diagram showing motor neuron differentiation protocol and timeline for sample collection. (C) Representative immunocytochemistry images showing positive staining for neuronal marker MAP2 (green) and motor neuronal marker HB9 (red) in d35-MN. Scale bar 50 μm. (D) Quantification of HB9-positive motor neurons in d35-MN. Total Hoechst-positive nuclei calculated in 4–6 independent fields of view/cell line (total n = 140–412 nuclei/cell line). (E) NfL amount in motor neuron culture media in d35-MN. (F) Representative immunocytochemistry image of staining with CHCHD10 (green) in neurites (TUBB3, red) antibodies in d35-MN. Scale bar 10 μm. (G) Immunoblotting of CHCHD10 at d14 and d35-MN from total cell lysates. (H) Quantification of CHCHD10 immunoblotting shows the results from three cultures per cell line, normalized to mitochondrial marker HSP60 (d14-MN, WT_isogenic used as control, n = 3/cell line) or neuronal marker NEFM (d35, 2 independent control cell lines, n = 3/cell line). (I) Expression of CHCHD10 in d14 and d35-MN normalized to b-actin (n = 4/cell line). (J) Mitochondrial ultrastructure analysis by transmission electron microscopy in patient and control d35-MN. The right panel of each image is a magnification of the area indicated by the square in the left panel. Representative images of MN neurites are shown. Scale bars are indicated. (K) Quantification of mitochondrial area (µm2) in electron micrographs (n = average area/image, 42–56 images/cell line). (L) mtDNA copy number was analyzed by qRT-PCR (n = 6–7 replicates/cell line). (M) Oxygen consumption rate (OCR) measurement in d35-MN using Seahorse XF96 Analyzer. Maximal respiration was assessed upon uncoupling with FCCP (two independent experiments with n = 24–28 replicates/run). (N) Expression of mtISR related transcripts (ATF5, ATF4, CHOP10, MTHFD2) in d14 and d35-MN normalized to b-actin (n = 4/cell line). (O) Expression of ATF5 in control and homozygous iPSC, d14-MN and d35-MN (n = 3/genotype). (P) Expression of ATF5 after treatment with actinonin in control iPSC, d14-MN and d35-MN (n = 3). Data shown relative to untreated condition (ethanol as vehicle). Data shown as mean ± standard deviation; P < 0.05 were considered significant by one-way ANOVA followed by Fisher’s LSD’s multiple comparison post-hoc test. Quantifications show all measured data points, results are presented relative to the average of all measured control data points
Fig. 4
Fig. 4
Multiomics approach reveals metabolic remodeling and altered creatine pathway during motor neuron differentiation. (A) PCA showing overall differential metabolite abundances between patients and control d14-MN (n = 5/cell line). (B) PCA showing overall differential protein abundances between patients and control d14-MN (n = 3/cell line). (C) Pyruvate and lactate metabolite abundances are reduced, and alanine and malate are increased in patient d14-MN. (D) GSH/GSSG ratio determined from metabolomics data (n = 5/cell line). (E) Heatmap of amino acids levels in heterozygous and homozygous d14-MN. (n = 5/cell line, *adj.p < 0.05, considered significant). (F) Schematic of metabolites and proteins associated with urea cycle and creatine metabolism. Red arrows indicate upregulation and blue arrows downregulation. (G) Volcano plots of OXPHOS CIV subunits and assembly factors (highlighted as red). (H) Protein abundancies of subunit mt-CO1 and assembly factors HIGD1A, HIGD2A and SMIM1 (n = 3/cell line). (I) Heatmaps of mitochondrial and cytoplasmic proteins involved in iron metabolism (n = 3/cell line). (J) Protein abundancies of TF, IREB2, HPX, SFXN5 and APOC3. Data represented as as log2(fold change) [log2(FC)] or as indicated. All comparisons are between heterozygous patient to WT_isogenic, and homozygous patient to WT. Data shown as mean ± standard deviation; *p < 0.05 were considered significant by one-way ANOVA followed by Fisher’s LSD’s multiple comparison post-hoc test
Fig. 5
Fig. 5
Homozygous Chchd10G66V mice show loss of CHCHD2/CHCHD10 complexes in muscle but do not develop mitochondrial myopathy. (A) Generation of p.G66V (p.G62V in mouse) knockin mice was confirmed by sequencing of cDNA from muscle. Red box indicates the site c.186 G→T (p.G62V) (in human c.197 G→T, p.G66V) mutation introduced by gene editing in the Chchd10 gene. (B) Heterozygous and homozygous Chchd10G66V mice have a normal appearance at P365. (C) Body weight curve of male and female mice until P550 (n = 21/genotype, male; n = 15/genotype, female). (D) Fat and lean mass normalized to body weight measured with EchoMRI at P550 (n = 7–8/genotype, males; n = 4–5, females). (E) Grip strength (N/g) normalized to body weight. Exercise endurance assessed with treadmill indicated as the distance travelled (m) until fatigue. Time points for measurements 6, 12, and 18 months (n = 5–7/genotype/timepoint, males; n = 4–7/genotype/timepoint, females). Upper panels represent male mice, lower panels female mice. (F) Representative histological stainings from P550 quadriceps femoris (QF) muscle. Left panel H&E staining, middle panel COX-SDH activity. Black box indicates a magnification of the area indicated shown in the left panel. Scale bar 100 μm. (G) Quantification of circularity (0–1/fiber) of muscle fibers from H&E stained QF muscle (n = 3–4/genotype/sex, 94–190 fibers/animal). (H) Creatine kinase (CK) levels in P550 mouse serum (n = 6–7/genotype, males; n = 5/genotype, females). (I) Transmission electron micrograph of QF muscle. (J) Long-range PCR of mouse QF muscle for mtDNA deletions at P550 (n = 4/genotype). (K) Representative immunohistochemistry with CHCHD10 (green) and VDAC/porin (red) antibodies of QF muscle. (L) Immunoblotting and quantification with CHCHD10 antibody from QF muscle normalized to total protein (n = 4–5/genotype). (M) Native-PAGE and immunoblotting with CHCHD10 and CHCHD2 antibodies from QF muscle (n = 4/genotype). Chchd10S59L and Chchd10G58R heart used as positive and negative control for aggregation, respectively. Total protein shown as loading control. (N) Filter trap with CHCHD10 and CHCHD2 antibodies from QF muscle lysates. Chchd10S59L and Chchd10G58R heart used as positive and negative control for aggregation, respectively. Data shown as mean ± standard deviation; P < 0.05 were considered significant by one-way ANOVA followed by Fisher’s LSD’s multiple comparison post-hoc test. Quantifications show all measured data points, results are presented relative to the average of all measured WT values
Fig. 6
Fig. 6
Chchd10G66V mice show initial neuromuscular pathology and inflammatory response in muscle. (A) Motor performance assessed with hindlimb clasping test in P550 mice. Representative images of clasping test and performance rated by severity score (n = 5–7/genotype, males; n = 3–4/genotype, females). (B) Compound muscle action potentials (CMAP) measured from gastrocnemius muscle upon stimulation of sciatic nerve at P550. Amplitude (mV), latency (ms) and nerve conduction velocity (m/s) shown (n = 7–9/genotype). (C) Representative immunohistochemistry image of lumbar spinal cord stained with NeuN (red) and ChAT (green) antibodies. (D) NfL levels in mouse serum at P550 (n = 5/genotype). (E) Representative immunohistochemistry image of neuromuscular junction. Acetylcholine receptors stained with a-BTX (red) and nerve with NEFH (green) antibodies. (F) Quantification of acetylcholine receptor area (a-BTX positive area) and percentage of fragmented neuromuscular junctions in all imaged fields (n = 4 animals/genotype, 11–21 neuromuscular junctions/animal). (G) Immunoblotting and quantification of CHCHD10 in mouse spinal cord. Quantification shows n = 6/genotype (3 females, 3 males). (H) Representative immunohistochemistry of lumbar spinal cord, stained with mitochondrial marker TOMM20 (red), and CHCHD10 (green) antibodies. (I) PCA showing overall metabolite profile between WT and Chchd10G66V mice in muscle and serum (n = 6–7/genotype, males). (J) PCA showing overall gene expression profile between WT and Chchd10G66V mice in muscle (n = 5/genotype, males). (K) Heatmap showing top 25 significantly changed transcripts in homozygous Chchd10G66V mouse muscle. (L) Expression of Cxcl13, Cxcr4, Cxcr5 and Cd19 in Chchd10G66V mouse muscle. Data shown as relative to control expression (n = 5/genotype). (M) Illustration of the proposed pathogenic effects of CHCHD10 p.G66V variant. Data shown as mean ± standard deviation; P < 0.05 were considered significant by one-way ANOVA followed by Fisher’s LSD’s multiple comparison post-hoc test

References

    1. Bannwarth S, Ait-El-Mkadem S, Chaussenot A, Genin EC, Lacas-Gervais S, Fragaki K, Berg-Alonso L, Kageyama Y, Serre V, Moore DG, Verschueren A, Rouzier C, Le Ber I, Augé G, Cochaud C, Lespinasse F, N’guyen K, De Septenville A, Brice A, Yu-Wai-Man P, Sesaki H, Pouget J, Paquis-Flucklinger V (2014) A mitochondrial origin for frontotemporal dementia and amyotrophic lateral sclerosis through CHCHD10 involvement. Brain 137:2329–2345. 10.1093/brain/awu138 - PMC - PubMed
    1. Chaussenot A, Le Ber I, Ait-El-Mkadem S, Camuzat A, de Septenville A, Bannwarth S, Genin EC, Serre V, Augé G, Brice A, Pouget J, Paquis-Flucklinger V (2014) Screening of CHCHD10 in a French cohort confirms the involvement of this gene in frontotemporal dementia with amyotrophic lateral sclerosis patients. Neurobiol Aging 35:2884e1–2884e4. 10.1016/j.neurobiolaging.2014.07.022 - PubMed
    1. Consortium PMALSS (2018) CHCHD10 variants in amyotrophic lateral sclerosis: where is the evidence? Ann Neurol 84:110–116. 10.1002/ana.25273 - PMC - PubMed
    1. Johnson JO, Glynn SM, Gibbs JR, Nalls MA, Sabatelli M, Restagno G, Drory VE, Chiò A, Rogaeva E, Traynor BJ (2014) Mutations in the CHCHD10 gene are a common cause of Familial amyotrophic lateral sclerosis. Brain 137:e311 - PMC - PubMed
    1. Müller K, Andersen PM, Hübers A, Marroquin N, Volk AE, Danzer KM, Meitinger T, Ludolph AC, Strom TM, Weishaupt JH (2014) Two novel mutations in conserved codons indicate that CHCHD10 is a gene associated with motor neuron disease. Brain 137:e309 - PubMed

Publication types

LinkOut - more resources