. 2025 Jul;247(2):774-790.
doi: 10.1111/nph.70198. Epub 2025 May 21.

Role of LEAFLESS, an AP2/ERF family transcription factor, in the regulation of trichome specialized metabolism

Affiliations

Role of LEAFLESS, an AP2/ERF family transcription factor, in the regulation of trichome specialized metabolism

Sabyasachi Mandal et al. New Phytol. 2025 Jul.

Abstract

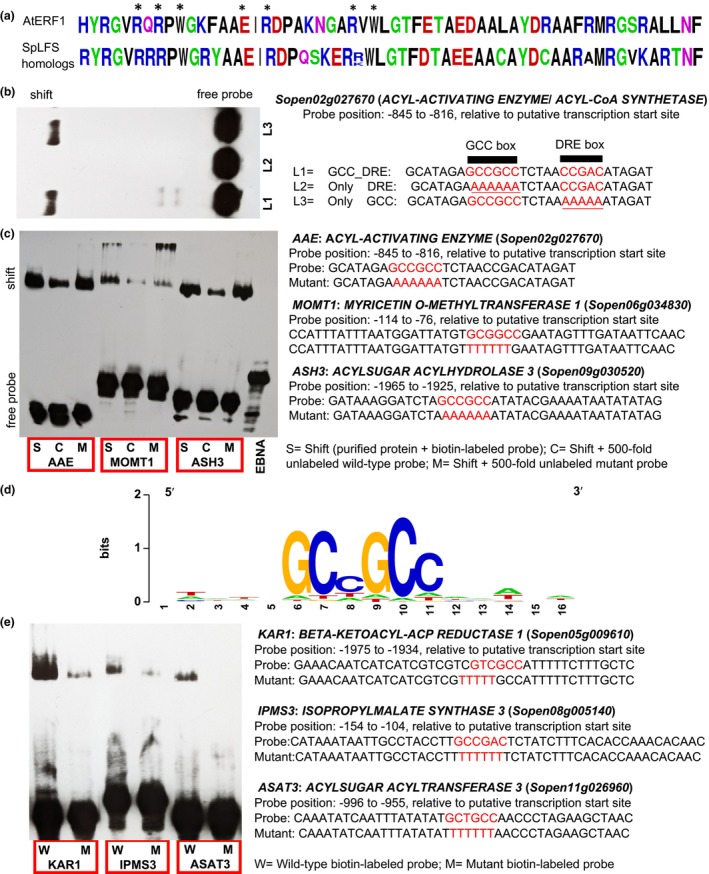
Acylsugars, specialized metabolites produced by trichomes of many solanaceous species, provide protection against biotic and abiotic stresses. Many acylsugar metabolic enzymes have been identified; however, regulatory factors remain unknown. Our multidisciplinary approaches identified LEAFLESS (APETALA 2/ ETHYLENE RESPONSE FACTOR (AP2/ERF) family member) as a positive regulator of acylsugar biosynthesis. Virus-induced gene silencing (VIGS) of LEAFLESS in Solanum pennellii (SpLFS/Sopen05g008450) revealed its distinct roles in two related but separate processes: acylsugar biosynthesis and trichome development. Most acylsugar (and several flavonoid) metabolic genes were downregulated in SpLFS-silenced plants and showed strong co-expression with SpLFS. Phylogenetic and additional data analyses indicated trichome-enriched expression of SpLFS orthologs in other acylsugar-producing solanaceous species, and VIGS of SpLFS orthologs in Nicotiana benthamiana reduced acylsugar production. Transcriptional reporter showed expression of SpLFS in type I/IV trichome tip cells, the site of acylsugar biosynthesis. Electrophoretic mobility shift assays indicated that SpLFS directly binds to promoters of several acylsugar (and flavonoid) metabolic genes. Additionally, data mining suggested remarkable spatiotemporal functional diversity: from coordinating leaf initiation at incipient primordia (previously reported for the S. lycopersicum ortholog SlLFS/Solyc05g013540) to regulating trichome specialized metabolism (acylsugar and flavonoid). Our work highlights a critical role of LEAFLESS in trichome specialized metabolism, paving the way to disentangle the acylsugar regulatory network.

Keywords: AP2/ERF; LEAFLESS; Solanaceae; WGCNA; acylsugar; flavonoid; trichome; virus‐induced gene silencing.


Conflict of interest statement

None declared.

Figures

Fig. 1
Fig. 1
SpLFS as a candidate transcription factor (TF) for acylsugar metabolism. ‘Sopen’ prefix was removed from gene IDs of six candidate TF genes. SpLFS (Sopen05g008450) is highlighted in red. (a) Expression of candidate TF genes in isolated stem trichomes relative to underlying tissues of shaved stems (normalized to onefold) in Solanum pennellii. Error bars indicate SE (n = 5 individual plants). Orthologs of S. lycopersicum trichome tip‐cell‐expressed ASAT genes (Schilmiller et al., ; Fan et al., 2016) are included for comparisons. (b, c) Differential expression of candidate TF genes in high‐ and low‐acylsugar‐producing accessions of S. pennellii (b) and in response to imazapyr treatment (acylsugar inhibitor) (c). False discovery rates are shown next to fold‐difference values. Data for (b) and (c) were obtained from Mandal et al. (2020).
Fig. 2
Fig. 2
Functional validation of SpLFS. (a) Virus‐induced gene silencing (VIGS) of SpLFS reduces acylsugar production in S. pennellii. Normalized liquid chromatography–mass spectrometry (LC‐MS) chromatogram peak areas were used to quantify acylsugar amounts (n = 15 individual plants; ****, P < 0.0001; Welch t‐test). Normalization was done by dividing total acylsugar peak areas by internal standard (ISTD) area and leaf dry weight (LDW). Individual data points are shown in boxplots; boxes indicate the lower quartile, the median, and the upper quartile values, whereas the whiskers show the range. (b) Representative chromatograms (normalized by internal standard and leaf dry weight) showing acylsugar peaks in control and VIGS plants. The inset shows VIGS of a phytoene desaturase gene that was used as an independent positive control (photobleached phenotype). (c) Acyl chain compositions of acylsugars extracted from control and VIGS plants (major acyl chains are shown). Me, methyl; C3–C12 indicate acyl chain length (e.g. 2‐MeC3 and n‐C10 indicate 2‐methylpropanoate and n‐decanoate, respectively). Combined amounts of major acyl chains in control and VIGS plants are shown next to individual acyl chain bar graphs. (d) Reduction in a flavonoid compound (panel b) in VIGS plants. For (c, d), error bars indicate SE (n = 15 individual plants; ****, P < 0.0001; Welch t‐test). (e) Correlation between SpLFS expression levels and glandular trichome (GT) density in VIGS plants (n = 10 individual plants). (f) Correlation between SpLFS expression levels and acylsugar levels in VIGS plants (n = 10 individual plants). For (e, f), SpLFS transcript levels in VIGS plants were measured relative to the control group of plants (normalized to level 1.000) by RT‐qPCR (primers were designed outside the VIGS‐targeted region).
Fig. 3
Fig. 3
Analysis of SpLFS‐target genes. (a) Relative expression levels of known and candidate acylsugar (and flavonoid) metabolic genes in control (set to 100% transcript) and virus‐induced gene silencing (VIGS) plants, based on RNA‐Seq analysis (n = 5 individual plants). ‘Sopen’ prefix was removed from gene IDs. AAE, acyl‐activating enzyme; ABC, ABC transporter; ACS, acyl‐CoA synthetase; AECH1, acylsugar enoyl‐CoA hydratase 1; ASAT, acylsugar acyltransferase; ASH, acylsugar hydrolase and the related carboxylesterase Sopen04g001210; ASFF1, acylsucrose fructofuranosidase 1; BCAA, branched‐chain amino acid; BCFA, branched‐chain fatty acid; CCM, central carbon metabolism; FAS, fatty acid synthase components. Genes encoding ISOPROPYLMALATE SYNTHASE (IPMS) are underlined. Highlighted genes show statistically significant differences in expression between control and VIGS plants (false discovery rate < 0.05). Two genes (Sopen08g005150 and Sopen12g021250; marked with an asterisk) had low expression levels and were removed before differential gene expression analysis. Individual gene annotation and related information are given in Supporting Information Dataset S1. (b) Weighted gene correlation network analysis (WGCNA). ‘Sopen’ prefix was removed from gene IDs. Nodes and edges represent genes and intramodular connectivities, respectively. Genes that are strongly co‐expressed (based on intramodular connectivities > 0.15) with SpLFS are shown. Annotations for known acylsugar metabolic genes are indicated. Red diamonds indicate flavonoid metabolic genes. Please note that the heatmap scales in Fig. 3a may not be properly displayed on some Macintosh (Apple) systems.
Fig. 4
Fig. 4
Phylogenetic analysis of SpLFS. (a) A maximum‐likelihood‐based phylogenetic tree (topology) of SpLFS (highlighted in yellow) and related sequences in the Solanaceae. Three non‐solanaceous species are also included (Ipnil, Ipomoea nil; Iptri, Ipomoea triloba; (Convolvulaceae; XP numbers indicate NCBI accessions); Cc, Coffea canephora (Rubiaceae)). Bootstrap support values from 1000 replicates are shown. Members with available trichome‐enriched expression data (Ning et al. (2015) for S. lycopersicum and Moghe et al. (2017) for S. nigrum, S. quitoense, Hyoscyamus niger, and Salpiglossis sinuata) are marked with green triangles (Tri252x indicates 252‐fold higher expression in isolated trichomes compared to underlying tissues). Homologs from Nicotiana tabacum and its two parents (N. sylvestris and N. tomentosiformis) are marked with blue diamonds. Two N. benthamiana sequences that were targeted for virus‐induced gene silencing (VIGS) are marked with black circles. CA, Capsicum annuum; HN, Hyoscyamus niger; NIAT, Nicotiana attenuata; Niben, N. benthamiana; Nitab, N. tabacum; Nisyl, N. sylvestris; Nitom, N. tomentosiformis; Peaxi, Petunia axillaris; Sopen, Solanum pennellii; Solyc, S. lycopersicum; Sopim, S. pimpinellifolium; SOLCI, S. chilense; Soper, S. peruvianum; Sotub, S. tuberosum; SMEL, S. melongena; SN, S. nigrum; SQ, S. quitoense; SS, Salpiglossis sinuata. (b) Results of VIGS in Nicotiana benthamiana. S and G indicate sucrose and glucose, respectively. Numbers followed by S or G indicate the number of acyl chains and combined chain lengths, respectively; numbers within parentheses indicate individual acyl chain lengths; for example, S3: 17 (2,7,8) indicates acylsucrose with three acyl chains and a combined chain length of C17 (C2, C7, and C8). Combined amounts of major acylsugars in control and VIGS plants are shown next to individual acylsugar bar graphs. Error bars indicate SE (n = 11 individual plants; ns, P > 0.05; *, P < 0.05; **, P < 0.01; ***, P < 0.001; ****, P < 0.0001; Welch t‐test). (c) Segment of a maximum‐likelihood‐based phylogenetic tree (topology) of SpLFS and other specialized metabolic AP2/ERF members (indicated by red circles). The complete tree is given in Supporting Information Fig. S7. Some sequences were clustered to save space; numbers within parentheses indicate the number of sequences in each cluster (indicated by asterisks). Arrows indicate auxin‐inducible members. Green triangles indicate jasmonate‐inducible members. Aa, Artemisia annua; Cr, Catharanthus roseus; Nb, N. benthamiana; Nt, N. tabacum. GenBank accession numbers are given next to sequences, wherever applicable.
Fig. 5
Fig. 5
Comparing SlLFS with SpLFS. (a) and (b) Histograms showing the distribution of trichome‐enriched expression (stem trichomes vs shaved stems) of genes that were downregulated (a) or upregulated (b) in leafless mutants' shoot apices compared to wild‐type Solanum lycopersicum shoot apices. Positive and negative log2(fold‐change) values indicate higher and lower expression, respectively, in stem trichomes compared to shaved stems. (c) Relative expression of SpLFS in different tissues of S. pennellii, as measured by RT‐qPCR. Expression in the leaf was set to 100%. Expression was detected in seedlings and predominantly in trichome‐containing aerial tissues. Error bars indicate SD (n = 3 individual plants). (d) Green fluorescent protein (GFP) fluorescence driven by the SpLFS promoter is mostly detected in apical cells of digitate glandular trichomes (type I/IV) in stably transformed S. pennellii. The image is an overlay of GFP fluorescence (green), Chl autofluorescence (red), and bright field. The arrow indicates a peltate glandular trichome (type VI/VII). Bar, 50 μm. (e) Individual channels that were used to make the image in panel (d) are shown separately.
Fig. 6
Fig. 6
Sequence‐specific binding of SpLFS to target DNA. (a) Consensus sequence of the APETALA 2 (AP2) domain from SpLFS and 29 homologs in different species of the Solanaceae (listed in Fig. 4a). DNA base‐contacting amino acids of Arabidopsis thaliana ERF1 (AtERF1) (Allen et al., 1998) are indicated with asterisks. (b) SpLFS binds to the GCC box, but not to the DRE box. All nucleotides of either the GCC box or the DRE box were mutated to an A nucleotide (underlined). (c) SpLFS binds to promoters of acylsugar and flavonoid metabolic genes. Epstein–Barr nuclear antigen (EBNA) target DNA from the electrophoretic mobility shift assay kit (Thermo Fisher Scientific) was used as a negative control. The 60‐bp biotin‐labeled EBNA DNA (5′‐GTACCCGGGGATCCTATCTGGGTAGCATATGCTATCCTAATGGATCCTCTAGAGTCGACC‐3′) was incubated with the purified recombinant protein. (d) GCC box and flanking nucleotides from promoters of known and candidate acylsugar and flavonoid metabolic genes (Supporting Information Table S2). (e) Binding of SpLFS to promoters of three additional acylsugar biosynthetic genes.

Similar articles

References

    1. Allen MD, Yamasaki K, Ohme‐Takagi M, Tateno M, Suzuki M. 1998. A novel mode of DNA recognition by a beta‐sheet revealed by the solution structure of the GCC‐box binding domain in complex with DNA. EMBO Journal 17: 5484–5496. - PMC - PubMed
    1. Balestrini R, Rosso LC, Veronico P, Melillo MT, De Luca F, Fanelli E, Colagiero M, di Fossalunga AS, Ciancio A, Pentimone I. 2019. Transcriptomic responses to water deficit and nematode infection in mycorrhizal tomato roots. Frontiers in Microbiology 10: 1807. - PMC - PubMed
    1. Benjamini Y, Hochberg Y. 1995. Controlling the false discovery rate: a practical and powerful approach to multiple testing. Journal of the Royal Statistical Society. Series B: Statistical Methodology 57: 289–300.
    1. Blauth SL, Churchill GA, Mutschler MA. 1998. Identification of quantitative trait loci associated with acylsugar accumulation using intraspecific populations of the wild tomato, Lycopersicon pennellii. Theoretical and Applied Genetics 96: 458–467. - PubMed
    1. Bolger A, Scossa F, Bolger ME, Lanz C, Maumus F, Tohge T, Quesneville H, Alseekh S, Sorensen I, Lichtenstein G et al. 2014. The genome of the stress‐tolerant wild tomato species Solanum pennellii . Nature Genetics 46: 1034–1038. - PMC - PubMed

LinkOut - more resources