Progress and future directions of biogeographical comparisons of plant-fungal interactions in invasion contexts
- PMID: 40400222
- PMCID: PMC12177278
- DOI: 10.1111/nph.70228
Progress and future directions of biogeographical comparisons of plant-fungal interactions in invasion contexts
Abstract
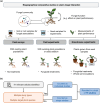
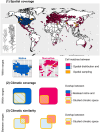
Plant invasions are biogeographical phenomena that may involve shifts in belowground plant-fungal interactions, such as the release from fungal pathogens or more beneficial interactions with mutualists in nonnative ranges. However, native and nonnative ranges are not uniform but environmentally heterogeneous, and plant-fungal interactions are strongly shaped by spatio-environmental context. Intense discussion at the 45th New Phytologist Symposium revealed that we lack information on how well spatio-environmental variation within ranges has been considered in samplings and analyses of studies comparing plant-fungal interactions between ranges. Through a systematic review, we assessed the sampling quality of recent biogeographical studies. We found that the majority relied on a limited population sampling within each range, often covering only a small fraction of the species' spatial distribution and macroclimatic niche. Additionally, low similarity between the sampled climatic gradients in the native and nonnative ranges might have introduced false-positive differences across ranges. These sampling deficiencies may undermine the robustness and representativeness of range comparisons, thereby restricting our ability to accurately assess the role of plant-fungal interactions in invasion success. We recommend that future research incorporate broader and more comparable spatio-environmental variation in both ranges, and we provide practical guidelines for improving sampling designs.
Keywords: ecological sampling design; environmental heterogeneity; native vs nonnative range comparisons; plant invasion; plant–fungal interactions; sampling bias; sampling quality; spatio‐environmental variation.
© 2025 The Author(s). New Phytologist © 2025 New Phytologist Foundation.
Conflict of interest statement
None declared.
Figures


Similar articles
-
Maternal and neonatal outcomes of elective induction of labor.Evid Rep Technol Assess (Full Rep). 2009 Mar;(176):1-257. Evid Rep Technol Assess (Full Rep). 2009. PMID: 19408970 Free PMC article.
-
Drugs for preventing postoperative nausea and vomiting in adults after general anaesthesia: a network meta-analysis.Cochrane Database Syst Rev. 2020 Oct 19;10(10):CD012859. doi: 10.1002/14651858.CD012859.pub2. Cochrane Database Syst Rev. 2020. PMID: 33075160 Free PMC article.
-
Systemic pharmacological treatments for chronic plaque psoriasis: a network meta-analysis.Cochrane Database Syst Rev. 2021 Apr 19;4(4):CD011535. doi: 10.1002/14651858.CD011535.pub4. Cochrane Database Syst Rev. 2021. Update in: Cochrane Database Syst Rev. 2022 May 23;5:CD011535. doi: 10.1002/14651858.CD011535.pub5. PMID: 33871055 Free PMC article. Updated.
-
Factors that influence parents' and informal caregivers' views and practices regarding routine childhood vaccination: a qualitative evidence synthesis.Cochrane Database Syst Rev. 2021 Oct 27;10(10):CD013265. doi: 10.1002/14651858.CD013265.pub2. Cochrane Database Syst Rev. 2021. PMID: 34706066 Free PMC article.
-
Measures implemented in the school setting to contain the COVID-19 pandemic.Cochrane Database Syst Rev. 2022 Jan 17;1(1):CD015029. doi: 10.1002/14651858.CD015029. Cochrane Database Syst Rev. 2022. Update in: Cochrane Database Syst Rev. 2024 May 2;5:CD015029. doi: 10.1002/14651858.CD015029.pub2. PMID: 35037252 Free PMC article. Updated.
References
-
- Allen WJ, Sapsford SJ, Dickie IA. 2021. Soil sample pooling generates no consistent inference bias: a meta‐analysis of 71 plant–soil feedback experiments. New Phytologist 231: 1308–1315. - PubMed
-
- Atwater DZ, Ervine C, Barney JN. 2018. Climatic niche shifts are common in introduced plants. Nature Ecology & Evolution 2: 34–43. - PubMed
-
- Bennett AE, Groten K. 2022. The costs and benefits of plant‐arbuscular mycorrhizal fungal interactions. Annual Review of Plant Biology 73: 649–672. - PubMed
-
- Bossdorf O, Auge H, Lafuma L, Rogers WE, Siemann E, Prati D. 2005. Phenotypic and genetic differentiation between native and introduced plant populations. Oecologia 144: 1–11. - PubMed
-
- Cahill JF, Cale JA, Karst J, Bao T, Pec GJ, Erbilgin N. 2017. No silver bullet: different soil handling techniques are useful for different research questions, exhibit differential type I and II error rates, and are sensitive to sampling intensity. New Phytologist 216: 11–14. - PubMed
Publication types
MeSH terms
LinkOut - more resources
Full Text Sources
Medical

