

Inhibition of tau aggregation by the CCT3 and CCT7 apical domains
- PMID: 40400346
- PMCID: PMC12095920
- DOI: 10.1002/pro.70162
Inhibition of tau aggregation by the CCT3 and CCT7 apical domains
Abstract
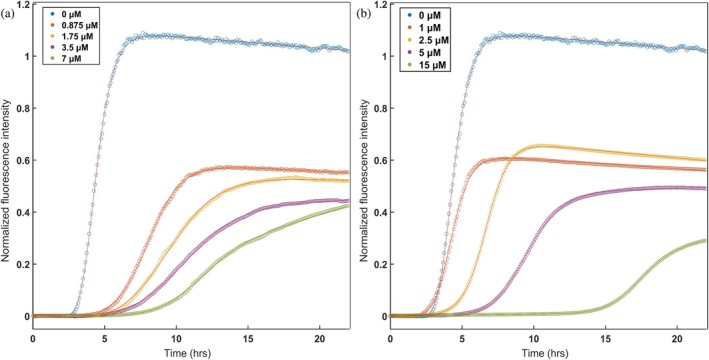
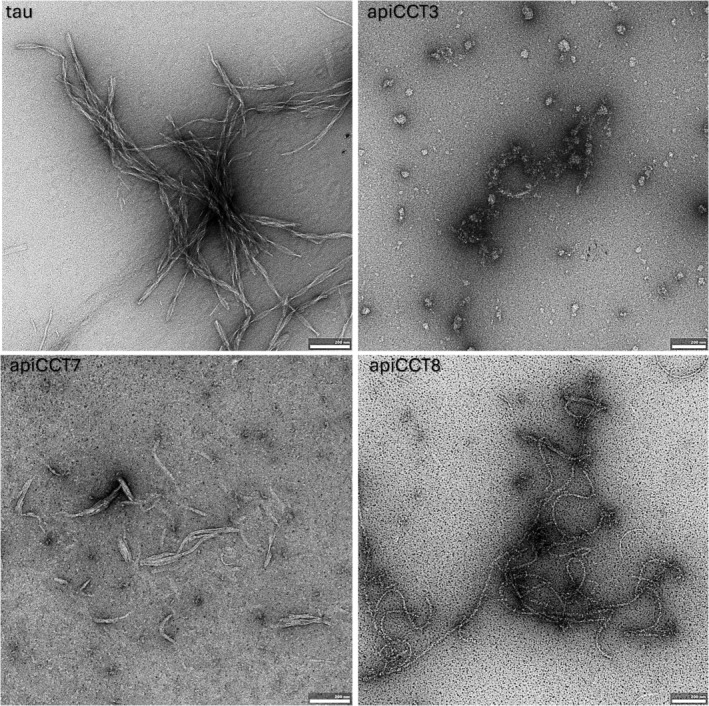
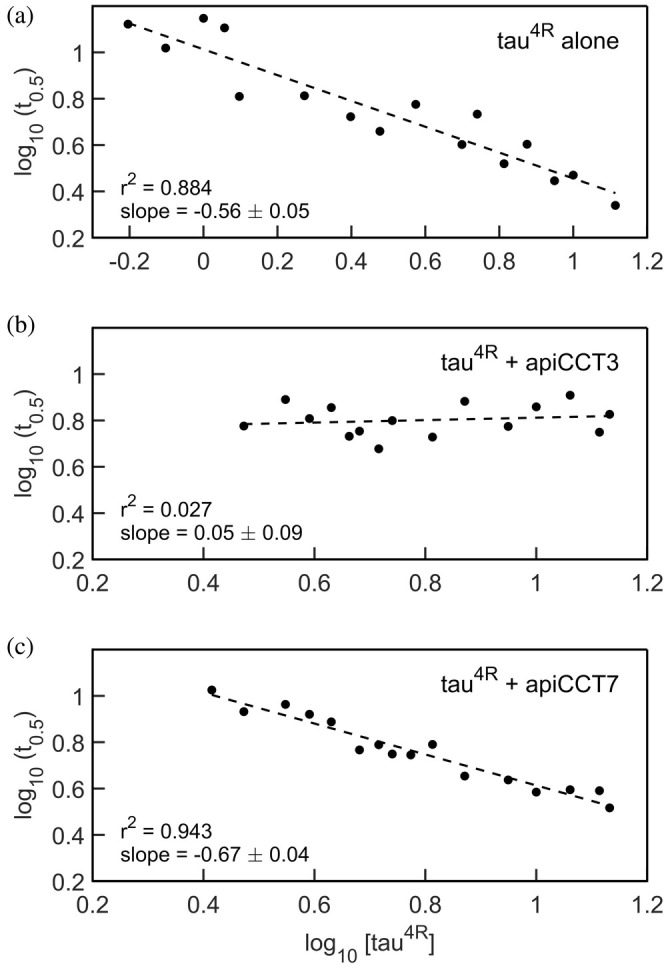
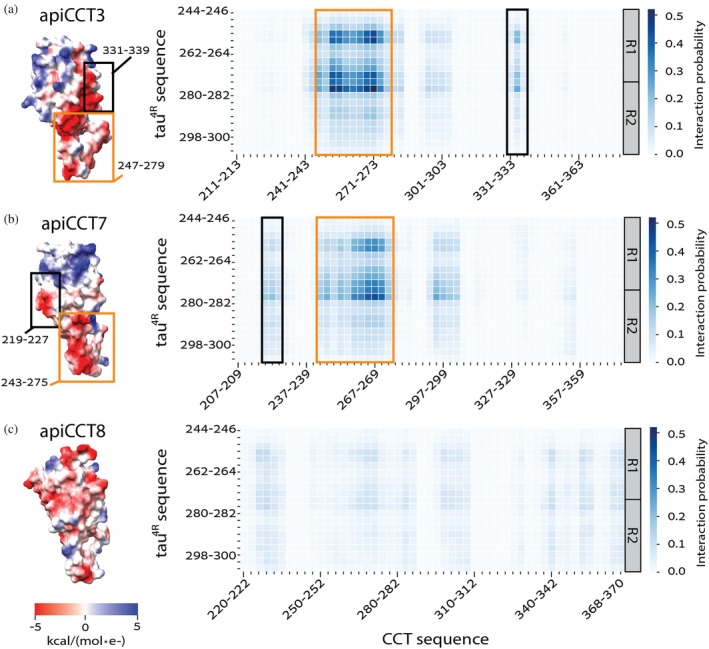
The eukaryotic chaperonin containing t-complex polypeptide 1 (CCT/TRiC) is a molecular chaperone that assists protein folding in an ATP-driven manner. It consists of two stacked identical rings that are each made up of eight distinct subunits. Here, we show that the apical domains of subunits CCT3 and CCT7 from humans are strong inhibitors of tau aggregation, which is associated with several neurological disorders such as Alzheimer's and Parkinson's diseases. Kinetic analyses and negative-stain electron microscopy indicate that the mechanism of inhibition of tau aggregation by the apical domains of subunits CCT3 and CCT7 differ. Aggregation of tau alone, or in the presence of the apical domain of subunit CCT7, can be described by a fragmentation model whereas in the presence of the apical domain of subunit CCT3, it fits a saturating elongation and fragmentation mechanism. Coarse-grained molecular dynamics simulations show that tau interacts with different regions in the apical domains of subunits CCT3 and CCT7, in agreement with their different inhibition mechanisms.
Keywords: Alzheimer's disease; CCT/TRiC; chaperonins; protein aggregation; tau.
© 2025 The Author(s). Protein Science published by Wiley Periodicals LLC on behalf of The Protein Society.
Figures
Similar articles
-
Interactions of subunit CCT3 in the yeast chaperonin CCT/TRiC with Q/N-rich proteins revealed by high-throughput microscopy analysis.Proc Natl Acad Sci U S A. 2012 Nov 13;109(46):18833-8. doi: 10.1073/pnas.1209277109. Epub 2012 Oct 29. Proc Natl Acad Sci U S A. 2012. PMID: 23112166 Free PMC article.
-
TRiC/CCT Chaperonin: Structure and Function.Subcell Biochem. 2019;93:625-654. doi: 10.1007/978-3-030-28151-9_19. Subcell Biochem. 2019. PMID: 31939165 Review.
-
A hierarchical assembly pathway directs the unique subunit arrangement of TRiC/CCT.Mol Cell. 2023 Sep 7;83(17):3123-3139.e8. doi: 10.1016/j.molcel.2023.07.031. Epub 2023 Aug 24. Mol Cell. 2023. PMID: 37625406 Free PMC article.
-
Human CCT4 and CCT5 chaperonin subunits expressed in Escherichia coli form biologically active homo-oligomers.J Biol Chem. 2013 Jun 14;288(24):17734-44. doi: 10.1074/jbc.M112.443929. Epub 2013 Apr 23. J Biol Chem. 2013. PMID: 23612981 Free PMC article.
-
Mechanistic insights into protein folding by the eukaryotic chaperonin complex CCT.Biochem Soc Trans. 2022 Oct 31;50(5):1403-1414. doi: 10.1042/BST20220591. Biochem Soc Trans. 2022. PMID: 36196890 Free PMC article. Review.
Cited by
-
Ubiquitin-Proteasome System Dysregulation in Alzheimer's Disease Impacts Protein Abundance.bioRxiv [Preprint]. 2025 May 29:2025.05.29.656728. doi: 10.1101/2025.05.29.656728. bioRxiv. 2025. PMID: 40501941 Free PMC article. Preprint.
-
Role of the chaperonin TCP-1 ring complex in protein aggregation and neurodegeneration.Front Mol Neurosci. 2025 Jul 7;18:1617771. doi: 10.3389/fnmol.2025.1617771. eCollection 2025. Front Mol Neurosci. 2025. PMID: 40693240 Free PMC article. Review.
References
-
- Azia A, Levy Y. Nonnative electrostatic interactions can modulate protein folding: molecular dynamics with a grain of salt. J Mol Biol. 2009;393:527–542. - PubMed
-
- Balchin D, Hayer‐Hartl M, Hartl FU. In vivo aspects of protein folding and quality control. Science. 2016;353:aac4354. - PubMed
-
- Barghorn S, Davies P, Mandelkow E. Tau paired helical filaments from Alzheimer's disease brain and assembled in vitro are based on β‐structure in the core domain. Biochemistry. 2004;43:1694–1703. - PubMed
MeSH terms
Substances
Grants and funding
LinkOut - more resources
Full Text Sources
Miscellaneous
