. 2025 Oct 1;110(10):2422-2435.
doi: 10.3324/haematol.2025.287526. Epub 2025 May 22.

Mitochondrial fission factor drives an actionable metabolic vulnerability in multiple myeloma

Affiliations

Mitochondrial fission factor drives an actionable metabolic vulnerability in multiple myeloma

Maria Eugenia Gallo Cantafio et al. Haematologica. .

Abstract

Proliferating multiple myeloma (MM) cells in the bone marrow fluctuate across various metabolic states to resist cancer treatments. Herein, we investigate how mitochondrial dynamics, which control mitochondrial fitness via coordinated fission and fusion events, shape MM cell metabolism impacting growth, survival and drug sensitivity. We identify mitochondrial fission factor (MFF), a pivotal driver of mitochondrial fragmentation, as being highly expressed in MM plasma cells bearing cytogenetic abnormalities predicting poor clinical outcome. In preclinical models, selective inhibition of MFF via multiple RNA-based strategies (short-hairpin RNA, short-interfering RNA or LNA gapmeR antisense oligonucleotides) reduces MM cell growth both in vitro and in vivo, enabling adaptive metabolic responses consistent with the induction of glycolysis and the inhibition of lactate-mediated oxidative phosphorylation. We also demonstrate that lactate supplementation, as well as clinically relevant drugs promoting lactate accumulation, such as AZD3965 and syrosingopine, trigger MFF-dependent metabolic changes, enhancing the sensitivity of MM cells to strategies targeting mitochondrial fission. Finally, we highlight a novel lactate-MFF axis involved in resistance to proteasome inhibitors, and show that combining AZD3965 or syrosingopine with bortezomib results in synergistic anti-MM activity along with MFF downregulation. Collectively, these data point to MFF-dependent mitochondrial fragmentation as a key metabolic hallmark of MM, providing a framework for the development of novel therapeutic strategies targeting mitochondrial dynamics and harnessing the metabolic plasticity of malignant plasma cells.


Figures

Figure 1.
Figure 1.
Mitochondrial fission factor is highly expressed and drives mitochondrial fragmentation in multiple myeloma. (A) Box plots of mitochondrial fission factor (MFF) expression level in 660 cases of multiple myeloma (MM) in the CoMMpass dataset stratified according to the presence of molecular lesions. Differential expression was tested by the Wilcoxon rank-sum test with continuity correction. (B) Immunohistochemical analysis of MFF expression in MM and normal bone tissue cores from a tissue microarray (TMA) slide; representative images (10x and 40x magnification) are shown. The TMA score was calculated as the average of MFF intensity values across all tissue samples on the TMA slide. (C) Western blot analysis of Drp1 and MFF proteins in whole-cell lysates (Input) and anti-Drp1 immunoprecipitation products derived from AMO or AMO-BZB cells. (D) Transmission electron microscopy (TEM) analysis of mitochondrial structure and morphology in AMO-BZB cells stably silenced for MFF (shMFF); a scrambled control vector was used as a control (SCR). Representative TEM images are shown (12,000x magnification). Mitochondrial length is reported as the average of acquisitions from different samples across various tissue specimens. The western blot shows MFF protein in shMFF and SCR AMO-BZB cells; GAPDH was used as a loading control. HD: hyperdiploid; WT: wildtype; MUT: mutated; N: normal bone tissue; IP: immunoprecipitation; AMO: parental cell line; AMO-BZB: bortezomib-resistant cell line.
Figure 2.
Figure 2.
Mitochondrial fission factor targeting induces anti-multiple myeloma effects in vitro and in vivo. (A-C) Automated cell count performed in AMO-BZB cells, 48 h after electroporation with (A) g_05, g_06 or g_NC negative control gapmeR, (B) short-interfering RNA (siRNA) targeting mitochondrial fission factor (MFF), or (C) after lentiviral transduction with an MFF-targeting short hairpin RNA (shRNA). Western blot analysis of MFF in AMO-BZB cells, 48 h after electroporation with gapmeR, siRNA, or lentiviral transduction, is reported; GAPDH was used as a loading control. *P<0.05. (D) Colony formation assay performed on AMO-BZB cells stably silenced for MFF (shMFF), 10 days after seeding; a scrambled (SCR) vector was used as control. Histogram bars reported the mean ± standard deviation (SD) of three independent experiments. Representative images of colonies at day 10 are reported. *P<0.05. (E) Cell-cycle analysis of AMO-BZB cells, 48 h after electroporation with g_06 or g_NC; histogram bars represent the percentage of cells in each cell cycle phase. (F) Flow cytometry analysis of AMO-BZB cells stained with annexin V/7-ami noactinomycin D, 48 h after electroporation with g_06 or g_NC; histogram bars represent the mean from three independent biological replicates. *P<0.05. (G) In vivo tumor growth evaluation of shMFF AMO-BZB xenografts in NOD.SCID mice; SCR was used as the control. Average ± SD of the tumor volume for each group is shown; *P<0.05. (H) Kaplan-Meier curves relative to shMFF and SCR AMO-BZB xenografts (log-rank test, **P=0.0045). Survival was evaluated from the first day of palpable tumor until death or sacrifice; the percentage of mice alive is shown. (I) Western blot analysis of MFF expression in SCR and shMFF AMO-BZB xenografts retrieved from mice; GAPDH was used as the loading control. (J) Immunohistochemical analysis (20x magnification) of Ki-67 expression in shMFF and SCR AMO-BZB xenografts retrieved from mice; representative images are shown.
Figure 3.
Figure 3.
Mitochondrial fission factor targeting prompts a shift towards glycolytic metabolism. (A) Venn diagrams illustrating the number of differentially expressed genes that overlap (top), or have opposite expression (bottom) between AMO-BZB cells stably silenced for MFF (shMFF) and H929 cells overexpressing MFF (OE MFF). (B) Gene set enrichment analysis indicating the top five hallmark gene sets with opposite patterns enriched between H929 OE MFF (left side) and shMFF AMO-BZB cells (right side). The normalized enrichment score is indicated on the y-axis. (C) Quantitative reverse transcriptase polymerase chain reaction analysis of ALDOC, ENO2, HK2, PDK4, and SLC2A1 mRNA expression levels in shMFF AMO-BZB and H929 OE MFF cells. The results show the average mRNA expression levels after normalization with β-actin and ∆∆Ct calculations and are expressed as percentage ± standard deviation normalized to each respective control. **P<0.01. FDR: false discovery rate; NES: normalized expression score; ALDOC: aldolase C; ENO2: enolase 2; HK2: hexokinase 2; PDK4: pyruvate dehydrogenase kinase 4; SLC2A1: solute carrier family 2A1.
Figure 4.
Figure 4.
Lactate accumulation drives mitochondrial fission factor-dependent metabolic reprogramming in multiple myeloma cells. (A, B) Real-time oxygen consumption rate (OCR) measured via OROBOROS on (A) H929 cells overexpressing mitochondrial fission factor (OE MFF) or (B) AMO-BZB cells stably silenced for MFF (shMFF); histogram bars report the average of three independent experiments of multiple key parameters, including basal respiration, spare capacity, maximal respiration, leak state, ATP production, and non-mitochondrial respiration. *P<0.05; **P<0.01. (C) Seahorse analysis of extracellular acidification rate of shMFF AMO-BZB cells; at least six replicates were analyzed in each experiment. Results are the average of independent experiments and are expressed as percentages normalized to the control ± standard error of the mean. *P<0.05. (D) Relative intracellular lactate levels assessed by a Lactate-Glo assay in shMFF AMO-BZB cells. *P<0.05. (E) Western blot analysis of total lactylated proteins in shMFF AMO-BZB or H929 OE MFF cells using an anti-pan-KLA antibody; GAPDH was used as a loading control. (F) Quantitative reverse transcriptase polymerase chain reaction analysis of MCT1 and MCT4 mRNA levels in shMFF AMO-BZB and in H929 OE MFF cells. The results show the average of mRNA expression levels after normalization with GAPDH and ∆∆Ct calculations, and are expressed as percentage ± standard deviation normalized to each control. *P<0.05; **P<0.01. (G) Real-time OCR measurement via OROBOROS, 24 h after lactate supplementation (20 mM) in SCR or shMFF AMO-BZB cells; histogram bars report the average of three independent experiments. *P<0.05. EV: empty vector; SCR: scrambled control; ECAR: extracellular acidification rate.
Figure 5.
Figure 5.
Targeting of mitochondrial fission enhances the in vitro anti-multiple myeloma activity of lactate transporter inhibitors. (A) Western blot analysis of mitochondrial fission factor (MFF) expression, 24 h after lactate supplementation. GAPDH was used as a loading control. Histogram bars represent the densitometric analysis, reported as fold increase relative to the control. *P<0.05. (B) Relative intracellular lactate levels assessed by a Lactate-Glo assay, 24h after treatment with AZD3965 (25 μM) or syrosingopine (5 µM) in AMO cells. *P<0.05; **P<0.01. (C, D) Western blot analysis of MFF expression, 24 h after treatment with AZD3965 (C) or syrosingopine (D); GAPDH was used as a loading control. Histogram bars represent the densitometric analysis, reported as fold change relative to the vehicle. *P<0.05; **P<0.01. (E, F) Cell Titer Glo assay after lactate supplementation (20 mM) in AMO-BZB cells stably silenced for MFF (shMFF) (E) or in AMO-BZB cells electroporated with g_06 or g_NC (F); viable cells are reported as percentage of control. **P<0.01. (G) Cell Titer Glo assay performed in AMO-BZB cells after electroporation with g_06 or g_NC, alone or in combination with AZD3965 (25 μM) or syrosingopine (5 μM); viable cells are reported as percentage of control. *P<0.05. (H, I) Cell Titer Glo assay performed in AMO-BZB cells after treatment with Mdivi-1 alone or in combination with AZD3965 (H) or syrosingopine (I). *P<0.05; **P<0.01. Heat-maps show combination indexes, determined by Calcusyn software, of the combination treatments. (J) Cell Titer Glo assay performed on peripheral blood mononuclear cells from healthy donors (N=3), after treatment with Mdivi-1 (50 μM) alone or in combination with AZD3965 (50 μM) or syrosingopine (5 µM). Viable cells are represented as percentage of vehicle. AZD: AZD3965; Syro: syrosingopine; Lac: lactate; NS: not statistically significant.
Figure 6.
Figure 6.
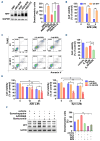
Mitochondrial fission factor triggers resistance to proteasome inhibitors via a lactate-dependent pathway. (A) Western blot analysis of mitochondrial fission factor (MFF) expression in isogenic multiple myeloma (MM) cell lines sensitive to proteasome inhibitors (AMO; H929) and resistant to bortezomib (AMO-BZB, H929-BZB) or carfilzomib (H929-CFZ); GAPDH was used as a loading control. Histogram bars represent the densitometric analysis of the blot, reported as fold increase respect to each parental cell line. **P<0.01. (B) Cell Titer Glo assay performed in H929 cells overexpressing MFF (OE MFF), after treatment with bortezomib; viable cells are reported as percentage of control. **P<0.01. (C) Flow cytometry analysis of H929 OE MFF cells stained with annexin V/7-aminoactinomycin D, 24 h after treatment with bortezomib. Dot plots represent the data from an independent biological replicate (N=3). (D) Cell Titer Glo assay performed in AMO cells electroporated with g_06 or g_NC, and treated with 2.5 nM bortezomib for 24 h. Viable cells are reported as percentage of control. *P<0.05. (E) Cell Titer Glo assay performed in AMO cells, 24 h after treatment with bortezomib alone or in combination with AZD3965 or syrosingopine. Viable cells are reported as percentage of control; red circles indicate synergistic effects of drug combinations (combination index <1). *P<0.05; **P<0.01. (F) Western blot analysis of MFF expression in AMO cells, 24 h after treatment with bortezomib (5 nM), alone or in combination with 25 μM AZD3965 or 5 µM syrosingopine; GAPDH was used as a loading control. Histogram bars represent the blot densitometric analysis, reported as fold increase respect to vehicle. **P<0.01. EV: empty vector; BZB: bortezomib; 7AAD: 7-aminoactinomycin D; AZD: AZD3965; Syro: syrosingopine.

References

    1. Herst PM, Rowe MR, Carson GM, Berridge MV. Functional mitochondria in health and disease. Front Endocrinol (Lausanne). 2017;8:296. - PMC - PubMed
    1. Eisner V, Picard M, Hajnóczky G. Mitochondrial dynamics in adaptive and maladaptive cellular stress responses. Nat Cell Biol. 2018;20(7):755-765. - PMC - PubMed
    1. Alsayyah C, Ozturk O, Cavellini L, Belgareh-Touzé N, Cohen MM. The regulation of mitochondrial homeostasis by the ubiquitin proteasome system. Biochim Biophys Acta. 2020;1861(12):148302. - PubMed
    1. Nair R, Gupta P, Shanmugam M. Mitochondrial metabolic determinants of multiple myeloma growth, survival, and therapy efficacy. Front Oncol. 2022;12:1000106. - PMC - PubMed
    1. Rocca C, Soda T, De Francesco EM, et al. Mitochondrial dysfunction at the crossroad of cardiovascular diseases and cancer. J Transl Med. 2023;21(1):635. - PMC - PubMed

LinkOut - more resources