

Prognostic value of blood urea nitrogen to albumin ratio in septic patients with acute kidney injury-a retrospective study based on MIMIC database
- PMID: 40400629
- PMCID: PMC12092353
- DOI: 10.3389/fmed.2025.1510919
Prognostic value of blood urea nitrogen to albumin ratio in septic patients with acute kidney injury-a retrospective study based on MIMIC database
Abstract
Objective: To investigate the predictive value of blood urea nitrogen to albumin ratio (BAR) in the prognosis of patients with sepsis-induced acute kidney injury (S-AKI).
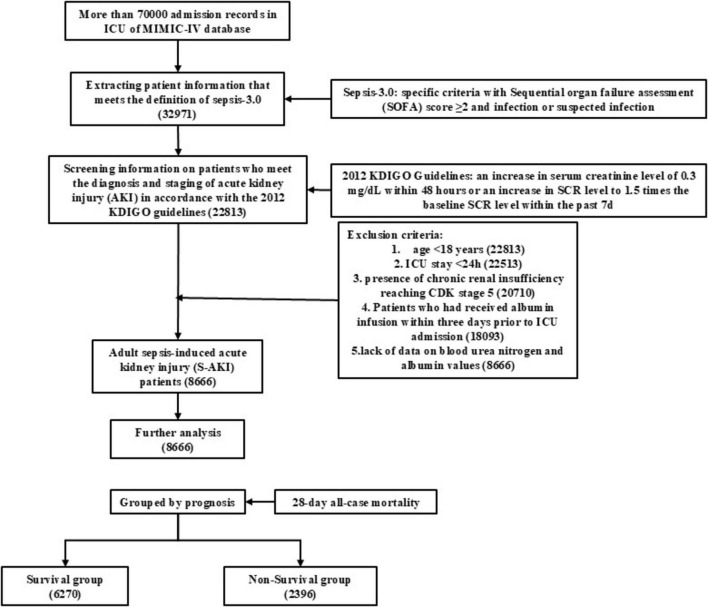
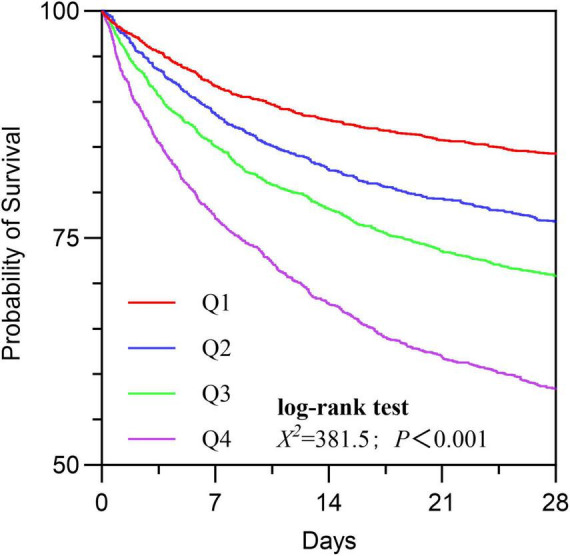
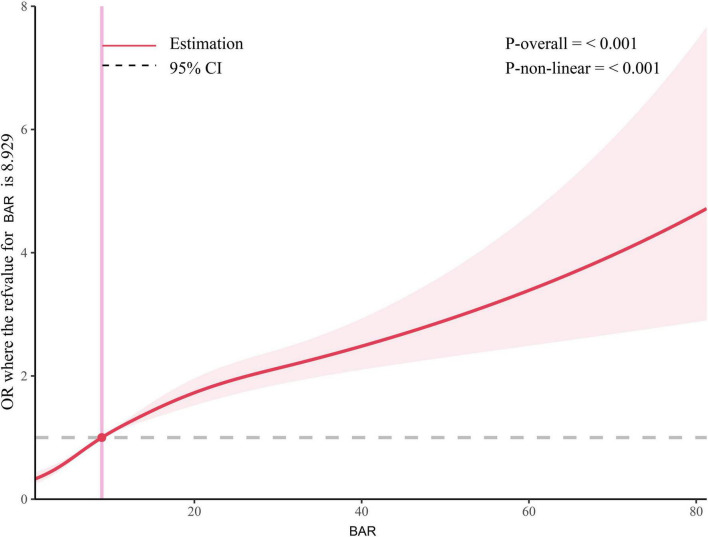
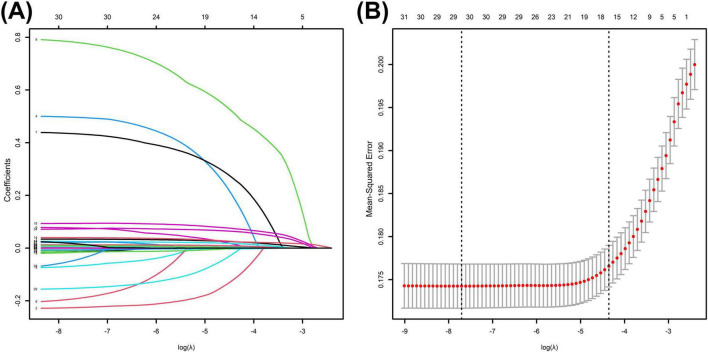
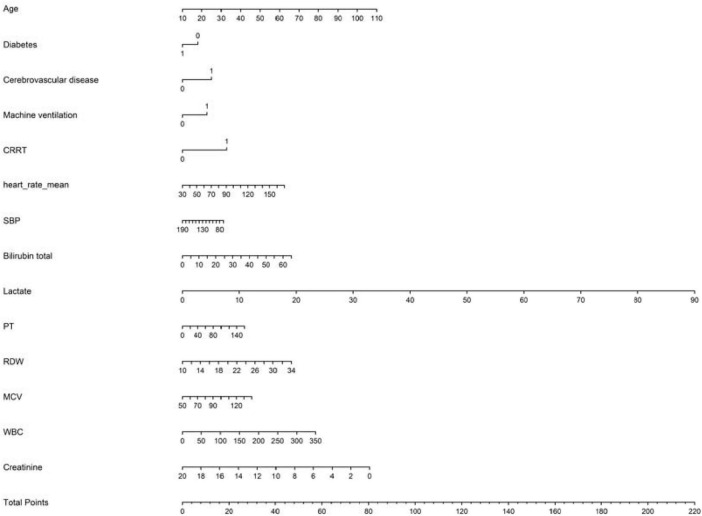
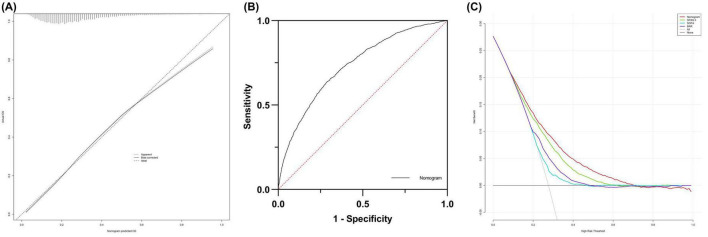
Methods: A retrospective analysis was conducted on patient data from the MIMIC-IV database that met the S-AKI criteria. Cox regression was employed to analyze the relationship between BAR and 28-day mortality risk. BAR was divided into four quartiles (Q1, Q2, Q3, Q4), and Kaplan-Meier survival analysis was performed to compare the 28-day cumulative survival rates among the four patient groups. Simultaneously, the log-rank test was used for statistical analysis of survival rate differences among the four groups. Subsequently, Cox regression was performed with Q1 (the lowest quartile) as the reference for comparison. Restricted cubic splines (RCS) were utilized to analyze the non-linear association between BAR and mortality risk, with the median BAR of all patients serving as the reference point to define the non-linear effect. Thereafter, correlation analysis and subgroup analysis were conducted to assess the stability of BAR in predicting 28-day prognosis. LASSO regression analysis was applied to select variables related to 28-day prognosis, and relevant variables were screened through univariate and multivariate logistic regression analyses to construct a nomogram model. The area under the receiver operating characteristic curve (AUC), calibration plot, and decision curve analysis (DCA) were used to evaluate the predictive performance of the nomogram for in-hospital mortality in S-AKI patients.
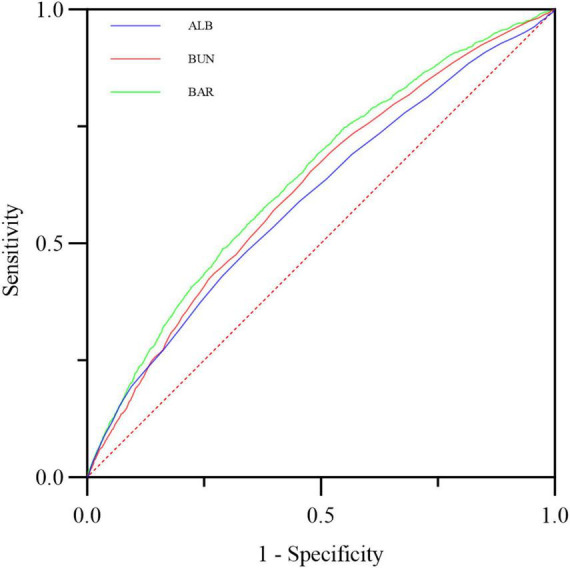
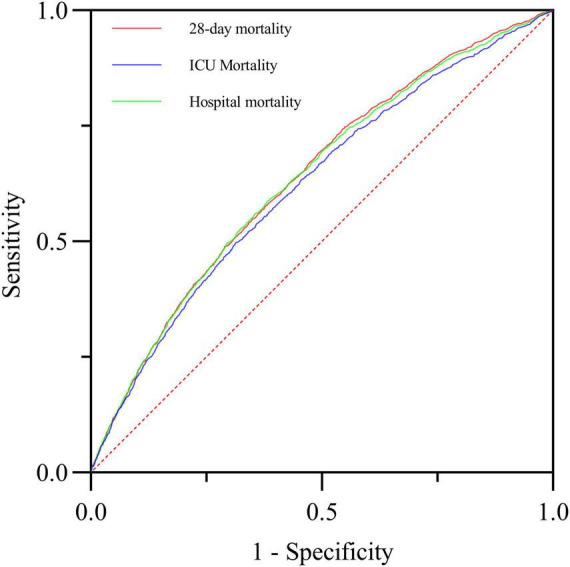
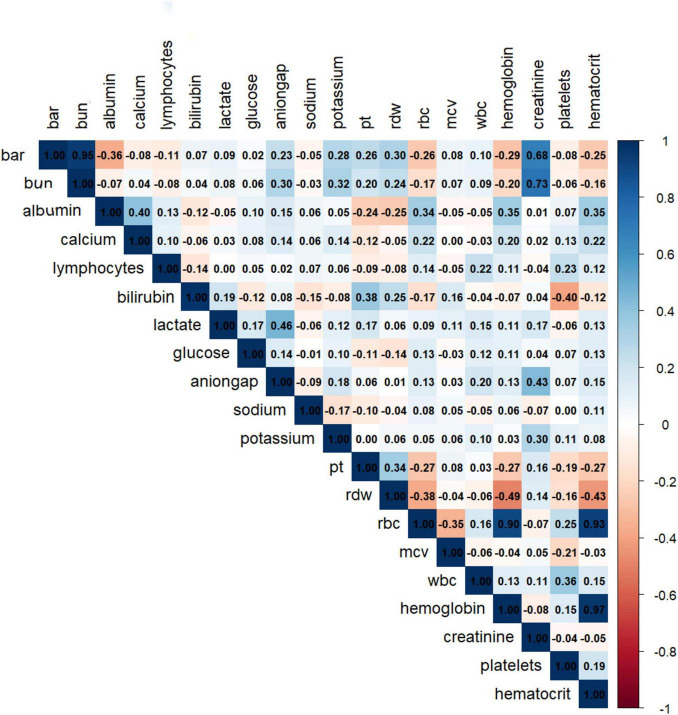
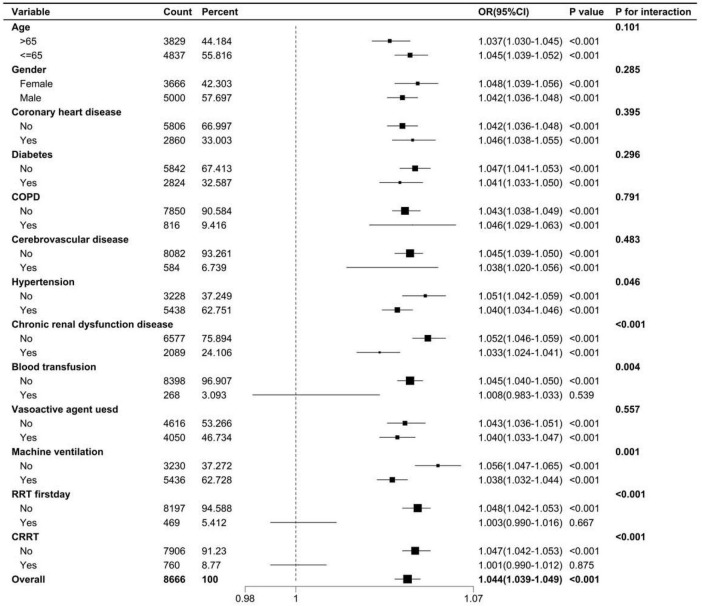
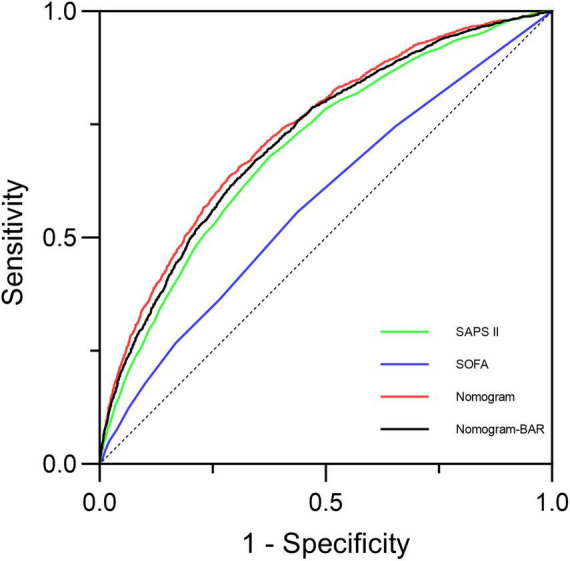
Results: A total of 8,666 patients with S-AKI were included, among whom 2,396 died (27.65%). Cox analysis of BAR indicated a positive correlation between BAR and 28-day mortality risk, with an HR of 1.029 (95% CI: 1.026-1.032). Kaplan-Meier curves showed that the 28-day cumulative survival rate was significantly lower in the Q4 group compared to the Q1 group of S-AKI patients (log-rank test, χ2 = 381.5, p < 0.001). Subsequently, Cox regression with Q1 as the reference revealed that the risk of death gradually increased with ascending BAR quartiles (Q4 vs. Q1: HR = 0.639, 95% CI: 0.579-0.705, P < 0.001). Correlation analysis suggested no significant correlation between BAR and other biological indicators. Additionally, subgroup analysis confirmed the stability of the results. The ROC curve demonstrated that BAR had diagnostic advantages over single indicators such as blood urea nitrogen or albumin (p < 0.001; p < 0.001). A nomogram incorporating multiple factors including BAR was constructed, which outperformed SOFA and SAPS II in predicting in-hospital mortality for S-AKI, demonstrating good discrimination and calibration capabilities.
Conclusion: BAR, as a simple and convenient biomarker, can effectively predict in-hospital mortality in patients with S-AKI, with its elevation positively correlated with an increased risk of death. The rise in BAR is positively associated with an increased 28-day mortality risk in S-AKI patients, and a higher absolute value of BAR indicates a poorer prognosis for S-AKI patients. The nomogram incorporating BAR demonstrates excellent performance in prediction.
Keywords: blood urea nitrogen to albumin ratio; mortality rate; nomogram; sepsis; sepsis-induced acute kidney injury.
Copyright © 2025 Han, Tao, Wang and Lu.
Conflict of interest statement
The authors declare that the research was conducted in the absence of any commercial or financial relationships that could be construed as a potential conflict of interest.
Figures
Similar articles
-
Blood urea nitrogen to serum albumin ratio is associated with all-cause mortality in patients with AKI: a cohort study.Front Nutr. 2024 Feb 20;11:1353956. doi: 10.3389/fnut.2024.1353956. eCollection 2024. Front Nutr. 2024. PMID: 38445205 Free PMC article.
-
[Development and validation of a prognostic model for patients with sepsis in intensive care unit].Zhonghua Wei Zhong Bing Ji Jiu Yi Xue. 2023 Aug;35(8):800-806. doi: 10.3760/cma.j.cn121430-20230103-00003. Zhonghua Wei Zhong Bing Ji Jiu Yi Xue. 2023. PMID: 37593856 Chinese.
-
[Development and validation of a nomogram for predicting 3-month mortality risk in patients with sepsis-associated acute kidney injury].Zhonghua Wei Zhong Bing Ji Jiu Yi Xue. 2024 May;36(5):465-470. doi: 10.3760/cma.j.cn121430-20231218-01091. Zhonghua Wei Zhong Bing Ji Jiu Yi Xue. 2024. PMID: 38845491 Chinese.
-
[Construction of a predictive model of death for sepsis-associated acute kidney injury].Zhonghua Wei Zhong Bing Ji Jiu Yi Xue. 2024 Apr;36(4):381-386. doi: 10.3760/cma.j.cn121430-20240130-00098. Zhonghua Wei Zhong Bing Ji Jiu Yi Xue. 2024. PMID: 38813632 Chinese.
-
Preexisting statin therapy is not associated with reduced acute kidney injury following cardiac surgery: a retrospective analysis.Front Pharmacol. 2025 May 30;16:1613681. doi: 10.3389/fphar.2025.1613681. eCollection 2025. Front Pharmacol. 2025. PMID: 40520192 Free PMC article. Review.
References
-
- Gong S, Xiong H, Lei Y, Huang S, Ouyang Y, Cao C, et al. Usp9x contributes to the development of sepsis-induced acute kidney injury by promoting inflammation and apoptosis in renal tubular epithelial cells via activation of the TLR4/nf-κb pathway. Ren Fail. (2024) 46:2361089. 10.1080/0886022X.2024.2361089 - DOI - PMC - PubMed
LinkOut - more resources
Full Text Sources
Miscellaneous