. 2025 May 22;10(10):e186335.
doi: 10.1172/jci.insight.186335.

Fetoplacental extracellular vesicles deliver conceptus-derived antigens to maternal secondary lymphoid tissues for immune recognition

Affiliations

Fetoplacental extracellular vesicles deliver conceptus-derived antigens to maternal secondary lymphoid tissues for immune recognition

Juliana S Powell et al. JCI Insight. .

Abstract

Pregnancy is an immunological paradox where despite a competent maternal immune system, regulatory mechanisms at the fetoplacental interface and maternal secondary lymphoid tissues (SLTs) circumvent rejection of semi-allogeneic concepti. Small extracellular vesicles (sEVs) are a vehicle for intercellular communication; nevertheless, the role of fetoplacental sEVs in transport of antigens to maternal SLTs has not been conclusively demonstrated. Using mice in which the conceptus generates fluoroprobe-tagged sEVs shed by the plasma membrane or released from the endocytic compartment, we show that fetoplacental sEVs are delivered to immune cells in the maternal spleen. Injection of sEVs from placentas of females impregnated with Act-mOVA B6 males elicited suboptimal activation of OVA-specific CD8+ OT-I T cells in virgin females as occurs during pregnancy. Furthermore, when OVA+ concepti were deficient in Rab27a, a protein required for sEV secretion, OT-I cell proliferation in the maternal spleen was decreased. Proteomics analysis revealed that mouse trophoblast sEVs were enriched in antiinflammatory and immunosuppressive mediators. Translational relevance was tested in humanized mice injected using sEVs from cultures of human trophoblasts. Our findings show that sEVs deliver fetoplacental antigens to the mother's SLTs that are recognized by maternal T cells. Alterations of such a mechanism may lead to pregnancy disorders.

Keywords: Antigen; Immunology; Mouse models; Reproductive biology; T cells.


Conflict of interest statement

Conflict of interest: YS is a consultant to Bio-Rad Laboratories, Inc.

Figures

Figure 1
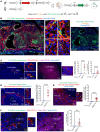
Figure 1. Fetoplacental CD81 sEVs traffic to the maternal spleen.
(A) Diagram of tdTomatoLSL CD81-mNeonGreen (Exomap1) B6 male × CMVCre/+ B6 female pregnancy model. In the presence of Cre, LoxP recombination removes cytoplasmic (Cyto) tdTomato polyA, leading to downstream transcription of CD81-mNeonGreen. CD81-mNeonGreen protein is sorted in fetoplacental sEVs. (B) CD81-mNeonGreen on sections of placentas of CMVCre/+ B6 females impregnated by Exomap1 B6 males. Region of interest (ROI) showing CD81-mNeonGreen+ EVs shed from trophoblast cells (arrows) and CD81-mNeonGreen content in trophoblast cell invaginations (arrowheads). Representative of 6–12 placentas from 4 mothers. Original magnification, ×200. TG, trophoblast giant. (CF) Detection by microscopy of CD81-mNeonGreen in FDCs (C), B cells (C), MZ macrophages (D), red pulp macrophages (E), and cDCs (F), in spleens of CMVCre/+ B6 females impregnated with Exomap1 B6 males and analyzed on E17.5. Original magnification, ×200, ×400. Dot plots in CF, quantification on spleen cryosections of FDCs, B cells, MZ macrophages, red pulp macrophages, and cDCs with CD81-mNeonGreen. Images representative of multiple sections from spleens of 4 pregnant females. In CF, comparisons by 2-tailed Student’s test. Error bars: means ± SD. ***P < 0.001 and ****P < 0.0001.
Figure 2
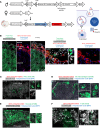
Figure 2. Fetoplacental CD63 sEVs reach the maternal immune cells in the spleen in the absence of detectable fetomaternal chimeric cells.
(A) Diagram of nuclear-BFP mScarlet-CD63LSL B6 male × CMVCre/+ B6 female pregnancy model. Following Cre recombination, fetoplacental cells express nuclear-BFP and generate sEVs bearing mScarlet fused to mouse CD63, both driven by the ubiquitous β-actin promoter. MVB, multivesicular body. (B) Detection by microscopy of mScarlet-CD63 sEVs in trophoblast cells identified by their BFP-expressing nuclei, analyzed on E17.5 in CMVCre/+ B6 females impregnated by nuclear-BFP mScarlet-CD63LSL B6 males. Inset: interface between the trophoblast and decidua basalis. ROI 1: a trophoblast cell identified by its cytokeratin expression, BFP+ nucleus, and content of mScarlet-CD63 sEVs. ROI 2: a maternal cell (BFP nucleus) with mScarlet-CD63 likely acquired from trophoblast cells invading the decidua. Original magnification, ×200, ×400. Images representative of 4 placentas. (CF) Microscopy analysis on E17.5 of cryosections of spleens from CMVCre/+ B6 females impregnated by nuclear-BFP mScarlet-CD63LSL B6 males. mScarlet-CD63 is detectable in the maternal FDC network, MZ macrophages, red pulp macrophages, and cDCs. Fetoplacental cells expressing nuclear-BFP were undetectable in the maternal spleen. Images representative of multiple sections of spleens from 4 pregnant females. Original magnification, ×200.
Figure 3
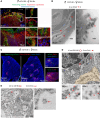
Figure 3. Fetoplacental Ags are relayed to maternal immune cells via sEVs.
(A) Microscopy of expression of mOVA on cryosections of placentas of BALB/c females impregnated with mOVA B6 males. Dotted line: limit between the junctional zone and the labyrinth. Representative of 6–8 placentas from 3 pregnant females. Original magnification, ×200. (B) Detection of mOVA by IEM on sections of placentas of BALB/c females mated with mOVA B6 males. Asterisk, cell membrane invaginations in trophoblast cells. Original magnification, ×20,000, ×80,000. TC, trophoblast cell; MBS, maternal blood space; Desm, desmosome. (C) Detection by microscopy of mOVA on cryosections of spleens of BALB/c females impregnated with heterozygous mOVA B6 males. Representative of spleens from 4 pregnant mice per time point. Original magnification, ×200. (D) IEM of OVA Ag (6 nm gold) on sEVs captured by an FDC identified by expression of CD21/35 (10 nm gold, red circles) in the spleen of a BALB/c female mated with an mOVA B6 male and analyzed on E17.5. Fetoplacental sEVs expressing OVA in the endocytic compartment (pseudocolored) of the FDC. ROIs: detail of OVA Ag (6 nm gold, arrows) on fetoplacental sEVs internalized by the FDC. Original magnification, ×20,000, ×80,000. N, nucleus. (E) IEM of fetoplacental sEVs bearing paternal mOVA (6 nm gold, arrow) within interconnected vesicles of MZ CD169+ macrophages (20 nm gold, red circle) in the spleen of a BALB/c female mated with a mOVA B6 male and analyzed on E17.5. Original magnification, ×20,000, ×80,000.
Figure 4
Figure 4. Maternal plasma carries paternal Ag associated with EVs and in soluble form.
(A) Electron microscopy of pregnant mouse plasma sEVs and MVs bound to the OVA Ab–coated beads used for immunoprecipitation. Original magnification, ×40,000. (B) Immunoprecipitation and Western blot detection of OVA, the sEV-associated markers CD81 and CD63, and the ER marker gp96 in MVs and sEVs purified from plasma of BALB/c females impregnated with mOVA B6 males or control WT B6 males (E12.5–E17.5) and in 10,000g and 100,000g EV-cleared plasma from the same females. (C) PNGase digestion of the immunoprecipitate restores the OVA MW to the size of the positive control, which indicates that the OVA released by the conceptus is N-glycosylated. (D) Analysis by Western blot of paternal Ag mOVA on sEVs purified on E12.5 and E17.5 from pooled plasma of BALB/c females impregnated by mOVA B6 or control B6 males. CD81 and gp96 were included as EV-associated and EV exclusion markers, respectively. In B and C results are representative of 3 different samples.
Figure 5
Figure 5. sEVs released by mouse primary trophoblast cultures bear paternal Ag.
(A) Methodology used to generate primary cultures of mouse trophoblast cells and purify EVs from the culture supernatants. NTA, nanoparticle tracking analysis; TEM, transmission electron microscopy. (B) Bright-field microscopy showing clusters of mouse trophoblast cells after 48 hours of culture. (C) Microscopy of cytospins of primary cultures of mouse trophoblast cells showing cytokeratin+ trophoblast cell clusters with minimal contamination with desmin+ decidual cells. (D) Immunoprecipitation and Western blot of purified EVs and EV-clarified supernatants from mouse primary trophoblast cultures from placentas of BALB/c females impregnated by mOVA B6 (on the left) or control WT B6 males (on the right). Samples were immunoprecipitated with a polyclonal Ab against OVA and analyzed by Western blot for detection of OVA with a monoclonal Ab, the sEV-associated marker CD63, and the ER marker gp96. Results representative of 2 independent experiments. (E) IEM of primary cultures of trophoblast cells from placentas (E12.5–E17.5) of BALB/c females impregnated with mOVA B6 males. Images show multivesicular bodies with intraluminal vesicles expressing OVA labeled with 6 nm gold. (F) IEM of primary cultures of trophoblast cells from placentas of BALB/c females impregnated with control WT B6 males (E12.5–E17.5) depicting multivesicular bodies with intraluminal vesicles on which OVA was not detected. In E and F, images are representative of 3 samples. Original magnification, ×40,000.
Figure 6
Figure 6. An i.v. injection of sEVs from cultures of trophoblasts mimics the traffic of endogenous fetoplacental sEVs in the mother’s spleen.
(A) Flow cytometry analysis of EV-bead complexes containing sEVs isolated from primary cultures of trophoblasts from placentas (E14.5–E17.5) of CMVCre+ B6 females (or control Cre B6 females), both impregnated with tdTomatoLSL mNeonGreen-CD81 (Exomap1) B6 males. The sEVs were captured by beads coated with CD63 and CD81 Ab. SSC, side scatter. (BF) Detection of sEVs purified from cultures of trophoblasts from placentas (E14.5–E17.5) of CMVCre+ B6 females × Exomap1 B6 males injected i.v. in B6 virgin females, on cryosections of spleens labeled for identification of FDCs (B), B cells (C), MZ macrophages (D), red pulp macrophages (E), or cDCs (F). Images are representative of 4 mice. Original magnification, ×200.
Figure 7
Figure 7. T cells in the maternal spleen recognize paternal Ag on trophoblast sEVs.
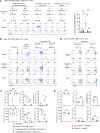
(A) Flow cytometry of proliferation of i.v. injected, CFSE-labeled OT-I CD8 T cells (CD90.1) in spleens of WT virgin female B6 mice (CD90.2) i.v. injected 24 hours later with EV-cleared supernatants or intact or lysed sEVs from cultures of trophoblast cells from BALB/c females impregnated with mOVA B6 or control WT B6 males. On the dot plot on the right, each dot represents 1 mouse. (B) Representative flow cytometry of splenocytes of B6 virgin females (CD90.2) i.v. injected with CFSE-labeled OT-I CD8+ T cells (CD90.1) and treated i.v. 24 hours later with sEVs from primary trophoblast culture supernatants from BALB/c females impregnated with mOVA B6 males or control WT B6 males. As a positive control of OT-I cell activation, a group was injected i.p. with soluble OVA + agonistic CD40 Ab + poly I:C, 24 hours after the OT-I cell transfer. Experiments were analyzed 2 days after sEV injection. (C) Quantification of the results shown in B; each dot represents 1 mouse. (D) FACS analysis of i.v. administered OT-I T cells (CD90.1) in spleens of females (CD90.2) mated with mOVA or WT B6 male mice. OT-I T cells were i.v. infused on E13.5, and splenocytes were FACS-analyzed 2 days later. (E) Quantification of the results in D; each dot represents 1 mouse. In A and C, comparisons by 1-way ANOVA with multiple comparisons. In E, comparisons by 2-tailed Student’s test. Error bars: means ± SD. *P < 0.05, **P < 0.01, ***P < 0.001, ****P < 0.001.
Figure 8
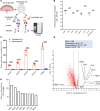
Figure 8. Characterization by high-resolution LC-MS of protein cargo in mouse trophoblast sEVs and the parent trophoblast cells.
(A) Approach used for comparative analysis by high-resolution LC-MS of the proteome of mouse trophoblast sEVs and their parent cells. (B) Normalized expression of sEV biomarkers in trophoblast sEV samples analyzed by LC-MS. Each dot represents an independent trophoblast sEV sample. (C) Comparative quantitative expression of sEV exclusion proteins in trophoblast cells versus trophoblast sEVs. Each dot corresponds to 1 independent trophoblast sEV or trophoblast cell sample. GOSR1, Golgi SNAP receptor complex member 1; gPAPP, Golgi-resident PAP-specific 3′-phosphatase-coupled sulfotransferase; ERGIC1, endoplasmic reticulum-Golgi intermediate compartment 1 protein; ERLEC1, endoplasmic reticulum lectin 1; LMNB2, Lamin B2. (D) Volcano plot obtained by quantitative analysis by LC-MS of the proteome of trophoblast sEVs versus trophoblast cells. The horizontal dotted line indicates the FDR cutoff line set at P < 0.05. The vertical dotted lines represent 2-fold change cutoff. DEGs, differentially expressed genes; FC, fold-change. (E) FC increase of individual proteins in trophoblast sEVs versus trophoblast cells indicated in the volcano plot in E. (A) Created in BioRender. Powell, J. 2025. https://BioRender.com/go3g2fu ****P < 0.0001.
Figure 9
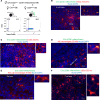
Figure 9. Reduction of release of fetoplacental sEVs decreases maternal T cell recognition of paternal Ag.
(A) Assessment by NTA of sEVs per trophoblast cell in supernatants of cultures of B6 mouse trophoblasts, WT or Rab27aKO. Each dot represents sEVs from a different culture. (B) Proliferation of CFSE-labeled OT-I CD8+ T cells (CD90.1) in spleens of WT or Rab27aKO B6 females (CD90.2) mated with mOVA B6 or mOVA Rab27aKO B6 males. OT-I cells were i.v. injected on E15.5 and splenocytes analyzed by FACS on E17.5. Dot plot (right): percentages of dividing OT-I cells, where each dot represents 1 mouse. (C) Division of CFSE-labeled OT-I cells (CD90.1) in spleens of WT or Rab27aKO B6 virgin females injected i.v. with sEVs from trophoblast cultures of E17.5 placentas from BALB/c females impregnated with mOVA B6 males. Dot plot (right): percentages of proliferating OT-I cells, where each dot represents 1 mouse. Splenocytes were analyzed by FACS 2 days after transfer of OT-I cells and injection of trophoblast sEVs. (D) Percentages of proliferation of CFSE-labeled OT-I cells (CD90.1) in spleens of B6 females impregnated with WT or mOVA B6 males, assessed by FACS on successive days PP. Each dot represents 1 mouse. (E) Microscopy of CD81-mNeonGreen in FDCs in B cell follicles on cryosections of spleens of CMVCre/+ or CMV B6 females, impregnated with Exomap1 B6 males and analyzed PP. Original magnification, ×200, ×400. (F) IEM showing OVA-bearing sEVs in maternal CD21/35+ FDCs on an ultrathin cryosection of a spleen of a WT B6 female impregnated with a mOVA B6 male and analyzed on day 7 PP. Representative of 2 spleens analyzed. Original magnification, ×20,000, ×80,000. In A, comparisons by 2-tailed Student’s test. In BD, comparisons by 1-way ANOVA with multiple comparisons. Error bars: means ± SD. *P < 0.05, **P < 0.01.
Figure 10
Figure 10. Human trophoblast sEVs are captured by human immune cells in vivo.
(A) Diagram depicting the generation of PHT cultures and purification of sEVs from PHT culture supernatants. The CM-DiI–labeled PHT-derived sEVs were i.v. injected in huMice, and the traffic of the injected EVs to spleen, bone marrow, liver, lung, and thymus was analyzed 18 hours later. (B) Percentages of human leukocyte chimerism in huMice analyzed in the spleen by flow cytometry at the endpoint of the experiments (14–16 weeks after injection of human CD34 hematopoietic stem cells). Each dot represents 1 huMouse. (C) Detection by fluorescence microscopy in human macrophages of spleen, liver, and bone marrow of CM-DiI (red) PHT sEVs injected i.v. in huMice. Representative of 6 huMice. Original magnification, ×200. (D) Representative ImageStream images of human B cells, cDC2s, and cDC1s carrying CM-DiI PHT sEVs, likely as sEV clusters detectable by the ImageStream analyzer. Original magnification, ×60, out of 20,000 cells analyzed per huMouse spleen. ImageStream analysis was done 18 hours after i.v. injection of the sEVs. (E) Pooled data from the ImageStream analysis shown in D with percentages of human T cells, B cells, and cDCs with CM-DiI content in splenocytes of huMice untreated or i.v. injected with CM-DiI PHT sEVs. Each dot represents 1 huMouse. In E, comparisons by 2-tailed Student’s test. Error bars: means ± SD. *P < 0.05, **P < 0.01.

References

    1. Erlebacher A, et al. Constraints in antigen presentation severely restrict T cell recognition of the allogeneic fetus. J Clin Invest. 2007;117(5):1399–1411. doi: 10.1172/JCI28214. - DOI - PMC - PubMed
    1. Moldenhauer LM, et al. Cross-presentation of male seminal fluid antigens elicits T cell activation to initiate the female immune response to pregnancy. J Immunol. 2009;182(12):8080–8093. doi: 10.4049/jimmunol.0804018. - DOI - PubMed
    1. Aluvihare VR, et al. Regulatory T cells mediate maternal tolerance to the fetus. Nat Immunol. 2004;5(3):266–271. doi: 10.1038/ni1037. - DOI - PubMed
    1. Rowe JH, et al. Pregnancy imprints regulatory memory that sustains anergy to fetal antigen. Nature. 2012;490(7418):102–106. doi: 10.1038/nature11462. - DOI - PMC - PubMed
    1. Rowe JH, et al. Foxp3(+) regulatory T cell expansion required for sustaining pregnancy compromises host defense against prenatal bacterial pathogens. Cell Host Microbe. 2011;10(1):54–64. doi: 10.1016/j.chom.2011.06.005. - DOI - PMC - PubMed