. 2025 May 22;53(10):gkaf429.
doi: 10.1093/nar/gkaf429.

Transcription regulation by RNA-induced structural strain in duplex DNA

Affiliations

Transcription regulation by RNA-induced structural strain in duplex DNA

Aura Cencini et al. Nucleic Acids Res. .

Abstract

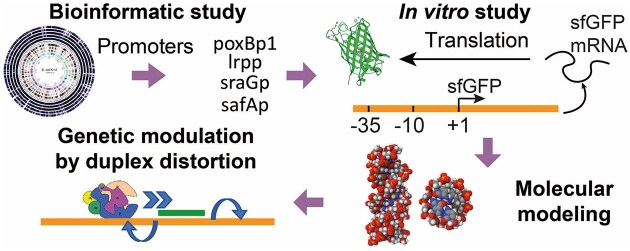
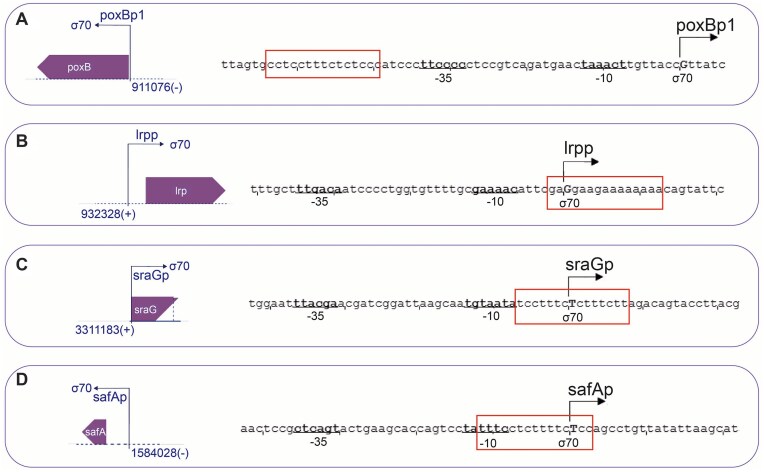
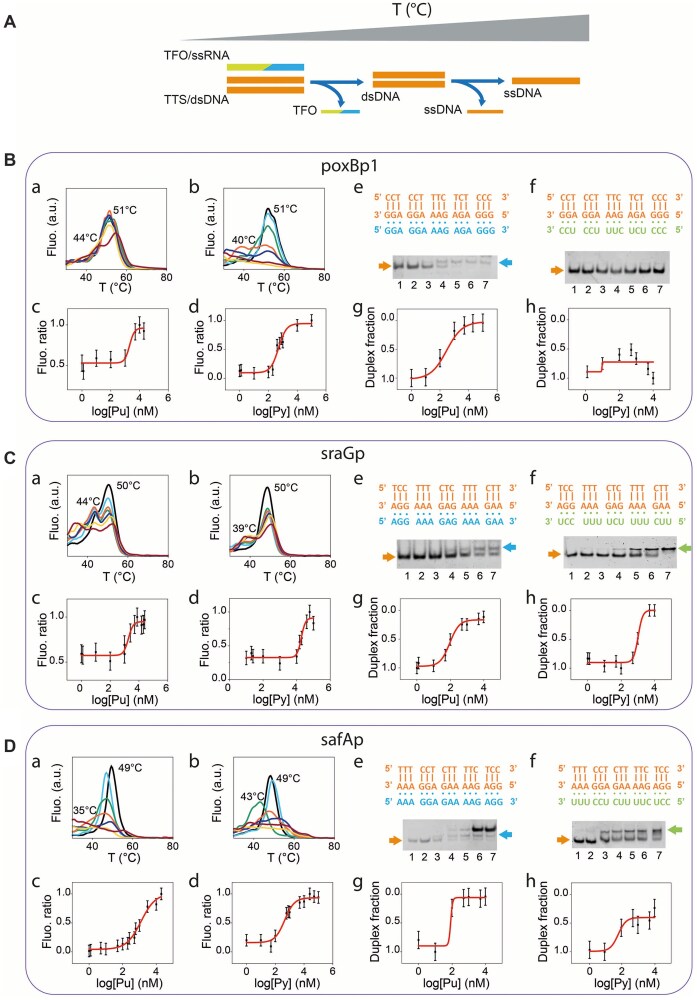
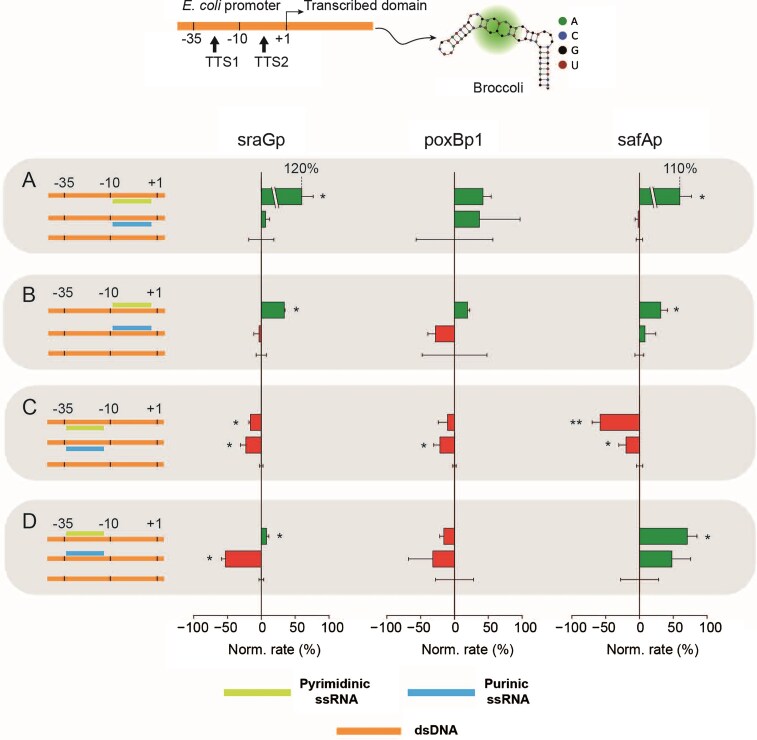
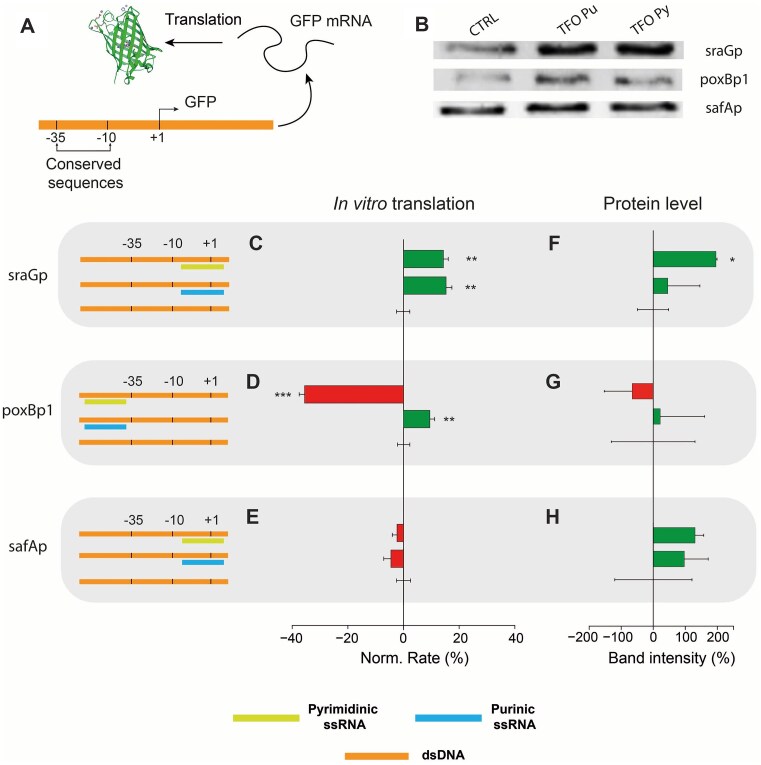
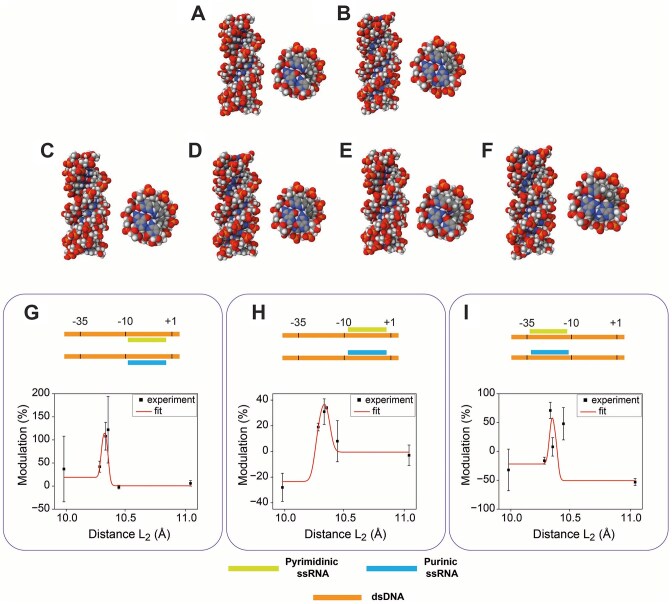
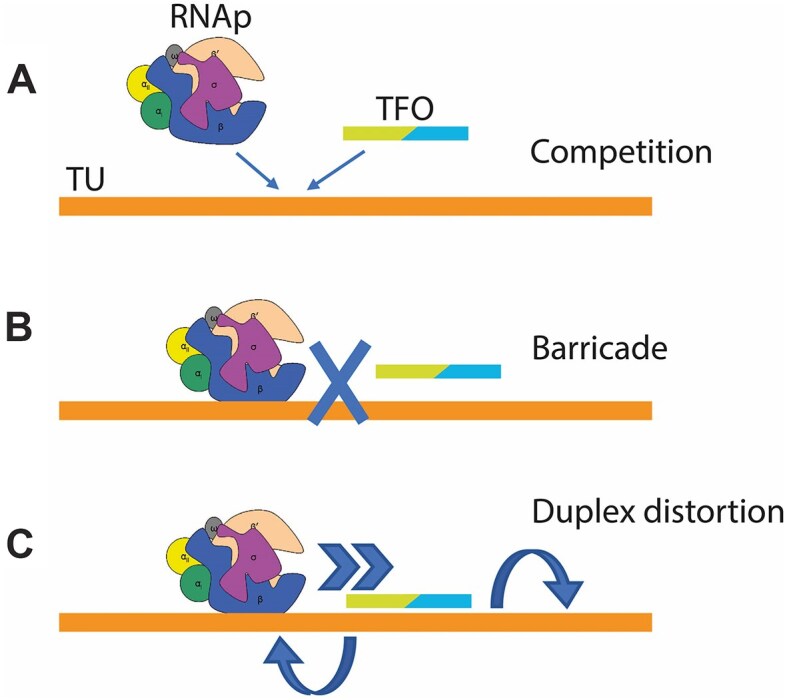
Non-coding RNAs belong to a heterogenous family that, among other functions, acts as a biomolecular regulator of gene expression. In particular, lncRNAs, which are estimated to be as numerous as coding RNAs in humans, are thought to interact with genomic DNA to form triple helices. However, experimental evidence of their involvement with processes, such as chromatin structure dynamics or RNA transcription, is still missing. Here, a mechanism of transcription enhancement/inhibition is described, where hybrid RNA-DNA triplexes regulate transcription rates in Escherichia coli promoter-based designed architectures. Sequences associated with triplexes were identified in a library of bacterial promoters and characterized in vitro, followed by a synthetic biology approach to verify their ability to control transcription and translation. A model of the triplex-promoter complex was produced showing that transcription enhancement is due to a distortion of the duplex DNA as a consequence of its conjugation with RNA in the triplex assembly. These results point at a mechanism of RNA function that is still unknown and could be common in more complex organisms, such as metazoans including mammals, where non-coding RNAs are more abundant and are believed to play a fundamental role in determining hetero/euchromatin and transcription modulation.


Conflict of interest statement

The authors declare no competing interest.

Figures

Graphical Abstract
Graphical Abstract
Figure 1.
Figure 1.
On the left, schemes of the TUs associated with the promoters identified by Triplexator: (A) poxB promoter 1 (poxBp1) and its associated coding sequence for pyruvate oxidase; (B) lrp promoter (lrpp) associated with coding sequence for DNA-binding transcriptional dual regulator Lrp, leucine-responsive regulatory protein; (C) sraG promoter (sraGp) associated with coding sequence for small regulatory RNA; (D) safA promoter (safAp) associated with coding sequence for two-component system connector SafA. On the right, promoter structures corresponding to TUs reported on the left, where the −35/−10 consensus is marked by underlined nucleotides, +1 position is marked by an angled arrow reporting the promoter name, and the TTS is marked with a red square.
Figure 2.
Figure 2.
(A) Scheme of the triplex and duplex structure sequential denaturation at increasing temperatures. (B–  D): (a and b) Experimental melting temperature analysis varying the concentration of the purinic (Pu) or pyriminidic (Py) TFO, respectively. Colored lines light blue, green, orange, dark blue, yellow, and red refer to increasing TFO concentration. TFO concentrations are as follows: in B, a- 0, 1, 5, 10, 102, 5 · 102, and 5 · 103 nM; b- 0, 10, 102, 4 · 102, 103, 5 · 103, and 104 nM; in C, a- 0, 2.5, 5, 7.5, 10, 15, and 20 μM; b- 0, 5, 10, 20, 40, 60, and 80 μM; in D, a- 0, 1, 50, 102, 2.5 · 102, 103, and 104 nM; b- 0, 0.01, 0.1, 1, 10, 25, and 50 μM. (c and d) Sigmoidal fits of the RNA and DNA temperature dissociation peak ratios for increasing concentrations of purinic (Pu) and pyrimidinic (Py) TFO, respectively. (e and f) Sequences (top) and EMSA (bottom) of poxBp1, sraGp, and safAp TTSs with individually analyzed TFOs, either purinic, in e, or pyrimidinic, in f. Orange, blue, and green arrows identify DNA duplexes, Pu triplex, and Py triplex, respectively. Lane numbers mark different TFO concentrations, with 1 identifying the smallest one. TTS concentration was fixed at 100 nM, while TFO concentration was varied as follows: in B, e- 0, 1, 102, 5 · 102, 103, 5 · 103, and 104 nM; f- 0, 10, 102, 5 · 102, 103, 5 · 103, and 104; in C, e- 0, 1, 10, 50, 102, 5 · 102, and 103 nM; f- 0, 10, 50, 102, 5 · 102, 103, and 5 · 103 nM; in D, e- 0, 10, 102, 5 · 102, 103, 5 · 103, and 104; f- 0, 10, 102, 5 · 102, 103, 5 · 103, and 104 nM. (g and h) Sigmoidal fits of the duplex band normalized intensity for increasing concentrations of purinic (Pu) and pyrimidinic (Py) TFO, respectively. Each experiment was performed in three replicates. Data points represent mean values and error bars indicate standard deviations.
Figure 3.
Figure 3.
Broccoli transcription modulation using E. coli-based TUs and respective TFOs. The top scheme depicts the TU used for in vitro transcription experiments, where TTS1 and TTS2 indicate the two possible domains in which the TTSs for the different analyzed promoter (sraGp, poxBp1, and safAp) were inserted; (A) TTS positioned downstream of the promoter consensus, with the polypurinic domain in the template strand; (B) TTS positioned downstream of the promoter consensus, with the polypurinic domain in the sense strand; (C) TTS positioned within the promoter consensus, with the polypurinic domain in the template strand; and (D) TTS positioned within the promoter consensus, with the polypurinic domain in the sense strand. The columns reporting the experimental results in bar graphs are associated with, from left to right, sraGp, poxBp1, and safAp. Bar plots of the fluorescence change rates, green or red bars, indicate enhancement or inhibition, respectively, and they refer to a reference sample of TX-TL without TFO (error bar associated with 0% modulation). The star symbols next to the bar plots represent the P-value level obtained from a t-test: * for P < 0.05 and ** for P < 0.01. Each experiment was performed in three replicates. Bars represent mean values (normalized with respect to the control) and error bars indicate standard deviations.
Figure 4.
Figure 4.
GFP production using triplex technology. (A) Scheme of the GFP transcription-translation system (TX-TL); (B) Bands corresponding to GFP immunoblot analysis, where CTRL corresponds to the reference TX-TL samples without TFO. (C–E) Modulation of GFP biosynthesis where the artificial TU depicted in Panel A was subjected to its associated TFO (C- sraGp, D- poxBp1, and E- safAp). On the left, schemes of the specific promoter where the color-coded TFO bar is positioned on top of (polypurinic sequence is in the sense strand) or under (polypurinic sequence is in the template strand) the dsDNA. On the right, bar plots of the fluorescence change rates (green or red bars indicate enhancement or inhibition, respectively) are referred to a reference sample of TX-TL without TFO (error bar at 0% modulation). (F–H) Bar plots of the band intensity relative to panel B, normalized to the TX-TL reference sample. The star symbols next to the bars represent the P-value level obtained from a t-test: * for P < 0.05, ** for P < 0.01, and *** for P < 0.001. Each experiment was performed in three replicates. Bars represent mean values (normalized with respect to the control) and error bars indicate standard deviation.
Figure 5.
Figure 5.
Molecular modeling of triplex formation according to each individual TTS-TFO pair. Side- and top-views of the respective pyrimidine and purine motif modeled triplexes for the TTSs found in the promoter: safAp (A and B), poxBp1 (C and D), and sraGp (E and F). GI: Schemes of the triplex geometry (top side) and its associated average nucleotide distance at one end of the triplex model, reported in A–F, plotted against the respective transcription modulation.
Figure 6.
Figure 6.
Schemes representing three different triplex-mediated mechanisms of transcription modulation: (A) Competition, (B) Barricade, and (C) triplex-induced duplex distortion. The double-colored TFO indicates that both motifs are possible.

Similar articles

References

    1. Jinek M, Jiang F, Taylor DW et al. Structures of Cas9 endonucleases reveal RNA-mediated conformational activation. Science. 2014; 343:1247997. 10.1126/science.1247997. - DOI - PMC - PubMed
    1. Seelig G, Soloveichik D, Zhang DY et al. Enzyme-free nucleic acid logic circuits. Science. 2006; 314:1585–8. 10.1126/science.1132493. - DOI - PubMed
    1. Cavalieri F, Postma A, Lee L et al. Assembly and functionalization of DNA-polymer microcapsules. ACS Nano. 2009; 3:234–40. 10.1021/nn800705m. - DOI - PubMed
    1. Lilley DMJ Catalysis by the nucleolytic ribozymes. Biochem Soc Trans. 2011; 39:641–6. 10.1042/BST0390641. - DOI - PubMed
    1. Agmon I, Bashan A, Zarivach R et al. Symmetry at the active site of the ribosome: structural and functional implications. Biol Chem. 2005; 386:833–44. 10.1515/BC.2005.098. - DOI - PubMed

LinkOut - more resources