
Emergence of Oropouche Virus in Espírito Santo State, Brazil, 2024

Edson Delatorre et al. Emerg Infect Dis. 2025 Jun.

Abstract

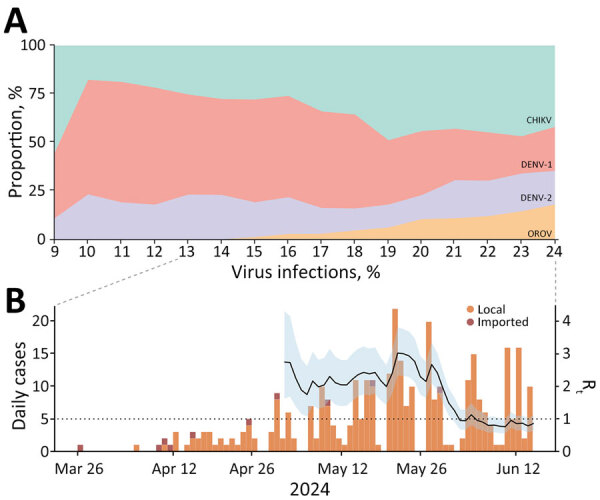
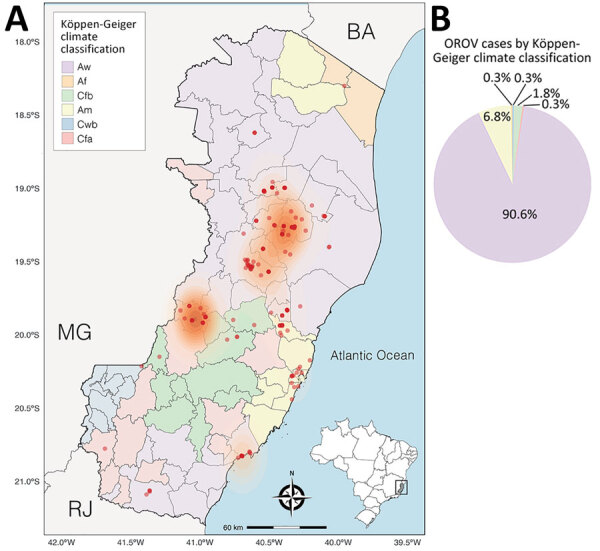
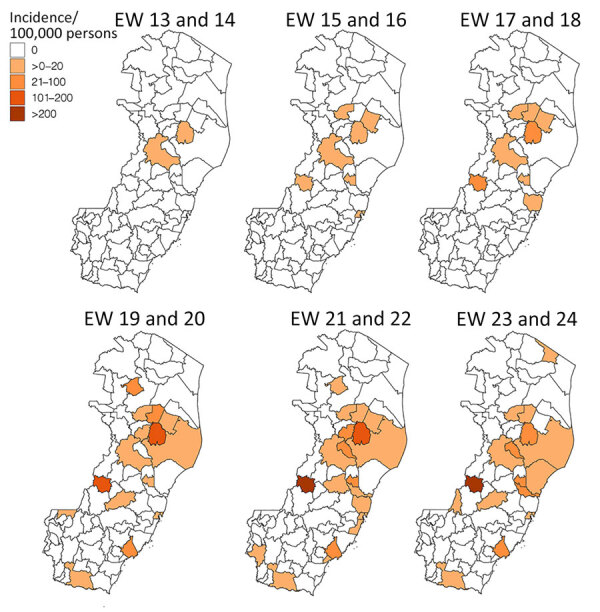
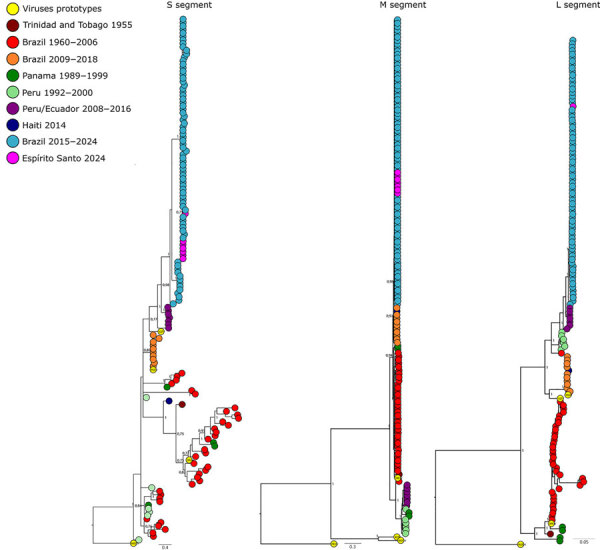
Oropouche virus (OROV), historically endemic to the Amazon, had spread to nearly all Brazil states by 2024; Espírito Santo emerged as a transmission hotspot in the Atlantic Forest biome. We characterized the epidemiologic factors driving OROV spread in nonendemic southeast Brazil, analyzing environmental and agricultural conditions contributing to viral transmission. We tested samples from 29,080 suspected arbovirus-infected patients quantitative reverse transcription PCR for OROV and dengue, chikungunya, Zika, and Mayaro viruses. During March‒June 2024, the state had 339 confirmed OROV cases, demonstrating successful local transmission. Spatial analysis revealed that most cases clustered in municipalities with tropical climates and intensive cacao, robusta coffee, coconut, and pepper cultivation. Phylogenetic analysis identified the Espírito Santo OROV strains as part of the 2022-2024 Amazon lineage. The rapid spread of OROV outside the Amazon highlights its adaptive potential and public health threat, emphasizing the need for enhanced surveillance and targeted control measures.

Keywords: Brazil; Oropouche virus; arboviruses; climate; disease outbreaks; epidemiology; symptoms; vector-borne infections; viruses.


Figures

Figure 1
Figure 1
Temporal distribution and reproduction number of Oropouche virus in Espírito Santo, Brazil. A) Weekly percentages of CHIKV, DENV-1, DENV-2, and OROV infections for epidemiologic weeks 9–24, 2024. B) Estimates of Rt during the OROV outbreak. Solid black curve represents the median Rt; shaded area indicates 95% credible interval, based on daily incidence data including local and imported cases. Dotted line indicates Rt = 1. Rt was estimated using sliding windows of τ = 7 days. CHIKV, chikungunya virus; DENV, dengue virus; OROV, Oropouche virus; Rt, instantaneous reproduction number.
Figure 2
Figure 2
Demographics, symptoms, and Ct value comparison in OROV-positive patients from Espírito Santo, Brazil. A) Age-sex pyramid of the OROV incidence rate (per 100,000 inhabitants). Incidence rates are shown for each age group. B) Frequency of symptoms reported in OROV-positive patients. C) Boxplots of Ct values from OROV reverse transcription PCR in patients with or without fever, headache, myalgia, and retroorbital pain. Black horizontal bars indicate medians, tops and bottoms of boxes indicate interquartile ranges, vertical whiskers indicate ranges. Gray dots represent individual Ct values. p values determined by 2-sided Mann–Whitney U test for each comparison.
Figure 3
Figure 3
Spatial distribution of Oropouche virus cases and climate classification in Espírito Santo, Brazil. A) Espírito Santo, with municipalities colored according to the Köppen-Geiger climate classification. Red dots indicate cases. Orange shading represents case density. Inset shows location of Espírito Santo state in Brazil. B) Pie chart showing the percentage of cases in each Köppen-Geiger climate category.
Figure 4
Figure 4
Oropouche virus case incidence by municipality and 2-week epidemiologic period, Espírito Santo state, Brazil. EW, epidemiologic week.
Figure 5
Figure 5
Bayesian phylogenetic trees created from analysis of Oropouche virus segments associated with the reassortant lineage M1L2S2 in Espírito Santo, Brazil, and reference sequences. Each tree includes a representative subsample of genomes from the epidemic clade (highlighted); tip colors indicate sampling locations. Branch support values are shown for the main clades. Scale bars indicate the number of nucleotide substitutions per site. S, small; M, medium; L, long.

Similar articles

References

    1. de Souza WM, Calisher CH, Carrera JP, Hughes HR, Nunes MRT, Russell B, et al. ICTV virus taxonomy profile: Peribunyaviridae 2024. J Gen Virol. 2024;105:002034. 10.1099/jgv.0.002034 - DOI - PMC - PubMed
    1. Sakkas H, Bozidis P, Franks A, Papadopoulou C. Oropouche fever: a review. Viruses. 2018;10:175. 10.3390/v10040175 - DOI - PMC - PubMed
    1. Travassos da Rosa JF, de Souza WM, Pinheiro FP, Figueiredo ML, Cardoso JF, Acrani GO, et al. Oropouche virus: clinical, epidemiological, and molecular aspects of a neglected orthobunyavirus. Am J Trop Med Hyg. 2017;96:1019–30. 10.4269/ajtmh.16-0672 - DOI - PMC - PubMed
    1. Wesselmann KM, Postigo-Hidalgo I, Pezzi L, de Oliveira-Filho EF, Fischer C, de Lamballerie X, et al. Emergence of Oropouche fever in Latin America: a narrative review. Lancet Infect Dis. 2024;24:e439–52. 10.1016/S1473-3099(23)00740-5 - DOI - PubMed
    1. Pereira-Silva JW, Ríos-Velásquez CM, Lima GRD, Marialva Dos Santos EF, Belchior HCM, Luz SLB, et al. Distribution and diversity of mosquitoes and Oropouche-like virus infection rates in an Amazonian rural settlement. PLoS One. 2021;16:e0246932. 10.1371/journal.pone.0246932 - DOI - PMC - PubMed

MeSH terms

Supplementary concepts

LinkOut - more resources