. 2025 Jul;13(7):e0302424.
doi: 10.1128/spectrum.03024-24. Epub 2025 May 22.

Transcriptomic insights into Candida albicans adaptation to an anaerobic environment

Affiliations

Transcriptomic insights into Candida albicans adaptation to an anaerobic environment

Karen D Zeise et al. Microbiol Spectr. 2025 Jul.

Abstract

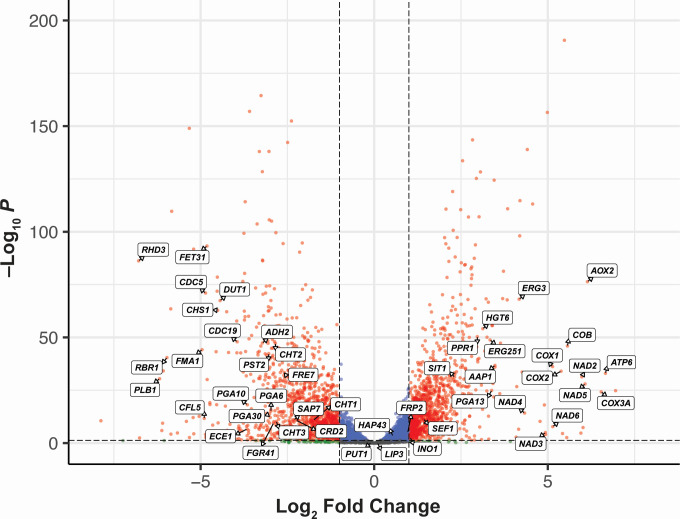
Candida albicans is a clinically significant fungal pathogen capable of adapting to diverse host environments, including steep oxygen gradients ranging from ~21% oxygen to anaerobic. The ability to withstand varied oxygen levels is paramount to establishing colonization and persisting in host niches, and oxygen deprivation can also augment antifungal resistance. In this study, we used RNA sequencing to compare the global transcriptomic profiles of two strains of C. albicans (SC5314 and CHN1) grown purely anaerobically to those grown aerobically. In C. albicans SC5314, we observed a strong induction of the alternative oxidase AOX2 and several genes encoding subunits of mitochondrial enzyme complexes I, II, and V, signifying a shift to alternative respiration. Consistent with the diminished ATP production from this process, there was a significant downregulation of genes associated with growth and metabolism, including histones and ribosomal proteins, as well as chitinases and other genes involved in cell wall remodeling. Interestingly, the anaerobic C. albicans cultures had decreased expression of candidalysin (ECE1) and other virulence factors, contrasting with other studies reporting enhanced pathogenicity under oxygen deprivation. There were a greater number of significantly upregulated genes in C. albicans CHN1 compared to SC5314; however, most of the top 50 upregulated genes under anaerobic conditions were consistent between the two strains. The predominant difference in down-regulated genes between the two strains could be mapped to differences in hyphal transformation under aerobic conditions. Overall, our study provides a window into the molecular mechanisms of C. albicans adaptation between aerobic to anaerobic environments.IMPORTANCECandida albicans is a leading cause of fungal infections in humans, posing significant clinical challenges due to its remarkable adaptability and increasing antifungal resistance. Anaerobic environments can promote antifungal resistance, necessitating a deeper understanding of how C. albicans adapts to anoxia. While much research has been done to identify mechanisms underlying adaptation to hypoxia (i.e., low oxygen), this is the first study evaluating the global transcriptomic response of C. albicans to anoxia (no oxygen). Here, we uncover key transcriptomic changes that enable C. albicans to survive in the absence of oxygen, which are distinct from those identified under hypoxic conditions. Our research addresses a gap in current knowledge that may be exploited for combatting antifungal resistance.

Keywords: Candida albicans; anaerobic; transcriptomics.


Conflict of interest statement

The authors declare no conflict of interest.

Figures

Fig 1
Fig 1
Sequencing results and phenotypic observations from C. albicans SC5314 cultures. (A) Percentages of sequenced reads that mapped to exons (light green) vs intronic/intergenic regions (gray). (B) PCA of the aerobic and anaerobic cultures based on their transcriptomic profiles. (C) Brightfield micrographs of the aerobic and anaerobic cultures at the time of collection for RNA isolation. Scale bar = 20 µm. (D) Quantification of C. albicans hyphae in the aerobic and anaerobic cultures. *P < 0.05, unpaired t-test.
Fig 2
Fig 2
Significantly differentially expressed genes in the C. albicans SC5314 anaerobic cultures. Volcano plot showing the significantly differentially expressed genes in the anaerobic cultures relative to aerobic cultures. Genes that had a log2 fold change >1 (twofold increase) or <−1 (twofold decrease) and P < 0.05 were considered significant and are shown as red dots. Blue dots indicate genes that had a statistically significant change in expression (P < 0.05) but did not meet the log2 fold change cutoff. Green dots correspond to genes that did not reach statistical significance but did reach the threshold for log2 fold change, and gray dots indicate genes that did not meet either cutoff. An unlabeled version of this plot is included in Fig. S2.
Fig 3
Fig 3
Heatmaps of the top 50 upregulated and downregulated genes in C. albicans strains under anaerobic vs aerobic conditions. (A) Differential gene expression in SC5314. (B) Differential gene expression in CHN1. Top differentially expressed genes were selected as >2 log2 fold change (positive or negative) and −log10 (adjusted P-value) >55. Data are shown as log2 fold change from aerobic expression. Red indicates higher gene expression under anaerobic conditions, and blue indicates lower gene expression under anaerobic conditions. Genes are grouped according to differential expression levels in each strain, with most upregulated at the top and most downregulated at the bottom.
Fig 4
Fig 4
Normalized transcript counts for genes significantly affected by anaerobic growth in C. albicans SC5314. Transcripts per million (TPM) of genes involved in (A) respiration, (B) iron and copper homeostasis, (C) cell wall structure, filamentation, and virulence, (D) metabolism, (E) stress response, (F) chitin remodeling, (G) ribosome structure, and (H) histone structure under aerobic (black bars) and anaerobic (gray bars) conditions. Expression is shown on a log2 scale. Bars represent mean expression with individual points denoting TPM in a given culture. Data were obtained from three independent experiments. *P < 0.05 (anaerobic vs aerobic), unpaired t-test.
Fig 5
Fig 5
Sequencing results and phenotypic observations from C. albicans CHN1 cultures. (A) Percentages of sequenced reads mapped to exons (light green) vs intronic/intergenic regions (gray). (B) PCA of the aerobic and anaerobic cultures based on their transcriptomic profiles. (C) Brightfield micrographs of the aerobic and anaerobic cultures at the time of collection for RNA isolation. Scale bar = 20 µm. (D) Quantification of C. albicans hyphae in the aerobic and anaerobic cultures.
Fig 6
Fig 6
Significantly differentially expressed genes in the C. albicans CHN1 anaerobic cultures. Volcano plot showing the significantly differentially expressed genes in the anaerobic cultures relative to aerobic cultures. Genes that had a log2 fold change >1 (twofold increase) or <−1 (twofold decrease) and P < 0.05 were considered significant and are shown as red dots. Blue dots indicate genes that had a statistically significant change in expression (P < 0.05) but did not meet the log2 fold change cutoff. Green dots correspond to genes that did not reach statistical significance but did reach the threshold for log2 fold change, and gray dots indicate genes that did not meet either cutoff. An unlabeled version of this plot is included in Fig. S3.
Fig 7
Fig 7
Normalized transcript counts for genes affected by anaerobic growth in C. albicans CHN1. Transcripts per million (TPM) of genes involved in (A) respiration, (B) iron and copper homeostasis, (C) cell wall structure, filamentation, and virulence, (D) metabolism, (E) stress response, (F) chitin remodeling, (G) ribosome structure, and (H) histone structure under aerobic (black bars) and anaerobic (gray bars) conditions. Expression is shown on a log2 scale. Bars represent mean expression with individual points denoting TPM in a given culture. Data were obtained from three independent experiments. *P < 0.05 (anaerobic vs aerobic), unpaired t-test.

Similar articles

References

    1. Singhal R, Shah YM. 2020. Oxygen battle in the gut: hypoxia and hypoxia-inducible factors in metabolic and inflammatory responses in the intestine. J Biol Chem 295:10493–10505. doi: 10.1074/jbc.REV120.011188 - DOI - PMC - PubMed
    1. Zeise KD, Woods RJ, Huffnagle GB. 2021. Interplay between Candida albicans and lactic acid bacteria in the gastrointestinal tract: impact on colonization resistance, microbial carriage, opportunistic infection, and host immunity. Clin Microbiol Rev 34:e0032320. doi: 10.1128/CMR.00323-20 - DOI - PMC - PubMed
    1. Lopes JP, Stylianou M, Backman E, Holmberg S, Jass J, Claesson R, Urban CF. 2018. Evasion of immune surveillance in low oxygen environments enhances Candida albicans virulence. MBio 9:e02120-18. doi: 10.1128/mBio.02120-18 - DOI - PMC - PubMed
    1. Pradhan A, Avelar GM, Bain JM, Childers DS, Larcombe DE, Netea MG, Shekhova E, Munro CA, Brown GD, Erwig LP, Gow NAR, Brown AJP. 2018. Hypoxia promotes immune evasion by triggering β-glucan masking on the Candida albicans cell surface via mitochondrial and cAMP-protein kinase A signaling. MBio 9:e01318-18. doi: 10.1128/mBio.01318-18 - DOI - PMC - PubMed
    1. Savage HP, Bays DJ, Tiffany CR, Gonzalez MAF, Bejarano EJ, Carvalho TP, Luo Z, Masson HLP, Nguyen H, Santos RL, Reagan KL, Thompson GR, Bäumler AJ. 2024. Epithelial hypoxia maintains colonization resistance against Candida albicans. Cell Host Microbe 32:1103–1113. doi: 10.1016/j.chom.2024.05.008 - DOI - PMC - PubMed

LinkOut - more resources