. 2025 Aug 4;222(8):e20250339.
doi: 10.1084/jem.20250339. Epub 2025 May 22.

A CARMIL2 gain-of-function mutation suffices to trigger most CD28 costimulatory functions in vivo

Affiliations

A CARMIL2 gain-of-function mutation suffices to trigger most CD28 costimulatory functions in vivo

Fanghui Zhang et al. J Exp Med. .

Abstract

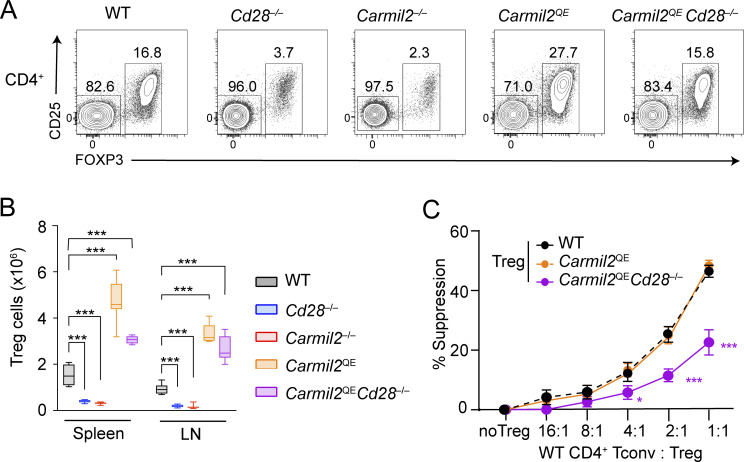
Naive T cell activation requires both TCR and CD28 signals. The CARMIL2 cytosolic protein enables CD28-dependent activation of the NF-κB transcription factor via its ability to link CD28 to the CARD11 adaptor protein. Here, we developed mice expressing a mutation named Carmil2QE and mimicking a mutation found in human T cell malignancies. Naive T cells from Carmil2QE mice contained preformed CARMIL2QE-CARD11 complexes in numbers comparable to those assembling in wild-type T cells after CD28 engagement. Such ready-made CARMIL2QE-CARD11 complexes also formed in CD28-deficient mice where they unexpectedly induced most of the functions that normally result from CD28 engagement in a manner that remains antigen-dependent. In turn, tumor-specific T cells expressing Carmil2QE do not require CD28 engagement and thereby escape to both PD-1 and CTLA-4 inhibition. In conclusion, we uncovered the overarching role played by CARMIL2-CARD11 signals among those triggered by CD28 and exploited them to induce potent solid tumor-specific T cell responses in the absence of CD28 ligands and immune checkpoint inhibitors.


Conflict of interest statement

Disclosures: J. Celis-Gutierrez, R. Roncagalli, M. Malissen, and B. Malissen reported patent no. 23315449.1 (European Patent Office) pending. In addition, B. Malissen reported personal fees from AltruBio and personal fees from Janvier Group Biosciences outside the submitted work. No other disclosures were reported.

Figures

Figure 1.
Figure 1.
Effects of the CARMIL2 QE mutation on physiological Jurkat T cell activation. (A) WT, CARMIL2OST, and CARMIL2QE-OST Jurkat T cells were analyzed by flow cytometry for the expression of CD3 and CD28 (shaded histograms). Dashed line curves correspond to isotype-matched control antibodies (negative controls), and data are representative of two independent experiments. (B) WT, CARMIL2OST, and CARMIL2QE-OST Jurkat T cells were left untreated (−) or stimulated (+) with anti-CD3 plus anti-CD28 for 2 and 5 min at 37°C. Immunoblot analysis of equal amounts of TL of the specified cells probed with anti-CARMIL2, anti-CARD11, and an anti-ZAP70 loading control. Data are representative of two independent experiments. Left margin, molecular size in kilodaltons. (C) Quantitation of the immunoblot analysis shown in B. Bars represent normalized CARMIL2-ZAP-70 and CARD11-ZAP70 ratios (see Materials and methods). Data in C and E are presented as the mean ± SE. (D) WT, CARMIL2OST, and CARMIL2QE-OST Jurkat T cells were activated as in B, and immunoblot analysis of equal amounts of lysates from the specified cells subjected to AP on Strep-Tactin Sepharose beads, followed by elution of proteins with D-biotin, and probed with anti-CARMIL2 or anti-CARD11. Data are representative of two independent experiments. Left margin, molecular size in kilodaltons. (E) Quantitation of the immunoblot analysis shown in D. Bars represent normalized CARD11-CARMIL2 ratios. (F)CARMIL2OST and CARMIL2QE-OST Jurkat T cells were left untreated (−) or stimulated with anti-CD3 (+) in the presence (+) or absence (−) of anti-CD28 for 2 min at 37°C. Immunoblot analysis of equal amounts of lysates from the specified cells subjected to AP on Strep-Tactin Sepharose beads, followed by elution of proteins with D-biotin, and probed with anti-CARMIL2 or anti-CARD11. Data are representative of two independent experiments. Left margin, molecular size in kilodaltons. (G) WT, CARMIL2OST, and CARMIL2QE-OST Jurkat cells were stimulated with Raji cells that were preincubated in the absence (0) or presence of the specified concentrations of SEE. For each condition, the MFI of CD69+ cells was measured by flow cytometry 24 h after stimulation. Numbers on the y axis correspond to the MFI of CD69+ cells. Error bars correspond to the mean and SD. Data are representative of two independent experiments. (H) IL-2 production by CARMIL2OST and CARMIL2QE-OST Jurkat T cell clones stimulated with Raji cells alone (0) or in the presence of 0.05, 0.1, and 0.5 and 1 ng/ml SEE. Analysis of IL-2 production was performed 24 h after stimulation. The expression of IL-2 (pg/ml) is shown using boxplot with the median, boxed interquartile range, and whiskers extending to the most extreme point up to 1.5 times the interquartile range. Data are representative of two independent experiments, involving eight independent clones of Carmil2OST and Carmil2Q539E- OST Jurkat cells. Each dot corresponds to a clone of the specified Jurkat T cells. **P < 0.01, ***P ≤ 0.001, and ns, nonsignificant; unpaired Student’s t test. AP, affinity purification; TL, total lysates; MFI, mean fluorescence intensity. Source data are available for this figure: SourceData F1.
Figure S1.
Figure S1.
Schematic structure of the CARMIL proteins produced by WT mice and Carmil2 QE , Carmil2 OST , and Carmil2 QE-OST gene-targeted mice. Mouse CARMIL2 proteins are 1,397–amino acid-long multidomain cytosolic proteins that consist of PH, LRR, HD, CBR, MBD, and PRD domains (Stark et al., 2017; Zwolak et al., 2013). The DNA strand opposite to the one coding for the 3′ untranslated region of the mouse Carmil2 gene corresponds to the 3′ end of the Acd gene, which codes for a protein involved in telomere function, and its ablation is recessive lethal. In a former study, we developed gene-targeted mice expressing CARMIL2 proteins tagged at their carboxyl terminus with an affinity OST tag. The introduction of the OST coding sequence at the 3′ end of the Carmil2 gene adventitiously impaired the expression of the Acd gene. It prevented the establishment of mice homozygous for the Carmil2OST allele and reduced the sensitivity of our AP-MS analysis since only half of the CARMIL2 molecules were OST-tagged in viable heterozygous mice (Roncagalli et al., 2016). Therefore, to bypass this limitation, the present study uses mice in which the CARMIL2 and CARMIL2QE proteins were tagged with an OST tag at their N terminus. As a result, mice homozygous for those Carmil2OST and Carmil2QE-OST alleles were born at expected Mendelian frequencies. Moreover, introduction of the OST tag at the N terminus of CARMIL2 and CARMIL2QE molecules did not change their levels of expression as compared to their untagged counterparts (Fig. 2 A). Carmil2QE mice expressing CARMIL2QE molecules lacking an OST tag were also developed (see Materials and methods). They had a phenotype similar to that of Carmil2QE-OST mice (Fig. S5) and were used interchangeably with Carmil2QE-OST mice. PH, pleckstrin homology domain; LRR, leucine-rich region; HD, helical dimerization domain; CBR, capping protein-binding region; MBD, membrane-binding domain; PRD, proline-rich domain.
Figure 2.
Figure 2.
Preformed CARMIL2 QE -CARD11 complexes are found in unstimulated Carmil2 QE mouse T cells irrespective of CD28 expression. (A) CD4+ T cells purified from WT, Carmil2OST, and Carmil2QE-OST mice were either left untreated (−) or stimulated (+) with anti-CD3 plus anti-CD28 for 2 and 5 min at 37°C. Equal amounts of TL of the specified mouse CD4+ T cells were analyzed by immunoblots and probed with anti-CARMIL2, anti-CARD11, and an anti-ZAP70 loading control. (B) Immunoblot analysis of equal amounts of lysates from mouse CD4+ T cells prepared as in A and subjected to AP on Strep-Tactin Sepharose beads, followed by elution of proteins with D-biotin, and probed with anti-CARMIL2 or anti-CARD11. (C) Quantitation of the immunoblot analysis shown in B. Bars represent normalized CARMIL2-ZAP70 and CARD11-ZAP70 ratios. Data are presented as the mean ± SE in C, F, and I. (D) CD8+ T cells purified from OT-I Carmil2WT and OT-I Carmil2QE mice were either left untreated (−) or stimulated (+) with pervanadate for 2 and 5 min at 37°C. Equal amounts of TL of the specified mouse CD8+ T cells were analyzed by immunoblots and probed with anti-CARMIL2, anti-CARD11, and an anti-ZAP70 loading control. (E) Immunoblot analysis of equal amounts of lysates from mouse CD8+ T cells activated as in D and from which CARMIL2 or CARMIL2QE proteins were IP with an anti-CARMIL2 antibody, and subjected to immunoblot analysis with anti-CARMIL2 or CARD11. (F) Quantitation of the immunoblot analysis shown in E. Bars represent normalized CARMIL2-ZAP70 and CARD11-ZAP70 ratios. (G) CD4+ T cells purified from WT, Carmil2QE, and Carmil2QECd28−/− mice were either left untreated (−) for 2 min at 37°C or stimulated (+) with pervanadate for 2 min at 37°C. Equal amounts of TL of the specified mouse CD4+ T cells were analyzed by immunoblots and probed with anti-CARMIL2, anti-CARD11, and an anti-ZAP70 loading control. (H) Immunoblot analysis of equal amounts of lysates from mouse CD4+ T cells prepared as in G and from which CARMIL2 or CARMIL2QE proteins were IP with an anti-CARMIL2 antibody, and subjected to immunoblot analysis with anti-CARMIL2 or CARD11. (I) Quantitation of the immunoblot analysis shown in H. Bars represent normalized CARD11-CARMIL2 units. (J) CD4+ T cells from WT, Carmil2OST, and Carmil2QE-OST mice were left untreated (−) or stimulated with either of the anti-CD3 antibodies 2C11 and 17A2 (+) in the presence (+) or absence (−) of the anti-CD28 antibodies MAB4832 for 2 min prior to isolation of whole-cell lysates. Equivalent amounts of lysates were separated by SDS-PAGE and analyzed by immunoblot with an antibody specific for pTyr. Inducible phosphorylation of SLP76 pTyr128 (pSLP76), LAT pTyr171 (pLAT), and ERK1/2 pThr202/Tyr204 (pERK1/2) was also assessed by immunoblotting with phospho-specific antibodies. In A, B, D, E, G, H, and J, molecular weights in kilodaltons are shown in the left margin. Prior to biochemical analysis, comparable levels of TCRβ, CD3, and CD28 were found at the surface of T cells from WT, Carmil2OST, Carmil2QE-OST, OT-I Carmil2, OT-I Carmil2QE, and Carmil2QECd28−/−mice (Fig. S2 A). Data in A–J are representative of two independent experiments. AP, affinity purification; TL, total lysates; IP, immunoprecipitated; pTyr, phosphotyrosine. Source data are available for this figure: SourceData F2.
Figure 3.
Figure 3.
Effect of the Carmil2 QE mutation on thymic development including T reg cells and iNKT cells. (A) WT, Cd28−/−, Carmil2−/−, Carmil2QE, and Carmil2QECd28−/− thymi were analyzed by flow cytometry for the expression of CD4 and CD8. Numbers indicate the percentage of CD4CD8 double-negative, CD4+CD8+ double-positive, and CD4+ and CD8+ SP cells. (B) Analysis of lineage (CD25, MHCII, CD11b, CD161) thymocytes from the specified thymi using TCRβ-CD69 dot plots. They permit to identify TCRβ+CD69+ cells that went through TCR-mediated positive and negative selection (Ashby and Hogquist, 2024). Note that TCRβhiCD69 cells were also included in the specified TCRβ+CD69−/+ gate since they correspond to the most mature SP cells (Hogquist et al., 2015). (C) Analysis of CD4 and CD8 expression on gated TCRβ+CD69+/− cells showed that they include both DP and SP cells and permit to define CD4+ and CD8+ mature SP cells. (D) Numbers of total cells in thymi isolated from mice of the specified genotypes (see key). (E) Numbers of total TCRβ+CD69+/− cells in thymi isolated from mice of the specified genotypes (see key in D). (F) Numbers of CD8+ and CD4+ TCRβ+CD69+/− mature T cells in thymi isolated from mice of the specified genotypes (see key in D). (G) Total CD4+ SP cells from WT thymus were analyzed by flow cytometry using FOXP3 and CD25 expression and the percentage of FOXP3+CD25+ Treg cells among total CD4+ SP cells defined using the outlined areas. (H) Numbers of FOXP3+ Treg cells found in thymi isolated from mice of the specified genotypes (gating strategy as in G). The difference in FOXP3+ Treg cell numbers between Carmil2QE and Carmil2QECd28−/− thymi is not significant. (I) WT thymic iNKT cells were analyzed by flow cytometry using TCRβ expression and binding of α-galactosylceramide–complexed CD1d tetramers (CD11d tet), and their percentage among total thymocytes defined using the outlined area. (J) Numbers of iNKT cells gated as in I in thymi isolated from mice of the specified genotypes. Data in A–J were pooled from four experiments with a total of eight mice per group. The data in D–F, H, and J are shown as box plots with the median, boxed interquartile, and whiskers. Data were analyzed by two-way ANOVA applying the Holm–Sidàk multiple comparison toward the WT group. Only significant values with P ≤ 0.05 are shown. *P < 0.05, **P < 0.01, ***P < 0.001. DP, double positive; SP, single positive.
Figure 4.
Figure 4.
Effect of the Carmil2 QE mutation on peripheral T cell homeostasis. (A) Total T cells from LN of WT, Cd28−/−, Carmil2−/−, Carmil2QE, and Carmil2QECd28−/− mice were analyzed by flow cytometry for the expression of TCRβ and CD5. Numbers indicate the percentage of cells in the specified quadrants. (B) TCRβ+ cells from LN of the specified mice (gated as in A) were analyzed by flow cytometry for the expression of CD4 and CD8. Numbers indicate the percentage of cells in the CD4+CD8 and CD8+CD4 quadrants. (C) Numbers of TCRβ+CD4+ and TCRβ+CD8+ T cells in LN of mice of the specified genotypes (see key). (D) MFI of CD5 and TCRβ expression on CD4+ Tconv and CD8+ T cells isolated from the LN of the specified mice (see key in C). (E) CD4+ Tconv (CD4+conv) cells and CD8+ T cells from LN of WT, Cd28−/−, Carmil2−/−, Carmil2QE, and Carmil2QECd28−/− mice were analyzed by flow cytometry for the expression of CD44 and CD62L. It allows to segregate CD4+ T cells into naive (CD44loCD62Lhi) and effector-memory (CD44hiCD62Llo) cells, and CD8+ T cells into naive (CD44loCD62Lhi) and antigen-experienced CD44hi, which comprise central memory (CD62Lhi) and effector-memory (CD62Llo) CD8+ T cells. Numbers indicate the percentage of cells in the specified quadrants. (F) Numbers of central memory (cm) and of effector-memory (em) CD8+ and CD4+ Tconv cells in the LN of the specified mouse (see key). (G) Numbers of CD161+ NK cells in the spleen of the specified mouse (see key in F). Data in A–G were pooled from four experiments with a total of eight mice per group. Data in C, E, and F were analyzed by one- or two-way ANOVA applying the Holm–Sidàk multiple comparison toward the WT group. Only significant values with P ≤ 0.05 are shown in black, and values comparing Carmil2QE and Carmil2QECd28−/− mice are shown in red. *P < 0.05, **P < 0.01, ***P < 0.001. MFI, mean fluorescence intensity.
Figure 5.
Figure 5.
Effect of the Carmil2 QE mutation on peripheral T reg cell homeostasis and suppressive function. (A) Total CD4+ T cells from LN of the specified mice were analyzed by flow cytometry for the expression of CD25 and FOXP3. The FOXP3+CD25lo to high gate corresponds to Treg cells, and their percentages are shown. (B) Numbers of Treg cells in the spleen and LN of the specified mouse (see key). Data were pooled from four experiments with a total of 14 mice per group. Data are shown as box plots with the median, boxed interquartile, and whiskers. (C) Sorted Treg cells from WT, Carmil2QE, and Carmil2QECd28−/− spleens were cultured at the indicated ratio with CTV-labeled CD4+CD25 Tconv cells from WT mice in the presence of anti-CD3-CD28-coated beads, and the percentage of WT CD4+CD25 Tconv cells that have divided was evaluated after 72 h of culture (see Materials and methods). Data were pooled from four experiments with a total of six mice per group. Percent suppression was calculated using the following formula: (proliferationofTconvcellsaloneproliferationofTconvcellstreatedwithTregcells)/(proliferationofTconvcellsalone)×100. Mean value ± SEM are represented. Data in B and C were analyzed by one- or two-way ANOVA applying the Holm–Sidàk multiple comparison toward the WT group. Only significant values with P ≤ 0.05 are shown in black. *P < 0.05, ***P < 0.001.
Figure 6.
Figure 6.
CARMIL2-CARD11-dependent signals maximize TCR-induced proliferation, cytokine production, and expression of activation markers. (A) Naive CD4+ and CD8+ T cells purified from the spleen and LN of WT, Carmil2QE, and Carmil2QECd28−/−mice were activated in vitro with the specified concentrations of plate-bound anti-CD3 in the presence or absence of a fixed concentration (1 μg/ml) of soluble anti-CD28. CD4+ and CD8+ T cell proliferation was measured by luminescence after 48 h. Stimulation of Carmil2QE CD8+ T cells with anti-CD3 resulted in twofold increased proliferation as compared to anti-CD3–stimulated Carmil2QECd28−/− CD8+ T cells, the reason for which remains to be elucidated. Data were analyzed by one-way ANOVA applying the Holm–Sidàk multiple comparison toward the specified groups. *P < 0.05, **P < 0.01, ***P < 0.001. (B) Naive CD4+ T cells from the specified mice (see key in C) were activated as in A with 3 μg/ml of anti-CD3 in the presence or absence of 1 μg/ml anti-CD28 and the content of IL-2 present in the supernatant of 40-h-long coculture assessed. Also shown is the IL-2 produced upon stimulation with PMA and ionomycin. (C) Naive CD8+ T cells from the specified mice were activated as in A with 3 μg/ml of anti-CD3 in the presence or absence of 1 μg/ml anti-CD28 and the content of IFN-γ present in the supernatant of 40-h-long coculture assessed (see key). Data in A–C were pooled from two experiments out of four, each with a total of four mice per group. Mean value ± SEM are represented; ND indicates nondetectable IL-2 level. Data in B and C were analyzed by one-way ANOVA applying the Holm–Sidàk multiple comparison toward the specified groups. Only significant values with P ≤ 0.05 are shown. **P < 0.01, ***P < 0.001. (D) Naive CD4+ and CD8+ T cells purified from the spleen and LN of the specified mice (see key) were activated in vitro using anti-CD3 (3 μg/ml) plus anti-CD28 (1 μg/ml) cross-linkage, and the levels of CD278 (ICOS), CD71, CD91, CD272 (BTLA), and CD279 (PD-1) were determined by flow cytometry. The ratio of the MFI at t48h to the MFI at t0h is shown for each of the analyzed molecules. Data in D are shown as box plots with the median, boxed interquartile, and whiskers, and pooled from two experiments, each with a total of six mice per group. Data in D were analyzed by two-way ANOVA applying the Holm–Sidàk multiple comparison toward the specified groups. Only significant values with P ≤ 0.05 are shown. *P < 0.05, **P < 0.01, ***P < 0.001, ****P < 0.0001. Histograms corresponding to the levels of CD278 (ICOS), CD71, CD91, CD272 (BTLA), and CD279 (PD-1) on CD4+ and CD8+ T cells from WT, Carmil2OST, and Carmil2QE-OST mice prior to and after 48 h of activation are shown in Fig. S2 B. MFI, mean fluorescence intensity.
Figure S2.
Figure S2.
Comparative expression of cell surface markers on CD4 + and CD8 + T cells of WT, Carmil2 OST , Carmil2 QE-OST , OT-I Carmil2, OT-I Carmil2 QE , and Carmil2 QE Cd28 −/− mice. (A) Related to Fig. 2. Naive CD4+ and CD8+ T cells purified from the spleen and LN of WT, Carmil2OST, Carmil2QE-OST, OT-I Carmil2, OT-I Carmil2QE, and Carmil2QECd28−/− mice were analyzed by flow cytometry for the levels of TCR, CD3, and CD28 prior to biochemical analysis (shaded curves). Dashed line curves correspond to isotype-matched control antibodies (negative controls), and data are representative of two independent experiments. (B) Related to Fig. 6. Naive CD4+ and CD8+ T cells purified from the spleen and LN of WT, Cd28−/−, Carmil2−/−, Carmil2QE, and Carmil2QECd28–/–mice (see key) were activated in vitro using anti-CD3 plus anti-CD28 cross-linkage, and the levels of ICOS (CD278), CD71, CD98, BTLA (CD272), and PD-1 (CD279) were measured by flow cytometry prior to activation (t0, solid line curves) or after 48 h of activation (t48, shaded curves). Data are representative of two experiments, each with a total of six mice per genotype.
Figure S3.
Figure S3.
OT-I T cells develop normally in the presence of CARMIL2 QE molecules. (A) Total cells from OT-I and OT-I Carmil2QE thymi were analyzed by flow cytometry for the expression of CD4 and CD8. Numbers indicate the percentage of CD4CD8 double-negative, CD4+CD8+ double-positive, and CD4+ and CD8+ SP cells. Also shown on the right is the cellularity of OT-I and OT-1 Carmil2QE thymi. (B) Total cells from OT-I and OT-1 Carmil2QE thymi were analyzed for the expression of TCRβ and CD24. It permits to distinguish mature CD8+ T cells (TCRβ+ CD24) and immature SP CD8+ T cells (TCRβCD24+), the percentages of which are indicated by the number adjacent to outlined areas. Also shown on the right is the quantification of the numbers of TCRβ+ CD24 mature CD8+ T cells found in OT-I and OT-1 Carmil2QE thymi. (C) T cells from OT-I and OT-1 Carmil2QE LN were analyzed by flow cytometry for the presence of CD4+ and CD8+ T cells, the percentages of which are indicated by the number adjacent to outlined areas. Also shown on the right is the quantification of the numbers of T cells in OT-I and OT-1 Carmil2QE LN. (D) Gated CD8+ T cells from LN of OT-I and OT-1 Carmil2QE mice (see C) were analyzed using CD44 and CD62L expression. The percentages of naive (CD44loCD62Lhi), effector-memory (CD44hi CD62Llo), and central memory (CD44hi CD62Lhi) CD8+ T cells are indicated by the number adjacent to outlined areas. Also shown on the right is the quantification of the numbers of CD8+ effector-memory T cells in OT-I and OT-1 Carmil2QE LN. Data in A–D were pooled from three independent experiments with a total of six mice per group. Data quantification is shown as box plots with the median, boxed interquartile, and whiskers. Data were analyzed by two-way ANOVA applying the Holm–Sidàk multiple comparison toward the OT-I group. *P < 0.05, ns, nonsignificant. SP, single positive.
Figure 7.
Figure 7.
CARMIL2-CARD11-dependent signals replace CD28 engagement during antigen-induced proliferation and cytokine production. (A) Naive CD8+ T cells purified from OT-I and OT-I Carmil2QE spleens were stimulated with APC (corresponding to dendritic cells and B cells) isolated from the spleen of T cell–deficient Cd3eΔ5/Δ5 mice expressing (WT APC) or lacking CD80 and CD86 (Cd80−/−Cd86−/− APC; see key). APC were pulsed for 2 h with a graded concentration of OVA peptides corresponding to agonist (N4) or weak agonist (Q4 and T4) OVA peptides and used to stimulate OT-I and OT-I Carmil2QE T cells. T cell proliferation was measured by luminescence after 48 h. (B) Naive OT-I and OT-I Carmil2QE T cells were stimulated as in A with the N4, Q4, and T4 peptides (10−6 M) and the content of IL-2 present in the supernatant of 40-h-long coculture assessed (see key). (C) Naive OT-I and OT-I Carmil2QE T cells were stimulated as in A with N4, Q4, and T4 peptides (10−6 M) and the content of IFN-γ present in the supernatant of 40-h-long coculture assessed (see key in B). Data were pooled from four experiments, each with a total of five mice per group. Mean value ± SEM are represented; ND indicates nondetectable IL-2 and IFN-γ levels. Data were analyzed by one-way ANOVA applying the Holm–Sidàk multiple comparison toward the OT-I group. Only significant values with P ≤ 0.05 are shown. **P < 0.01, ***P < 0.001, ****P < 0.0001.
Figure 8.
Figure 8.
Expression of CARMIL2 QE molecules substitutes for CD28 engagement during responses to solid tumors. (A) Cohorts of 10-wk-old, WT, Cd28−/−, Carmil2−/−, Carmil2QE, and Carmil2QECd28−/− C57BL/6 mice were injected subcutaneously into the flank with 1 × 10⁵ cells of the BRAFV600EPtgs−/− syngeneic melanoma tumor and monitored for tumor growth using tumor size and weight. The mean and SEM are shown for the tumor size values, and the weight panel corresponds to box plots with the median, boxed interquartile, and whiskers. Data were pooled from three independent experiments with a total of 12–14 mice per group. (B) Immune cell infiltrate analysis of BRAFV600EPtgs1/Ptgs2−/− tumors 11 days after implantation in WT, Cd28−/−, Carmil2−/−, Carmil2QE, and Carmil2QECd28–/–mice. The percentages of intratumoral TCRβ+ cells, CD4+ T cells, CD8+ T cells, Treg cells, and NK cells among CD45+ cells are shown (see key in A). Box plots with the median, boxed interquartile, and whiskers are shown, and data were pooled from three independent experiments, each with a total of nine mice per group. (C) Tumor growth analysis in WT mice injected subcutaneously with MC38-OVA carcinoma cells and treated with isotype control antibody, anti-PD-1 antibody, OT-I T cells, or Carmil2Q538E OT-I T cells 6 days after tumor inoculation. The lines indicate tumor volume over time in individual mice up to the time they had to be euthanized. Tumor growth was monitored three times a week. Data are representative of two independent experiments each involving 10 mice per condition. (D) Results in C were expressed as mean tumor volume (mm3 ± SEM) and P values shown for day 24. (E) Analysis of immune cell infiltrates of MC38-OVA tumors 11 days after implantation in mice that have been infused with OT-I T cells and Carmil2QE OT-I T cells. The percentages of Vα2+Vβ5+ OT-I T cells, Vα2+Vβ5+Carmil2QE OT-I T cells, NK cells, and Treg cells among intratumoral CD45+ cells are shown. Data in A, B, D, and E were analyzed by one-way or two-way ANOVA applying the Holm–Sidàk multiple comparison toward the specified groups. Only significant values with P ≤ 0.05 are shown. *P < 0.05, **P < 0.01, ***P < 0.001, ****P < 0.0001.
Figure S4.
Figure S4.
Model summarizing the CD28-dependent traits induced by CARMIL2-CARD11-dependent or CARMIL2-CARD11-independent CD28 signals. In naive T cells, CD28 engagement by its CD80-CD86 ligands expressed on immunogenic APC triggers both CARMIL2-CARD11-dependent and CARMIL2-CARD11-independent signaling branches. The developmental and functional consequences of CD28 engagement for which the CARMIL2-CARD11-dependent or CARMIL2-CARD11-independent CD28 signaling branches are necessary and sufficient are shown below each signaling branch. Engagement of the TCR results in the activation of the LCK and ZAP-70 protein tyrosine kinases. It leads to the formation of the LAT signalosome, which controls phospholipase PLC-γ1 activity and triggers the production of inositol 1,4,5-trisphosphate and diacylglycerol (DAG), ultimately resulting in the activation of the NFAT and AP1 transcription factors (Shapiro et al., 1998). DAG also promotes the recruitment of the protein serine/threonine kinase PKC-θ at the plasma membrane, enabling its incorporation into the CD28 microclusters that form at the immune synapse and contain CARMIL2-CARD11 complexes (Liang et al., 2013). Following phosphorylation by PKC-θ and additional TCR-operated protein serine/threonine kinases, the CARD11 molecules bound to CARMIL2 associate with BCL10 and MALT1 to give rise to CBM complexes capable of activating the NF-κB transcription factor, the JNK, and the MALT1 protease (Ruland and Hartjes, 2019). PI3K constitutes one of the effectors of the CARMIL2-CARD11-independent CD28 signaling branch. It accounts for CD28-mediated production of phosphatidylinositol (3,4,5)-triphosphate (PIP3), leading to the recruitment and activation of the PH domain–containing protein kinase AKT and the occurrence of CD28-CD80 cis interactions at the immune synapse (Zhao et al., 2023). CD28-generated PIP3 also enhances the recruitment and activity of ITK and PLC-γ1, two pleckstrin homology domain–containing proteins that are part of the TCR-operated LAT signalosome, thereby reinforcing the production of DAG (Michel et al., 2001). CD28 costimulation also promotes the ubiquitylation and proteasomal degradation of the E3 ubiquitin ligase CBL-B, and regulates mRNA processing and T cell metabolism via signals that remain to be characterized (Lotze et al., 2024). The CD28 cytoplasmic tail contains three distinct protein–protein interaction motifs denoted as YMNM, PYAPP, and AAYRS (red circles), and the PYAPP motif is the sole necessary to trigger the CARMIL2-CARD11-mediated signals; JNK, c-Jun N-terminal kinase.
Figure S5.
Figure S5.
Thymus and LN of WT, Carmil2 QE , and Carmil2 QE-OST mice have similar phenotypes. (A) WT, Carmil2QE, and Carmil2QE-OST thymi were analyzed by flow cytometry for the expression of CD4 and CD8. Numbers indicate the percentage of CD4CD8 double-negative, CD4+CD8+ double-positive, and CD4+ and CD8+ single-positive cells. Also shown on the right is the cellularity of WT, Carmil2QE, and Carmil2QE-OST thymi. (B) Total cells from WT, Carmil2QE, and Carmil2QE-OST LN were analyzed by flow cytometry for the expression of TCRβ and TCRγδ, and the corresponding percentages of TCRβ+ and TCRγδ+ cells were indicated by the number adjacent to outlined areas. Also shown on the right is the number of TCRβ+ and TCRγδ+ cells in WT, Carmil2QE, and Carmil2QE-OST LN (see key in A). (C) TCRβ+ cells from WT, Carmil2QE, and Carmil2QE-OST LN (see gating strategy in B) were analyzed for CD4 and CD8 expression and the percentages of CD4+ and CD8+ cells indicated by the number adjacent to outlined areas. Also shown on the right is the number of TCRαβ+ CD4+ and CD8+ Τ cells in WT, Carmil2QE, and Carmil2QE-OST LN (see key in A). (D) FOXP3+ Treg cells present among total CD4+ T cells isolated from WT, Carmil2QE, and Carmil2QE-OST LN were analyzed by flow cytometry using FOXP3 and CD25 expression, and their percentages were indicated by the number adjacent to outlined areas. Also shown on the right is the number of FOXP3+ Treg cells in WT, Carmil2QE, and Carmil2QE-OST LN (see key in A). (E) CD4+ Tconv cells found in the LN of WT, Carmil2QE, and Carmil2QE-OST mice (gated as in D) were analyzed by flow cytometry using CD44 and CD62L expression, and the percentages of naive (CD44loCD62Lhi) and effector-memory (CD44hiCD62Llo) cells were indicated by the number adjacent to outlined areas. Also shown on the right is the number of effector-memory CD4+ T cells in WT, Carmil2QE, and Carmil2QE-OST LN (see key in A). (F) CD8+ T cells found in the LN of WT, Carmil2QE, and Carmil2QE-OST mice (gated as in C) were analyzed by flow cytometry using CD44 and CD62L expression, and the percentages of naive (CD44loCD62Lhi) and central plus effector-memory (CD44hiCD62Llow to high) cells were indicated by the number adjacent to outlined areas. Also shown on the right is the number of central plus effector-memory CD8+ T cells in WT, Carmil2QE, and Carmil2QE-OST LN (see key in A). Data in A–D are representative of two independent experiments, with two mice per genotype.
Figure 9.
Figure 9.
Composition, dynamics, and stoichiometry of the CARMIL2 and CARMIL2 QE interactomes of primary mouse CD4 + T cells. (A) Plots showing the interaction stoichiometry (in log10 scale) of CARMIL2OST and CARMIL2QE-OST molecules with the CAPZB-, CD28-, CARD11-, and CK1-α–interacting proteins in CD4+ T cells before (NS = not stimulated) and after 2, 5, and 10 min of activation via pervanadate treatment. The CARMIL2QE-OST-CK1-α bait–prey interaction was the sole to show a temporal pattern of interaction stoichiometry similar to that of CARMIL2 QE-OST-CARD11. Data are representative of three independent experiments each involving three replicates (mean ± SEM; n = 9 for each time point). (B) Stoichiometry plots of the CARMIL2OST and CARMIL2 QE-OST interactome in CD4+ T cells prior to activation (NS) and after 2 min of activation (see Data S1). The CARMIL2OST (yellow dots) and CARMIL2QE-OST (orange dots) proteins (corresponding to the two “baits”), and the CD28 (green dots)-, CARD11 (pink dots)-, PKC-θ (purple dots)–, and CK1-α (blue dots)–interacting proteins (corresponding to select high-confidence “preys”) are highlighted, whereas the remaining high-confidence preys are shown as gray dots. For each of the bait–prey interactions, the ratio of prey to bait cellular abundance (abundance ratio in the log10 scale) was plotted as a function of the interaction stoichiometry of the considered bait–prey interaction (interaction stoichiometry in the log10 scale). As already noted in the case of the TCR signaling network (Voisinne et al., 2019), substoichiometric bait–prey interactions play a central role in the organization of the CARMIL2OST and CARMIL2QE-OST interactome. The two exceptions corresponded to the almost stoichiometric bait–prey interactions involving CARMIL2OST and CARMIL2QE-OST with CAPZB and CAPZA2 and to the maximal interaction stoichiometry reached after 2 min of activation by the CARMIL2QE-OST-CARD11 bait–prey interaction, a condition in which 12% of the available CARMILQE-OST molecules are complexed to CARD11. The area corresponding to bait–prey interaction involving >10% of the available prey molecules is indicated in light gray and includes CAPZA2 and CAPZB in all the analyzed conditions, and CARD11 in the case of the CARMIL2QE-OST interactome after 2 min of stimulation.
Figure 10.
Figure 10.
Model summarizing the mode of action of CARMIL2 and CARMIL2 QE molecules in T cells expressing or lacking CD28. (A) CARMIL2 molecules function as CD28-inducible scaffolds that recruit the CARD11 adaptor. All the CD28-inducible CARMIL2-CARD11 complexes that form in WT T cells are embedded within CD28-nucleated, high-order CARMIL2 signalosome. Phosphorylation of the CARMIL2-associated CARD11 molecules by TCR-activated protein serine/threonine kinases that include PKC-θ induces the formation of active CBM complexes that trigger downstream signaling events including the activation of the NF-κB transcription factor (see Fig. S4 and Bidère et al., 2009; Gehring et al., 2019; Kutzner et al., 2022; Liang et al., 2013; Park et al., 2013; Roncagalli et al., 2016; Schober et al., 2017). The tyrosine-based protein–protein interaction motifs (red circles) present in the CD28 intracytoplasmic tail are subjected to dephosphorylation by the SHP2 protein tyrosine phosphatase associated with the PD-1 coinhibitor (Celis-Gutierrez et al., 2019). The CD80 and CD86 ligands expressed at the surface of APC are also subjected to CTLA-4–mediated Treg cell transendocytosis (not shown). (B) Majority of the CARMIL2QE-CARD11 complexes found in activated Carmil2QE T cells lie outside of CD28-nucleated, high-order CARMIL2 signalosomes and are denoted as stand-alone CARMIL2QE-CARD11 complexes. The activity of these last complexes remains dependent on TCR inputs (blue arrow) and freed from PD-1 and CTLA-4 inhibition. (C) Stand-alone CARMIL2QE-CARD11 complexes are the sole to form in Carmil2QECd28−/− T cells. Following phosphorylation by TCR-operated serine/threonine kinases, they likely constitute the seed of the functional CBM complexes that mediate most of the functions attributed to CD28 in Carmil2QECd28−/− T cells. The activity of these stand-alone CARMIL2QE-CARD11 complexes remains dependent on TCR inputs (blue arrow) and freed from PD-1 and CTLA-4 inhibition. The interaction between CARMIL2QE and isoform CK1α shows a temporal profile of interaction stoichiometry similar to that of the CARMIL2QE-CARD11 interaction. Considering that CK1α is essential for CBM assembly and MALT1 phosphorylation (Bidère et al., 2009; Gehring et al., 2019), it suggests that the TCR-triggered activation signals received by the stand-alone CARMIL2QE-CARD11 complexes are mediated at least by CK1α.

References

    1. Agarwal, S., Aznar M.A., Rech A.J., Good C.R., Kuramitsu S., Da T., Gohil M., Chen L., Hong S.A., Ravikumar P., et al. 2023. Deletion of the inhibitory co-receptor CTLA-4 enhances and invigorates chimeric antigen receptor T cells. Immunity. 56:2388–2407.e9. 10.1016/j.immuni.2023.09.001 - DOI - PMC - PubMed
    1. Ardouin, L., Luche H., Chelbi R., Carpentier S., Shawket A., Montanana Sanchis F., Santa Maria C., Grenot P., Alexandre Y., Grégoire C., et al. 2016. Broad and largely concordant molecular changes characterize tolerogenic and immunogenic dendritic cell maturation in thymus and periphery. Immunity. 45:305–318. 10.1016/j.immuni.2016.07.019 - DOI - PubMed
    1. Ashby, K.M., and Hogquist K.A.. 2024. A guide to thymic selection of T cells. Nat. Rev. Immunol. 24:103–117. 10.1038/s41577-023-00911-8 - DOI - PubMed
    1. Barnden, M.J., Allison J., Heath W.R., and Carbone F.R.. 1998. Defective TCR expression in transgenic mice constructed using cDNA-based alpha- and beta-chain genes under the control of heterologous regulatory elements. Immunol. Cell Biol. 76:34–40. 10.1046/j.1440-1711.1998.00709.x - DOI - PubMed
    1. Bidère, N., Ngo V.N., Lee J., Collins C., Zheng L., Wan F., Davis R.E., Lenz G., Anderson D.E., Arnoult D., et al. 2009. Casein kinase 1alpha governs antigen-receptor-induced NF-kappaB activation and human lymphoma cell survival. Nature. 458:92–96. 10.1038/nature07613 - DOI - PMC - PubMed

MeSH terms

LinkOut - more resources