

A stochastic modelling framework for cancer patient trajectories: combining tumour growth, metastasis, and survival
- PMID: 40402308
- PMCID: PMC12098478
- DOI: 10.1007/s00285-025-02229-6
A stochastic modelling framework for cancer patient trajectories: combining tumour growth, metastasis, and survival
Abstract
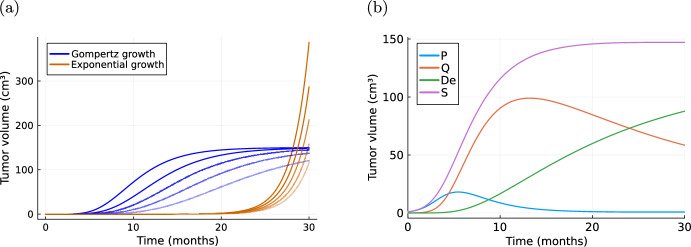
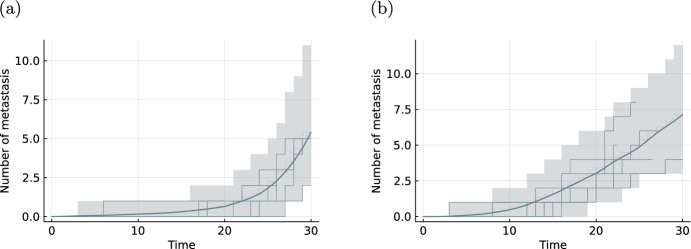
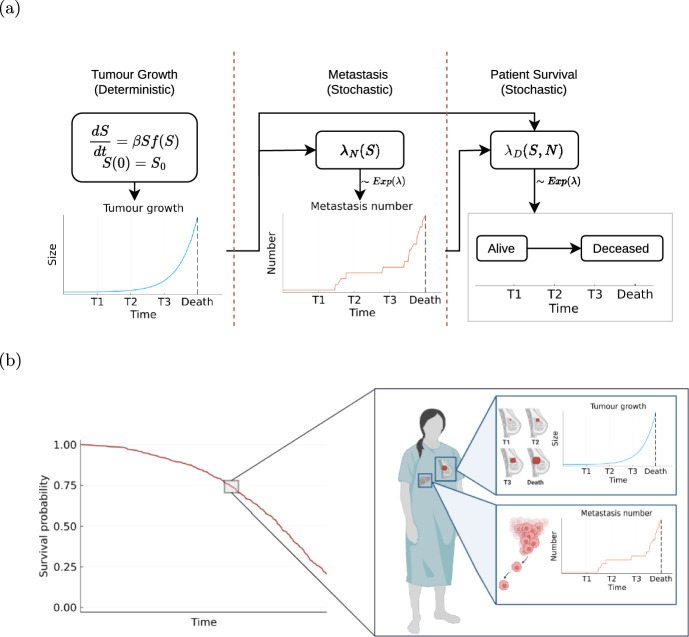
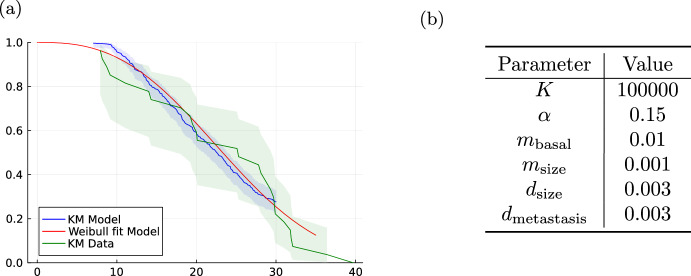
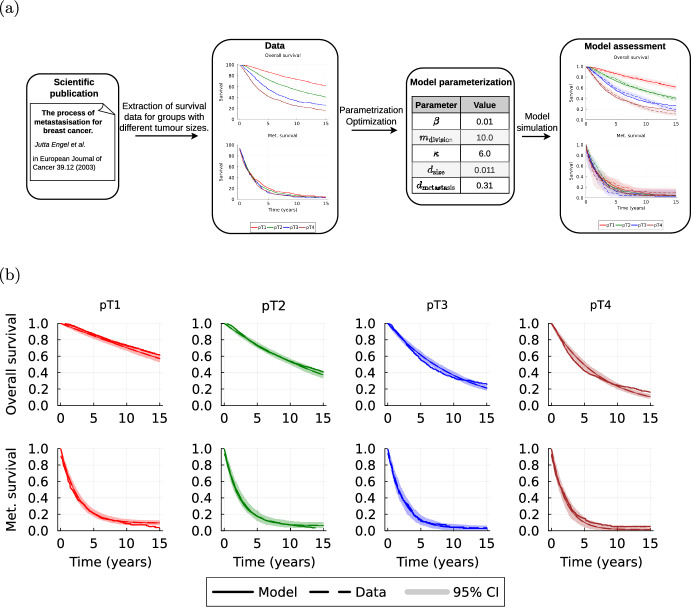
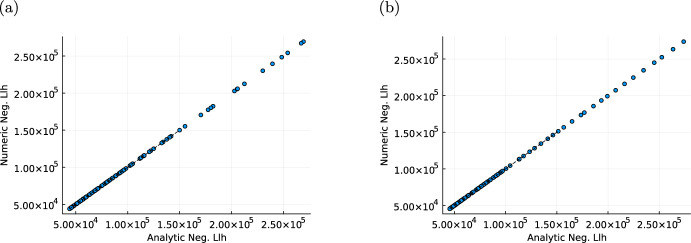
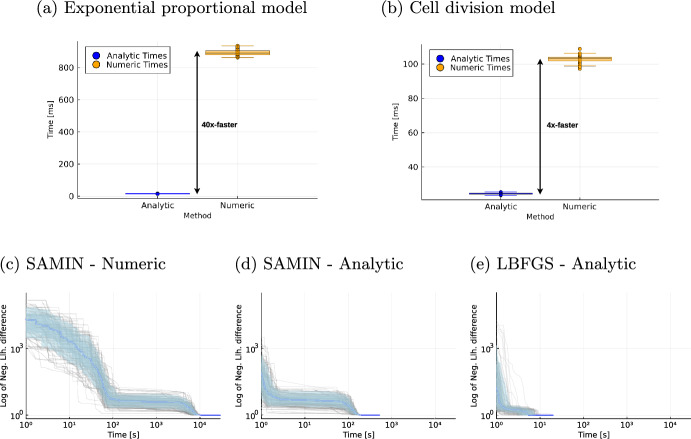
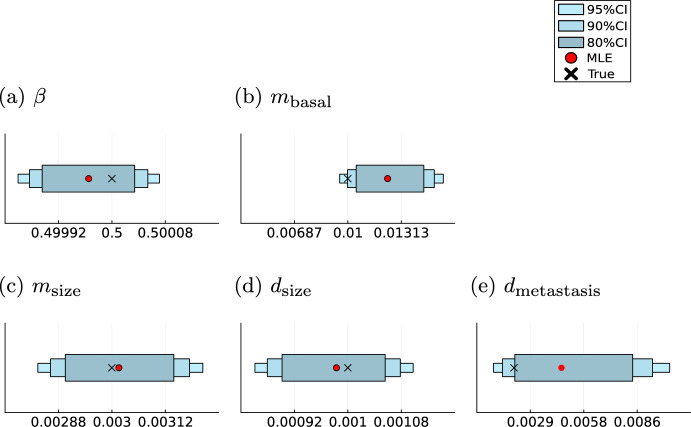
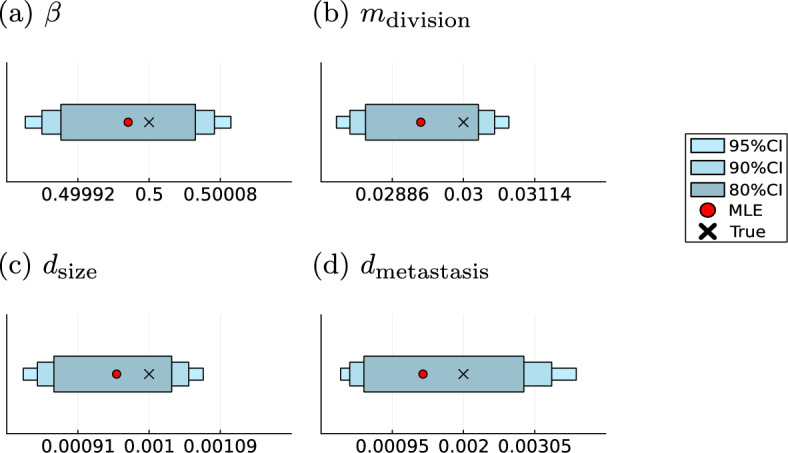
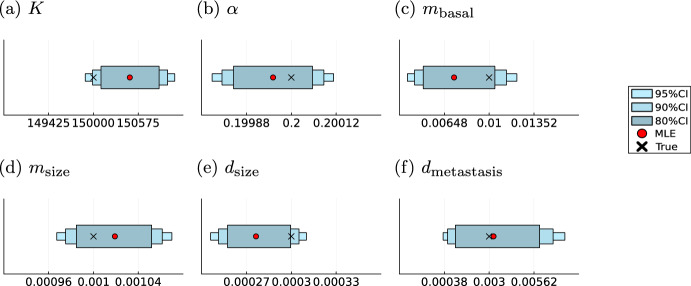
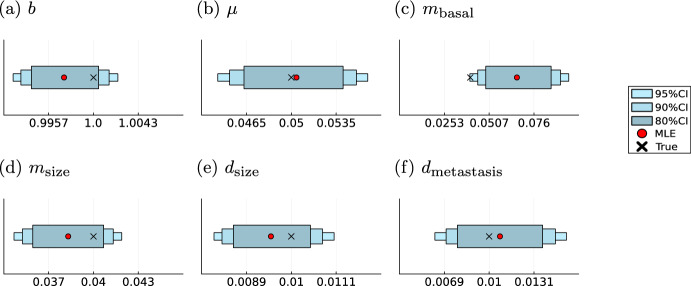
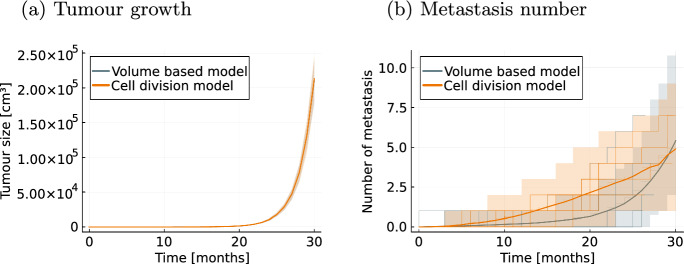
Cancer is a major burden of disease around the globe and one of the leading causes of premature death. The key to improve patient outcomes in modern clinical cancer research is to gain insights into dynamics underlying cancer evolution in order to facilitate the search for effective therapies. However, most cancer data analysis tools are designed for controlled trials and cannot leverage routine clinical data, which are available in far greater quantities. In addition, many cancer models focus on single disease processes in isolation, disregarding interaction. This work proposes a unified stochastic modelling framework for cancer progression that combines (stochastic) processes for tumour growth, metastatic seeding, and patient survival to provide a comprehensive understanding of cancer progression. In addition, our models aim to use non-equidistantly sampled data collected in clinical routine to analyse the whole patient trajectory over the course of the disease. The model formulation features closed-form expressions of the likelihood functions for parameter inference from clinical data. The efficacy of our model approach is demonstrated through a simulation study involving four exemplary models, which utilise both analytic and numerical likelihoods. The results of the simulation studies demonstrate the accuracy and computational efficiency of the analytic likelihood formulations. We found that estimation can retrieve the correct model parameters and reveal the underlying data dynamics, and that this modelling framework is flexible in choosing the precise parameterisation. This work can serve as a foundation for the development of combined stochastic models for guiding personalized therapies in oncology.
Keywords: Cancer modelling; Mathematical oncology; Stochastic modelling.
© 2025. The Author(s).
Conflict of interest statement
Declarations. Conflict of interest: All authors declare that they have no conflict of interest.
Figures
Similar articles
-
A Genuinely Hybrid, Multiscale 3D Cancer Invasion and Metastasis Modelling Framework.Bull Math Biol. 2024 Apr 25;86(6):64. doi: 10.1007/s11538-024-01286-0. Bull Math Biol. 2024. PMID: 38664343 Free PMC article.
-
Reliable and efficient parameter estimation using approximate continuum limit descriptions of stochastic models.J Theor Biol. 2022 Sep 21;549:111201. doi: 10.1016/j.jtbi.2022.111201. Epub 2022 Jun 22. J Theor Biol. 2022. PMID: 35752285
-
A stochastic model for cancer metastasis: branching stochastic process with settlement.Math Med Biol. 2020 May 29;37(2):153-182. doi: 10.1093/imammb/dqz009. Math Med Biol. 2020. PMID: 31162540
-
In silico modelling of tumour margin diffusion and infiltration: review of current status.Comput Math Methods Med. 2012;2012:672895. doi: 10.1155/2012/672895. Epub 2012 Jul 11. Comput Math Methods Med. 2012. PMID: 22919432 Free PMC article. Review.
-
Simulation-based estimation of stochastic process parameters in tumor growth.C R Biol. 2004 Mar;327(3):181-92. doi: 10.1016/j.crvi.2003.06.001. C R Biol. 2004. PMID: 15127889 Review.
References
-
- Abrahamsson L, Humphreys K (2016) A statistical model of breast cancer tumour growth with estimation of screening sensitivity as a function of mammographic density. Stat Methods Med Res 25(4):1620–1637. 10.1177/0962280213492843 - PubMed
-
- Abrahamsson L, Isheden G, Czene K, Humphreys K (2020) Continuous tumour growth models, lead time estimation and length bias in breast cancer screening studies. Stat Methods Med Res 29(2):374–395. 10.1177/0962280219832901 - PubMed
-
- Agresti A (2013) Categorical data analysis. Wiley, Hoboken
-
- Akaike H (1974) A new look at the statistical model identification. IEEE Trans Autom Control 19(6):716–723. 10.1109/TAC.1974.1100705
-
- Alzahrani E, Asiri A, El-Dessoky M, Kuang Y (2014) Quiescence as an explanation of Gompertzian tumor growth revisited. Math Biosci 254:76–82 - PubMed
MeSH terms
Grants and funding
LinkOut - more resources
Full Text Sources
Medical
