

Early-Life Factors and Body Mass Index Trajectories Among Children in the ECHO Cohort
- PMID: 40402497
- PMCID: PMC12100454
- DOI: 10.1001/jamanetworkopen.2025.11835
Early-Life Factors and Body Mass Index Trajectories Among Children in the ECHO Cohort
Abstract
Importance: Identifying atypical body mass index (BMI) trajectories in children and understanding associated, modifiable early-life factors may help prevent childhood obesity.
Objective: To characterize multiphase BMI trajectories in children and identify associated modifiable early-life factors.
Design, setting, and participants: This cohort study included longitudinal data obtained from January 1997 to June 2024, from the Environmental influences on Child Health Outcomes (ECHO) cohort, which included children aged 1 to 9 years with 4 or more weight and height assessments. Analyses were conducted from January to June 2024.
Exposures: Prenatal exposure to substances and stress (smoking, alcohol, depression, anxiety), maternal characteristics (prepregnancy BMI, gestational weight gain), child characteristics (preterm birth, birth weight, breastfeeding), and demographic covariates.
Main outcomes and measures: BMI (calculated as weight in kilograms divided by length in meters squared for children aged 1 and 2 years and as weight in kilograms divided by height in meters squared for children older than 2 years) obtained using medical records, staff measurements, caregiver reports, or remote study measures. The analysis was conducted using a multiphase latent growth mixture model.
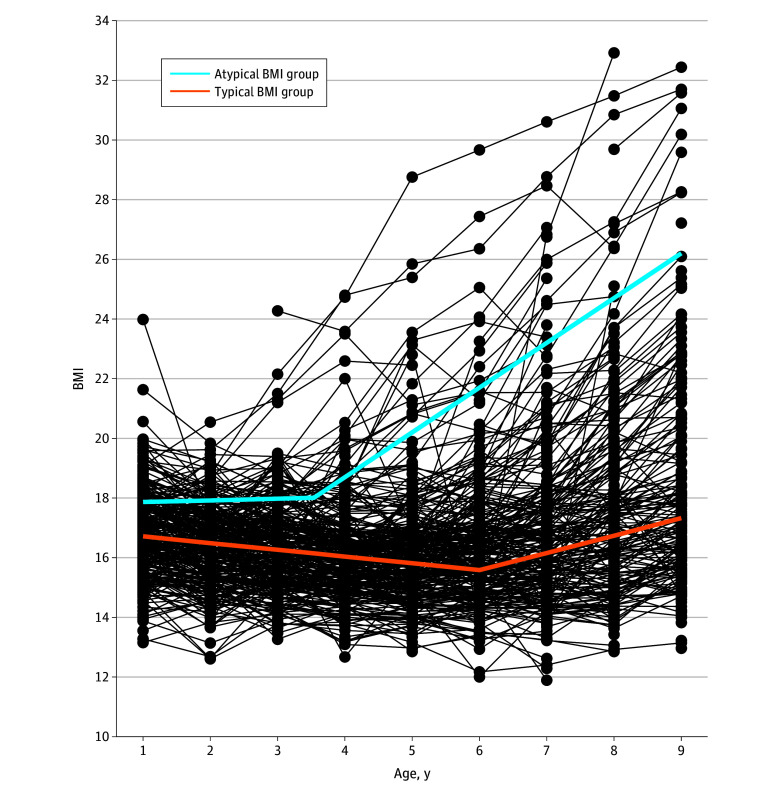
Results: This study included 9483 children (4925 boys [51.9%]). Two distinct 2-phase BMI patterns were identified: typical and atypical. The typical group (n = 8477 [89.4%]) showed linear decreases in BMI (b2, -0.23 [95% CI, -0.24 to -0.22]), with the lowest BMI at age 6 years (95% CI, 5.94-6.11), followed by linear increases from 6 to 9 years (slope difference [b4 - b2], 0.81 [95% CI, 0.76-0.86]; mean BMI at 9 years: 17.33). The atypical group (n = 1006 [10.6%]) showed a stable BMI from ages 1 to 3.5 years (b6, 0.06 [95% CI, -0.04 to 0.15]), followed by rapid linear increases from ages 3.5 to 9 years (slope difference [b8 - b6], 1.44 [95% CI, 1.34-1.55]). At age 9 years, this group reached a mean BMI (26.2) that exceeded the 99th percentile. Prenatal smoking, high prepregnancy BMI, high gestational weight gain, and high birth weight were key risk factors for the atypical trajectory.
Conclusions and relevance: In this cohort study of children in the ECHO cohort, analyses identified children on the path to obesity as early as age 3.5 years. Modifiable factors could be targeted for early prevention and intervention programs aimed at reducing childhood obesity.
Conflict of interest statement
Figures
References
-
- Kohli N, Harring JR, Hancock GR. Piecewise linear–linear latent growth mixture models with unknown knots. Educ Psychol Meas. 2013;73(6):935-955. doi: 10.1177/0013164413496812 - DOI
Publication types
MeSH terms
Grants and funding
- UH3 OD023349/OD/NIH HHS/United States
- UH3 OD023275/OD/NIH HHS/United States
- UH3 OD023249/OD/NIH HHS/United States
- UH3 OD023271/OD/NIH HHS/United States
- UH3 OD023279/OD/NIH HHS/United States
- UH3 OD023282/OD/NIH HHS/United States
- U2C OD023375/OD/NIH HHS/United States
- UH3 OD023289/OD/NIH HHS/United States
- UH3 OD023337/OD/NIH HHS/United States
- UG3 OD035516/OD/NIH HHS/United States
- R00 HD104991/HD/NICHD NIH HHS/United States
- UH3 OD023248/OD/NIH HHS/United States
- UL1 TR002014/TR/NCATS NIH HHS/United States
- UH3 OD023288/OD/NIH HHS/United States
- UH3 OD023287/OD/NIH HHS/United States
- UG3 OD035528/OD/NIH HHS/United States
- UH3 OD023389/OD/NIH HHS/United States
- UH3 OD035528/OD/NIH HHS/United States
- UH3 OD023320/OD/NIH HHS/United States
- UH3 OD023332/OD/NIH HHS/United States
- UG3 OD023305/OD/NIH HHS/United States
- P30 ES007033/ES/NIEHS NIH HHS/United States
- UH3 OD023318/OD/NIH HHS/United States
- UH3 OD023347/OD/NIH HHS/United States
- UH3 OD035516/OD/NIH HHS/United States
- UH3 OD023268/OD/NIH HHS/United States
- L40 HD109987/HD/NICHD NIH HHS/United States
- U24 OD023319/OD/NIH HHS/United States
- UH3 OD023313/OD/NIH HHS/United States
LinkOut - more resources
Full Text Sources
Medical
