. 2025 Jul 1;6(4):364-393.
doi: 10.1158/2643-3230.BCD-25-0099.

B-cell Receptor Silencing Reveals the Origin and Dependencies of High-Grade B-cell Lymphomas with MYC and BCL2 Rearrangements

Gabriele Varano #  1 Silvia Lonardi #  2 Paola Sindaco #  1 Ilaria Pietrini #  1 Gaia Morello  3 Piera Balzarini  2 Filippo Vit  4 Hadas Neuman  5 Giorgio Bertolazzi  6 Silvia Brambillasca  7 Nicara C Parr  1 Marco Chiarini  8 Silvia Bellesi  9 Elena Maiolo  9 Sabrina Giampaolo  1 Federica Mainoldi  1 Viveka Selvarasa  1 Hiroshi Arima  1 Vilma Pellegrini  2 Chiara Pagani  10 Mattia Bugatti  2 Cecilia Ranise  1 Tommaso M Taddei  1   11 Takashi Sonoki  12 Hajdica Thanasi  1   13 Elena Morlacchi  1 Daniel Segura-Garzon  1 Emma Albertini  2 Rosa Daffini  10 Anojan Sivacegaram  1 Henry Yang  14 Ying Li  14 Valeria Cancila  3 Giada Cicio  3   15 Michela Robusto  7 Brian Leuzzi  7 Adrian Andronache  7 Paolo Trifiro  7 Mirko Riboni  16 Simone P Minardi  16 Raoul J P Bonnal  1 Cristina Lopez Gonzalez  17 Euplio Visco  18   19 Pasquale Capaccio  20 Sara Torretta  20 Lorenzo Pignataro  20 Camillo Almici  21 Mario Varasi  7 Luigi M Larocca  22 Reiner Siebert  23 Brunangelo Falini  24 Andres J M Ferreri  19 Alessandra Tucci  10 Daniele Lorenzini  13   25 Antonello D Cabras  25 Giancarlo Pruneri  13   25 Arianna Di Napoli  26 Marco Ungari  27 Marco Pizzi  28 Stefan Hohaus  9   29 Ciro Mercurio  7 Joo Y Song  30 Wing C Chan  30 Luisa Lorenzi  2 Riccardo Bomben  4 Maurilio Ponzoni  18   19 Ramit Mehr  5 Claudio Tripodo #  3   13   15 Fabio Facchetti #  2 Stefano Casola #  1   31
Affiliations

B-cell Receptor Silencing Reveals the Origin and Dependencies of High-Grade B-cell Lymphomas with MYC and BCL2 Rearrangements

Gabriele Varano et al. Blood Cancer Discov. .

Abstract

The B-cell receptor (BCR) is critical for mature B-cell lymphomas (BCL), serving as a therapeutic target. We show that high-grade BCLs with MYC and BCL2 rearrangements [HGBCL-double-hit (DH)-BCL2] predominantly exhibit immunoglobulin heavy (IGH) chain silencing, leading to BCR shutdown. IGH-silenced HGBCL-DH-BCL2 (IGHUND) tumors differ from IGH+ counterparts in germinal center (GC) zone programs, MYC expression, and immune infiltrate. Whereas IGH+ HGBCL-DH-BCL2 tumors favor IGM/IG-κ expression, IGHUND counterparts complete IGH isotype switching and IG-λ rearrangements. IGHUND lymphomas retain productive IGHV rearrangements and require IGH for optimal fitness. BCR silencing, caused by accelerated IGH turnover and reduced IGH expression, precedes HGBCL-DH-BCL2 onset, inducing RAG1/2-dependent IG light chain editing and facilitating t(8;22)/IGL::MYC translocations. IGHUND HGBCL-DH-BCL2 models exhibit reduced sensitivity to the CD79B-targeting antibody-drug conjugate polatuzumab vedotin. Collectively, HGBCL-DH-BCL2 commonly arises from isotype-switched t(14;18)+ GC B cells, which edit IG light chains, fueling intraclonal diversification, BCR extinction, and t(8;22) while maintaining IGH dependence, with clinical implications.

Significance: These findings link BCR silencing in IGH isotype-switched t(14;18)+ GC B cells to RAG1/2 expression, which triggers IG light chain editing and predisposes to IGL::MYC translocations, promoting HGBCL. In HGBCL with MYC and BCL2 rearrangements, BCR silencing protects from polatuzumab vedotin killing. See related commentary by Shevchenko and Hodson, p. 284.


Conflict of interest statement

R. Siebert reports grants from the German Ministry of Science and Education (BMBF) during the conduct of the study and other support from AstraZeneca and Rhythm outside the submitted work. G. Pruneri reports grants from Novartis and personal fees from Lilly, Illumina, and Thermo Fisher Scientific outside the submitted work. S. Hohaus reports personal fees from Roche, BeiGene, Takeda, Incyte, Gilead, NovartisLilly, Abbvie, Bristol Myers Squibb outside the submitted work. No disclosures were reported by the other authors.

Figures
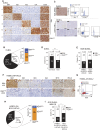
Figure 1.
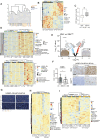
Figure 1.
IGH silencing in GCB DLBCL and HGBCL-DH-BCL2. A, Class-specific IGH IHC analysis of representative DLBCL cases (n = 258), including an IGHUND case (last row). CD20 expression and scattered IGH immunoreactivity from infiltrating plasma cells act as internal staining controls. B, Distribution of IGH+ and IGHUND lymphomas among consecutive DLBCL cases (n = 258). The IGHUND group includes a fraction of IGHUND/+ mixed lymphomas. Numbers inside bars indicate frequencies. C, IGH IHC matched to FACS measurements of surface IGK, IGL, and CD79B expression in representative IGH+ and IGHUND DLBCL (n = 30). Tumor B cells are labeled in blue. CD20 non-B cells (gray) act as negative controls. D, Frequencies of IGH+ and IGHUND cases among DLBCLs grouped for COO according to the Hans algorithm. Numbers above histograms refer to cases. E, Frequencies of IGH+ and IGHUND cases among HGBCL-DH-BCL2(-BCL6) and GCB DLBCL NOS cases. Number of cases is indicated above histograms. F, Class-specific IGH, MYC, and BCL2 IHC in representative IGH+ and IGHUND HGBCL-DH-BCL2 (n = 104) with rare infiltrating plasma cells acting as internal IGH staining control. G, Flow cytometric analysis for surface IGK and IGL expression in a case of IGHUND HGBCL-DH-BCL2. Percentage of gated tumor (red) and normal (blue) B cells are shown. H, Frequencies of IGH+ and IGHUND cases among HGBCL-DH-BCL2(-BCL6) in a cohort of n = 104 nonconsecutive cases. The IGHUND group includes a minor fraction of IGHUND/+ lymphomas (blue). I, Frequencies of IGH+ and IGHUND cases among GCB MB2 DE DLBCLs, grouped according to the presence (HGBCL-DH-BCL2) or absence (non-HGBCL-DH-BCL2) of BCL2 and MYC rearrangements. Number of cases is indicated above histograms. Scale bars, 20 μm (A), 100 μm (C), and 80 μm (F). Insets in (F) refers to sections photographed at low (top left, 3.8 and 7 mm scale bars in the IGH+ and IGHUND panels, respectively) and high (top right, 10 μm scale bar) magnification. P values (D and I) were determined by the Fisher exact test: **, P < 0.01; ***, P < 0.001.
Figure 2.
Figure 2.
IGH+ and IGHUND HGBCL-DH-BCL2 differ in GC zone programs and immune infiltrate. A, Unsupervised clustering of GCB MB2 DE DLBCL cases (n = 22) based on whole transcriptome data, excluding IGH transcripts. Case ID is listed at the bottom. Clustering mostly separates IGH+ (black; P = 0.0004) from IGHUND (red; P = 0.0170) tumors. IGHUND/+ cases (blue) clustered with the IGHUND group. B, Heatmap of differentially expressed genes (n = 953; log2 FC > 0.58: adjusted P < 0.05) between IGH+ and IGHUND MB2 DE DLBCLs after unsupervised clustering, defining the IGHUND MB2 signature. IGH and HGBCL-DH-BCL2 status are indicated above the heatmap. Z-score normalized expression values are shown. C, Boxplot of median MYC transcript levels (horizontal line) and 5th–95th percentile (whiskers) in GCB MB2 DE DLBCLs (n = 22) clustered according to IGH status. D, Unsupervised clustering of MB2 DE DLBCL cases for selected genes respectively up- (top map) and down-regulated (bottom map) in IGHUND compared with the IGH+ subset, grouped according to gene ontology. E, Volcano plot representation of differentially expressed genes (log2 FC > 0.58: adjusted P < 0.05) between ROIs (circles, n = 3) of IGHUND and IGH+ HGBCL-DH-BCL2. Top differentially expressed genes are shown. IGM (together with IGD/G/A not shown) IHC on serial sections served to assess IGH status. F, CD3 IHC analysis in representative IGH+ and IGHUND HGBCL-DH-BCL2(-BCL6). Histograms summarize the mean number of CD3+ cells/mm2 ± SD in IGH+ (n = 22) and IGHUND (n = 33) cases. Each circle represents a case. G, Multiplex IF analysis of FFPE sections of IGH+ and IGHUND HGBCL-DH-BCL2, stained for macrophages (CD68) and B (CD20), T (CD4 and CD8A), NK (CD57), and endothelial (CD31) cell markers. H, Unsupervised clustering of IGH+ and IGHUND MB2 DE DLBCL cases (n = 22) for spatially resolved GC DZ/LZ signatures. Heatmap identifies genes preferentially expressed in DZ (red) or LZ (green) regions. IGH and HGBCL-DH-BCL2(-BCL6) status is indicated above the heatmap. I, Unsupervised clustering of IGH+ and IGHUND MB2 DE DLBCL cases (n = 22) according to the DHIT/DZ molecular signature. Transcripts positively (red) and negatively (green) associated with the DHIT/DZ signature are indicated. P values were determined by unpaired t test with the Welch correction (C and F): *, P < 0.05. FC, fold change, norm, normal.
Figure 3.
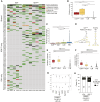
Figure 3.
Mutational signatures in IGH+ and IGHUND HGBCL-DH-BCL2(-BCL6). A, Nonsynonymous SNVs for selected genes in IGH+ and IGHUND HGBCL-DH-BCL2(-BCL6; n = 12). Colors indicate gene variant features. B, Total number of single-nucleotide substitutions in IGHV rearrangements of HGBCL-DH-BCL2 (-BCL6), PB, and rLN B cell clones, counted by IgTreeZ-MTree. C, Minimum root-to-leaf path corresponding to the minimum number of mutations per sequence in IGHV rearrangements of HGBCL-DH-BCL2, PB, and rLN B-cell clones, measured by IgTreeZ-MTree. D, Representative lineage tree of an IGHUND HGBCL-DH-BCL2 clone. Yellow filled nodes represent sampled sequences. Numbers on edges indicate numbers of mutations between nodes; edges without a number represent one mutation. A lineage tree from a healthy GC B-cell clone is included for comparison. E, Numbers of leaves per dominant clone for the indicated (IGHUND and IGH+) HGBCL-DH-BCL2 and control (iLN and PB) samples, counted by IgTreeZ-MTree. F, Average number of children per node for the indicated tumoral and control samples counted by IgTreeZ-MTree. G, Mean and confidence intervals of selection scores (Σ) for CDR and FRW regions of clonal IGHV rearrangements from HGBCL-DH-BCL2(-BCL6) cases (n = 20), antigen-selected PB B cells and rLN B cells from healthy donors, as calculated by BASELINe. Selection scores were also calculated for clonal rearrangements of HGBCL-DH-BCL2(-BCL6)-associated nonmalignant B cells (NmB). Nonproductive (Np) IGHV rearrangements from healthy GC-experienced B-cell clones were included in the analyses as nonselected controls. H, Stacked bar histogram representing frequency of IGH+ and IGHUND HGBCL-DH-BCL2(-BCL6) cases acquiring N-linked glycosylation motifs within clonal IGHV rearrangements. Numbers above histogram indicate cases. P values were determined by the Mann–Whitney U test with Benjamini–Hochberg correction for multiple comparisons (B, C, E, and F): *, P < 0.05; ***, P < 0.001; ns, not significant.
Figure 4.
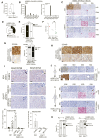
Figure 4.
IGH silencing is restricted to IGH-isotype switched HGBCL-DH-BCL2. A, Box plot representation of median and 5th–95th percentile (whiskers) of class-specific IGH constant region transcript levels in IGH+ (white, n = 4) and IGHUND HGBCL-DH-BCL2 (gray, n = 10), measured by RNA-seq. B, Most abundant class-specific IGH constant region gene transcript levels in representative IGH+ (left) and IGHUND (right) HGBCL-DH-BCL2, quantified by RNA-seq. C,In situ detection of class-specific IGH protein (IHC) and transcripts (RNA-scope) in representative IGH+ (top) and IGHUND (middle and bottom) HGBCL-DH-BCL2(-BCL6; n = 34). D, Frequency of HGBCL-DH-BCL2(-BCL6; n = 36) analyzed by RNA-scope and/or RNA-seq, divided according to IGH isotype choice. Central number refers to cases analyzed. E, Stacked histograms representing frequency of cases expressing IGHM or IGH-switched transcripts among IGH+ and IGHUND HGBCL-DH-BCL2(-BCL6; n = 36). F, Normalized IGHM GCN in representative IGH+ (n = 3; gray circles) and IGHUND (n = 8; green triangles) HGBCL-DH-BCL2(-BCL6), measured by genomic qPCR. A pool of FACS-sorted IGM+ circulating B cells (red circle) from n = 1 donor controlled for two IGHM gene copies. G, CD79B IHC in representative IGH+ and IGHUND HGBCL-DH-BCL2. Histograms summarize CD79B distribution scores in HGBCL-DH-BCL2(-BCL6; n = 49), discriminating intracellular (IC) from plasma membrane (M) immunoreactivity. H, Reduced CD79B protein levels in representative IGHUND HGBCL-DH-BCL2(-BCL6; n = 30, bottom) as compared with IGH+ (n = 19, top) counterparts, measured by IHC. I, IGG/CD79B (left) or IGG/CD79A (right) protein complexes in one IGG-switched IGH+ DLBCL (top) and in two IGHUND HGBCL-DH-BCL2(-BCL6; middle/bottom), measured by PLA. Insets represent sections photographed at high magnification. Histograms indicate mean frequency (±SEM) of PLA+ lymphoma cells in n = 5 independent fields of view (black circles). CD79B/IGG complexes quantified in GC DZ and LZ areas served as reference. J, IGH IHC (n = 17) and in situ RNA analyses (n = 16) for representative IGH+ (top) and IGHUND (middle/bottom) FL-HGBCL-DH-BCL2(-BCL6) metachronous specimens. K, Correspondence of IGH class choice between FL and metachronous/synchronous HGBCL-DH-BCL2(-BCL6) cases, assessed by IHC (left) and RNA-scope (right). Numbers above histograms refer to cases. Scale bars, 20 μm (C, H, and J), 10 μm (G), 100 μm (I), and 10 μm for all insets (I). P values were determined by an unpaired t test (A and F) or Fisher exact test (E and G): *, P < 0.05; **, P < 0.01; ***, P < 0.001; ****, P < 0.0001.
Figure 5.
Figure 5.
RAG1/2 involvement in IGHUND HGBCL-DH-BCL2 genesis. A, Evolutionary trajectory of three metachronous FL-HGBCL-DH-BCL2(-BCL6) pairs, reconstructed on the bases of shared and private IGHV amino acid substitutions. Acquired N-glycosylation motifs are labeled in red. B, Frequency of cases with IGH mono and biallelic locus disruption in IGH+ and IGHUND HGBCL-DH-BCL2(-BCL6; n = 22). C, Frequency of IGH::BCL2 (black bar) and IGH::MYC (blue bar) rearrangements in representative IGHUND HGBCL-DH-BCL2(-BCL6) with monoallelic or biallelic IGH disruption. Cases with non-IGH::MYC translocations are included (gray bars). Numbers below histograms refer to cases analyzed. D, IGH protein (IHC) and transcript (RNA) detection in IGHUND IGG-switched, FL (FL#1), and HGBCL-DH-BCL2-BCL6 (#245) metachronous specimens. In FL, IGHD transcripts mark the mantle zone, whereas tumor cells express IGHG and IGHA transcripts. The metachronous HGBCL-DH-BCL2-BCL6 becomes IGHG-restricted. E,In situ detection of RAG1/2 transcripts in HGBCL-DH-BCL2-BCL6 (#245) and in a representative control rLN (n = 4), measured by RNA-scope. Histogram bars indicate mean frequency (±SEM) of RAG1/2+ cells measured in n = 5 fields of view of HGBCL-DH-BCL2-BCL6 #245. F, Summary of RAG1/2 transcript analysis in IGH+ and IGHUND HGBCL-DH-BCL2 (n = 37), measured by RNA-scope. Tumors with >20% of RAG1/2-expressing cells were scored positive. G,IGK/LC transcripts captured by RNA scope in FFPE sections of representative IGH+ and IGHUND HGBCL-DH-BCL2. Histograms summarize frequencies of IGKC- (gray) and IGLC- (black) expressing cases (n = 40), among IGH+ and IGHUND HGBCL-DH-BCL2. Numbers above histograms refer to cases. Scale bars, 20 μm (D and H), 50 μm (E), and 10 μm within insets (E). P values determined by Fisher exact test (G): **, P < 0.01.
Figure 6.
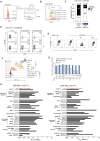
Figure 6.
IG light chain editing fuels BCR diversity and ultimate extinction in IGHUND HGBCL-DH-BCL2 models. A, Representative sIGK/L FACS analysis of IGHUND HGBCL-DH-BCL2 COH-DHL1 cells. Cell frequencies are indicated. B, Genomic PCR amplification of a segment of the IGKC gene (top) in COH-DHL1 cells, 293T cells, and PB mononuclear cells (PBMC). Amplification of the RPLP0 gene controlled for DNA input. Genomic PCR for the KDE rearrangement was performed on the same sample set (bottom). The asterisk refers to a nonspecific PCR amplification product serving as internal loading control. C, Longitudinal monitoring of IGM (IHC) and IGKC/LC (scale bar, 20 μm) and RAG1/2 (RNA-scope) expression (scale bar, 50 and 20 μm in the inset) in the HGBCL-DH-BCL2-BCL6 case from which the COH-THL1 cell line model was established, analyzed at diagnosis (#329A) and after relapse (#329B). D, Representative IGM/IGK/IGL FACS analysis of low-passage COH-THL1 cells before (left plot) and after (middle and right plots) gating on the indicated subsets. Numbers indicate cell frequencies. E, Representative (n = 5) sIGK/L FACS analysis of COH-THL1 bulk cultures before (left), at the time of sorting of IGHUND variants (middle) and after 2 weeks of in vitro culture (right) of the latter cells. Numbers indicate cell frequencies. F, Longitudinal tracking of sIGK/L expression of COH-THL1 cells profiled 2 weeks after consecutive rounds of FACS sorting for sBCRnull cells. Note the progressive erosion of sIGK/L+ cells at the expense of sIGK/Lnull cells. G, Normalized RAG1/2 transcript levels in IGHUND COH-DHL1 and COH-THL1 cells relative to 697 pre-B leukemia cells, measured by qRT-PCR. HEK293T cells were included as negative controls. H, Normalized RAG1/2 transcripts in FACS-purified IGH+ and IGHUND COH-THL1 cells, quantified by RT-PCR. I, Quantitative measurement of RAG1/2 transcripts in the indicated HGBCL-DH-BCL2(-BCL6) lymphoma lines, treated for 48 hours with the PI3Kδ/γ inhibitor duvelisib or FOXO1 inhibitor AS1842856. Transcripts are normalized to RPLP0 and represented as relative to the vehicle control set at 1 (dashed line). Data represent n = 6 (A and D) n = 5 (E), and n = 3 (B, G, and H) experiments.
Figure 7.
Figure 7.
IGH dependence and drug response of BCRnull HGBCL-DH-BCL2 models. A, IGG (intracellular) and CD79B protein levels in COH-DHL1 cells upon exposure to the indicated doses of bortezomib (BTZ), assessed by flow cytometric (left) or immunoblotting (right) analyses. Protein extracts were normalized for cell number. B, Surface IGG protein abundance in COH-DHL1 cells before (CTRL) and after complementation with the indicated IGK or IGL light chain expression vectors. Surface IGG levels (MFI) were measured on surface IGK+/L+ cells. C, Frequency of IGHG1 in-frame (IF) and out-of-frame (OF) CRISPR/Cas9-edited alleles amplified from genomic DNA or the productive VH-CH transcript (mRNA) of COH-DHL1 cells. Numbers above histogram bars refer to unique variant alleles. D, CD79B disruption in COH-DHL1 cells. Intracellular flow cytometric analysis for CD79B in COH-DHL1 cells before (CTRL) and after expression of representative gRNAs (n = 3) targeting CD79B. Cells were analyzed at day 14 (t1) and days 25–30 (t2) after puromycin selection. Numbers within dot plot refer to frequency of cells in the CD79B+ (top quadrant) and CD79BKO (bottom quadrant) gates. E, Cocultures of surface CD79B+ and CD79Blo/− COH-THL1 cells were treated for 72 hours with PV, unconjugated polatuzumab (Pola), or left untreated (−), and assessed by FACS. Data represent n = 3 experiments. Numbers indicate cell frequencies in the corresponding quadrants. F, Surface CD79B levels (MFI) quantified by flow cytometry in HGBCL-DH-BCL2 lines. IGH+ COH-THL1 cells were separated into three subsets according to IG light chain usage. DLBCL HT and Burkitt lymphoma RAMOS cells were included as negative and positive controls, respectively. G, Fraction of viable cells for the indicated HGBCL-DH-BCL2 (-BCL6) cell lines after 48 hours of treatment with PV (gray bars) or polatuzumab (blue bars). RAMOS and HT cell lines were included as positive and negative controls, respectively. Surface BCR (measured by IGK/L expression) and CD79B status for each line is indicated below the histogram plots. H, IC50 concentrations for the indicated drugs in IGHUND COH-DHL1 and COH-THL1 cell lines. Drugs were grouped according to the mechanism of action or target. The NAMPT-specific inhibitor OT-82 (labeled in red) showed 100% and 45% activity at the lowest dose (0.19 nmol/L) in COH-DHL1 and COH-THL1 cells, respectively. Data represent n = 3 (B, E, F, and G) or n = 2 (A) experiments. CTRL, control; MFI, mean fluorescence intensity.

References

    1. Otipoby KL, Waisman A, Derudder E, Srinivasan L, Franklin A, Rajewsky K. The B-cell antigen receptor integrates adaptive and innate immune signals. Proc Natl Acad Sci U S A 2015;112:12145–50. - PMC - PubMed
    1. Casola S, Perucho L, Tripodo C, Sindaco P, Ponzoni M, Facchetti F. The B-cell receptor in control of tumor B-cell fitness: biology and clinical relevance. Immunol Rev 2019;288:198–213. - PubMed
    1. Young RM, Phelan JD, Wilson WH, Staudt LM. Pathogenic B-cell receptor signaling in lymphoid malignancies: new insights to improve treatment. Immunol Rev 2019;291:190–213. - PMC - PubMed
    1. Havranek O, Xu J, Köhrer S, Wang Z, Becker L, Comer JM, et al. Tonic B-cell receptor signaling in diffuse large B-cell lymphoma. Blood 2017;130:995–1006. - PMC - PubMed
    1. Varano G, Raffel S, Sormani M, Zanardi F, Lonardi S, Zasada C, et al. The B-cell receptor controls fitness of MYC-driven lymphoma cells via GSK3β inhibition. Nature 2017;546:302–6. - PubMed

MeSH terms

Substances

Grants and funding