. 2025 May 22;23(5):e3003184.
doi: 10.1371/journal.pbio.3003184. eCollection 2025 May.

Landscape of essential growth and fluconazole-resistance genes in the human fungal pathogen Cryptococcus neoformans

Affiliations

Landscape of essential growth and fluconazole-resistance genes in the human fungal pathogen Cryptococcus neoformans

R Blake Billmyre et al. PLoS Biol. .

Abstract

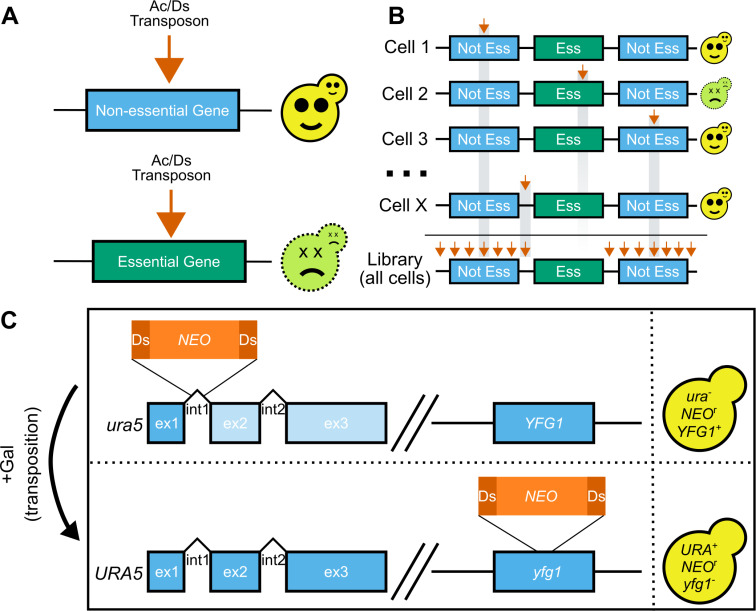
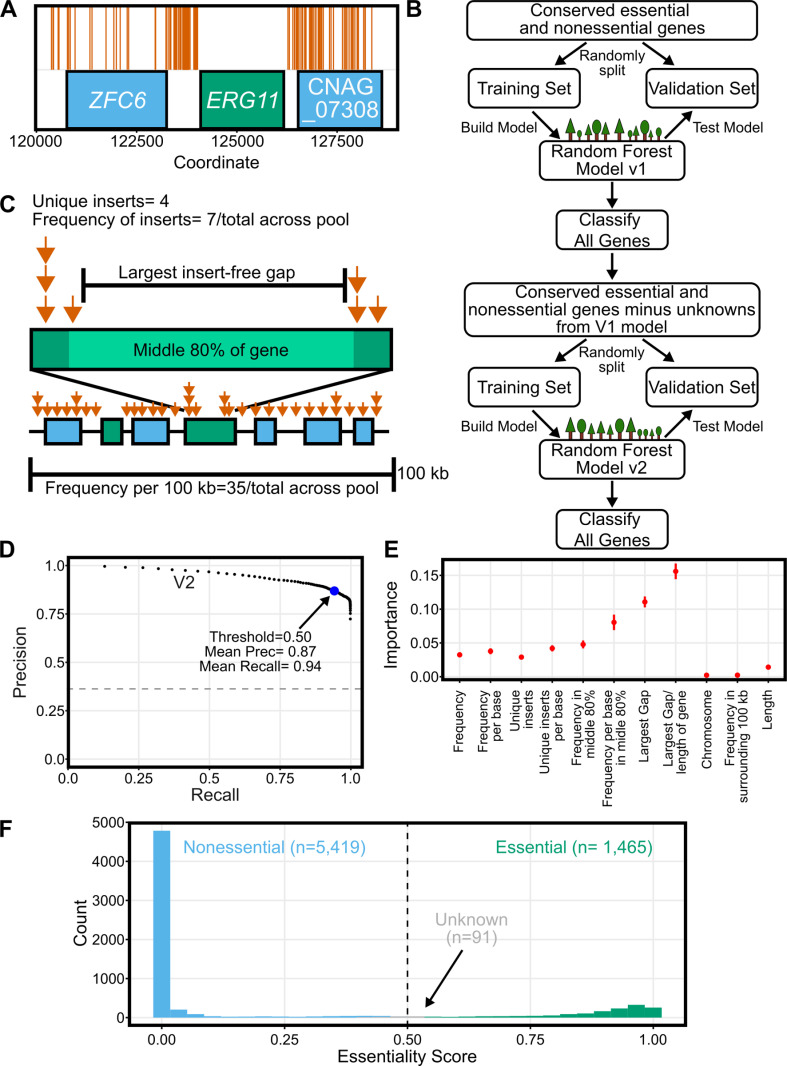
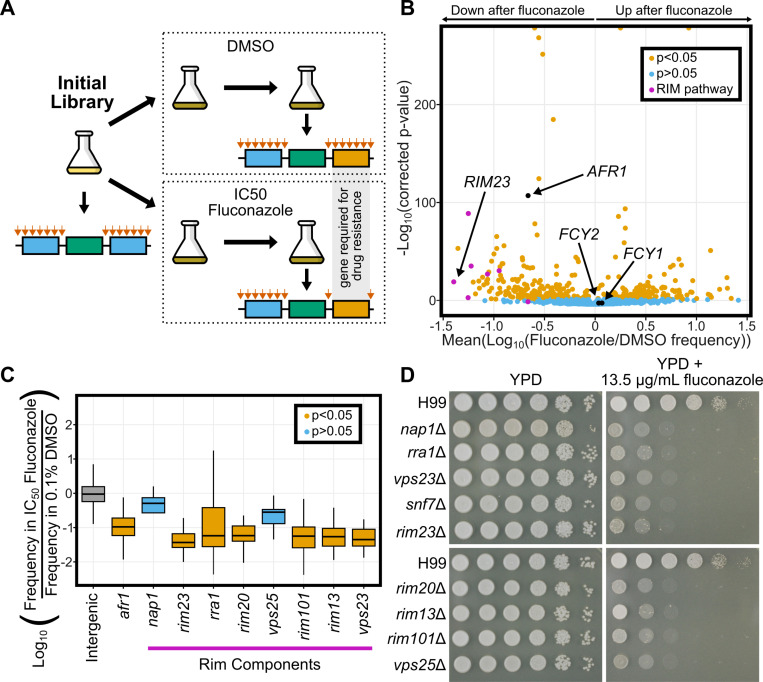
Fungi can cause devastating invasive infections, typically in immunocompromised patients. Treatment is complicated both by the evolutionary similarity between humans and fungi and by the frequent emergence of drug resistance. Studies in fungal pathogens have long been slowed by a lack of high-throughput tools and community resources that are common in model organisms. Here we demonstrate a high-throughput transposon mutagenesis and sequencing (TN-seq) system in Cryptococcus neoformans that enables genome-wide determination of gene essentiality. We employed a random forest machine learning approach to classify the C. neoformans genome as essential or nonessential, predicting 1,465 essential genes, including 302 that lack human orthologs. These genes are ideal targets for new antifungal drug development. TN-seq also enables genome-wide measurement of the fitness contribution of genes to phenotypes of interest. As proof of principle, we demonstrate the genome-wide contribution of genes to growth in fluconazole, a clinically used antifungal. We show a novel role for the well-studied RIM101 pathway in fluconazole susceptibility. We also show that insertions of transposons into the 5' upstream region can drive sensitization of essential genes, enabling screenlike assays of both essential and nonessential components of the genome. Using this approach, we demonstrate a role for mitochondrial function in fluconazole sensitivity, such that tuning down many essential mitochondrial genes via 5' insertions can drive resistance to fluconazole. Our assay system will be valuable in future studies of C. neoformans, particularly in examining the consequences of genotypic diversity.


Conflict of interest statement

The authors have declared that no competing interests exist.

Figures

Fig 1
Fig 1. TN-seq in C. neoformans.
(A) Transposon insertions (orange arrow) into nonessential genes results in viable cells. In contrast, insertions into essential genes will result in dead and nonrecoverable cells. (B) TN-seq works by generating a library of cells where each cell has a single independent transposon insertion in a random location. As in A, those insertions into essential regions cause the cells to die and are nonrecoverable. As a result, the total library (bottom) is depleted in insertions in essential regions. (C) The Ac/Ds transposon was split into an Ac transposase and a Ds transposon containing a neomycin resistance marker. This Ds transposon was integrated into an intron of URA5 and the Ac transposase was integrated into the safe haven locus. The resulting stain is ura− and neomycin resistant. Upon initiating transposition via growth on galactose, the strain becomes URA+ and mutant at another locus (depicted here as YFG1).
Fig 2
Fig 2. TN-seq enabled prediction of gene essentiality.
(A) 176 unique transposon insertions (orange vertical lines) are plotted along a region of Chromosome 1 centered on the known essential gene ERG11 and showing two flanking predicted nonessential genes. For nine of the displayed sites, we recovered transposon insertions in both orientations. (B) Flow chart depicting the random forest approach to classifying gene essentiality. (C) Schematic illustrating parameters that describe each gene within the TN-seq data for machine learning. (D) Precision recall curve describing tradeoff between precision and recall for the random forest model. Each point is the mean of 100 replicates where the training data was randomly split into training and validation sets. The threshold was then varied by 0.01 from 0.01 to 0.99 for each set. (E) The importance of each feature for the V2 model is plotted. Each importance value is also calculated from the same 100 replicates of the training data. Error bars indicate standard deviation. (F) Histogram of the essentiality prediction score for the entire gene set of C. neoformans based on the mean of 100 replicates. Data underlying A can be found in S1 Data at 10.5281/zenodo.15264486. Data underlying F can be found in S1 Table. Raw data underlying D–E can be found in corresponding excel sheets at 10.5281/zenodo.15264486.
Fig 3
Fig 3. Evolution and conservation of essentiality.
(A) Histogram of essentiality score as in Fig 2F, split by conservation status in humans. Genes without human orthologs are shown at top and those with human orthologs are shown below. (B) Genes with orthologs in S. cerevisiae, C. albicans, S. pombe and C. neoformans where the orthologs are essential in all three ascomycetes but predicted dispensable in C. neoformans. (C) Genes with orthologs in S. cerevisiae, C. albicans, S. pombe and C. neoformans where the orthologs are dispensable in all three ascomycetes but predicted essential in C. neoformans. Trees depicted in B–C are not inferred here but are based on the accepted relationship between these fungal groups [97]. Data underlying A can be found in S1 Table. Data underlying B–C can be found in S4 Table.
Fig 4
Fig 4. Using TN-seq to assay genetic contribution to fluconazole resistance.
(A) TN-seq libraries were selected with IC50 levels of fluconazole dissolved in DMSO or with just the equivalent amount of DMSO as a control. Libraries were sequenced at time 0 and after two days growth in DMSO or fluconazole to identify genes with differential transposon insertion frequencies after selection. (B) Volcano plot of 5296 genes with 5 or more insert sites (out of 6,975 C. neoformans genes) displaying the mean log10 (Fluconazole/DMSO) value on the x-axis and the −log10 (Bonferroni corrected p-value) on the y-axis. Individual genes are shaded orange if the distribution of inserts is statistically different from the distribution of inserts into noncoding regions (p < 0.05 via Mann–Whitney U test after Bonferroni correction). Genes that are not statistically different are shaded blue. (C) Boxplot displaying distribution of log10-adjusted fold changes in insert density (i.e., frequency in fluconazole/frequency in DMSO). Boxplots show first quartile, median, third quartile. The whiskers show the range to a maximum of 1.5 times the interquartile range above and below the first and third quartile, respectively. Outlier data points (outside the whiskers) are not displayed. Not displaying outliers results in 15,902 of 454,341 intergenic sites, 1 of 107 sites from afr1, 1 of 4 sites from nap1, 1 of 34 sites from rim23, 2 of 127 sites from rra1, 12 of 74 sites from rim20, 0 of 5 sites from vps25, 5 of 77 sites from rim101, 5 of 151 sites from rim 13, and 1 of 11 sites from vps23 not being displayed although those data were considered in the statistical analyses. Snf7 is not shown because there were 0 inserts between the start and stop codons. Inserts in intergenic regions are indicated in grey, genes where inserts were significantly depleted after fluconazole treatment are shown in orange (afr1, rim23, rra1, rim20, rim101, rim13, vps23) and genes where inserts were not significantly depleted after fluconazole are shown in blue (nap1 and vps25). Notably, both nap1 and vps25 had very low numbers of inserts that limited statistical power. (D) Spot dilution assays with 5 μL spots plated. The initial leftmost spot is of OD600 = 20 culture and each successive spot is a 10-fold dilution, so that the final spot should be 105 less concentrated than the first. Both plates were spotted on the same day with the same dilution series. All plates were imaged after 48 h at 30°C. Mutants were spotted on two separate plates for YPD and fluconazole media, each with a wildtype H99 control present. Data underlying B can be found in S1 Table. Data underlying C can be found in S1 Data at 10.5281/zenodo.15264486. Original images in panel D can be found in the Stowers Original Data Repository at http://www.stowers.org/research/publications/libpb-2480.
Fig 5
Fig 5. Regulatory inserts enable assays of essential gene function.
(A) Plot showing transposon insert frequencies in the region surrounding the ERG11 gene at either time zero or after two passages in IC50 levels of fluconazole in YPD. Shaded area shows the upstream region where inserts are less fit in fluconazole. (B) Boxplot displaying distribution of log10-adjusted fold changes in insert density (i.e., frequency in fluconazole/frequency in DMSO). Each column shows inserts only within a 300 base pair region either immediately upstream of the start codon or downstream of the stop codon. Boxplots show first quartile, median, third quartile. The whiskers show the range to a maximum of 1.5 times the interquartile range above and below the first and third quartile, respectively. Outliers are displayed as individual datapoints. (C) Spot dilution assays with 5 μL spots plated. The initial leftmost spot is of OD600 = 20 culture and each successive spot is a 10-fold dilution, so that the final spot should be 105 less concentrated than the first. Both plates were spotted on the same day with the same dilution series. YPD plates were imaged after 48 h at 30°C and fluconazole plates were imaged after 72 h at 30°C. (D) Schematic of model for 5′ transposon insertions. Wildtype cells (top row) should grow well on YPD and be moderately impaired (approximately 50%) by an IC50 level of fluconazole. Cells with a transposon insertion in the 5′ regulatory region of ERG11 should grow well on YPD but be highly sensitive to IC50 levels of fluconazole. (E) Volcano plot of 1,251 predicted essential genes with 5 or more insert sites in the 300 base pairs upstream of the start codon (out of 6,975 C. neoformans genes) displaying the mean log10 (Fluconazole/DMSO) value on the x-axis and the −log10 (Bonferroni corrected p-value) on the y-axis. Individual genes are shaded orange if the distribution of inserts is statistically different from the distribution of inserts into noncoding regions genome-wide (p < 0.05 via Mann–Whitney U test after Bonferroni correction). Genes that are not statistically different are shaded blue. (F) Spot dilution assays with 5 μL spots plated. The initial leftmost spot is of OD600 = 20 culture and each successive spot is a 10-fold dilution, so that the final spot should be 105 less concentrated than the first. All plates were spotted on the same day with the same dilution series. YPD and YNB plates were imaged after 48 h at 30°C and drug plates were imaged after 72 h at 30°C. Data underlying A and B can be found in S1 Data at 10.5281/zenodo.15264486. Data underlying E can be found in S1 Table. Original images in panels C and F can be found in the Stowers Original Data Repository at http://www.stowers.org/research/publications/libpb-2480.

Update of

References

    1. Denning DW. Global incidence and mortality of severe fungal disease. Lancet Infect Dis. 2024;24(7):e428–38. doi: 10.1016/S1473-3099(23)00692-8 . - DOI - PubMed
    1. Craw J, Beer L, Tie Y, Jaenicke T, Shouse R, Prejean J. Viral rebound among persons with diagnosed HIV who achieved viral suppression, United States. JAIDS J Acquir Immune Defic Syndr. 2020;84(2):133. - PMC - PubMed
    1. Roemer T, Krysan D. Antifungal drug development: challenges, unmet clinical needs, and new approaches. Cold Spring Harb Perspect Med. 2014;4(5):a019703. - PMC - PubMed
    1. Perfect JR. Cryptococcus neoformans: a sugar-coated killer with designer genes. FEMS Immunol Med Microbiol. 2005;45(3):395–404. doi: 10.1016/j.femsim.2005.06.005 . - DOI - PubMed
    1. Hagen F, Khayhan K, Theelen B, Kolecka A, Polacheck I, Sionov E. Recognition of seven species in the Cryptococcus gattii/Cryptococcus neoformans species complex. Fungal Genet Biol. 2015;78:16–48. - PubMed

MeSH terms

LinkOut - more resources