. 2025 May 22;20(5):e0323805.
doi: 10.1371/journal.pone.0323805. eCollection 2025.

Fidelity to territory and mate and the causes and consequences of breeding dispersal in American goshawk (Astur atricapillus)

Affiliations

Fidelity to territory and mate and the causes and consequences of breeding dispersal in American goshawk (Astur atricapillus)

Richard T Reynolds et al. PLoS One. .

Abstract

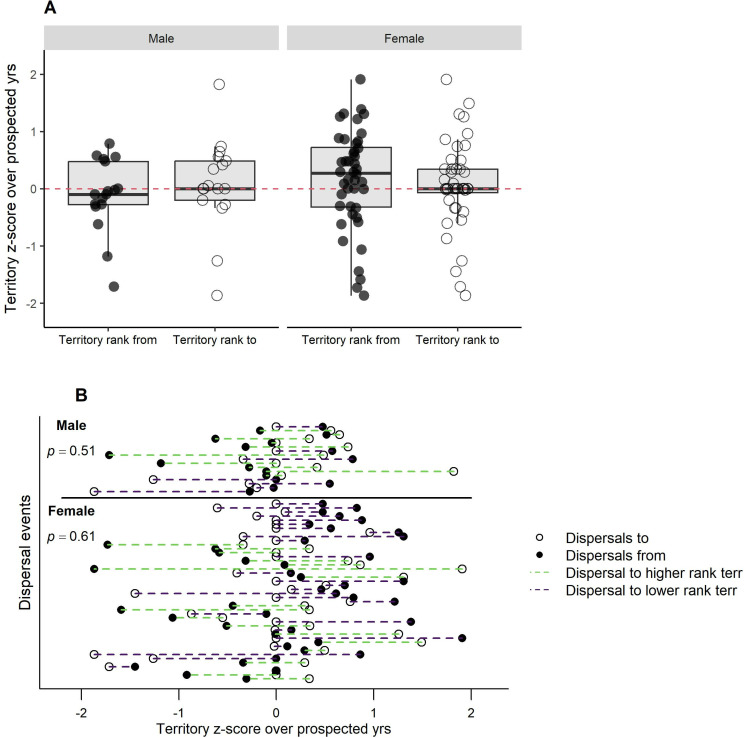
Using mark-resight data, we investigated fidelity to territory and mate as well as breeding dispersal rates and the causes and consequences of breeding dispersal in a 20-year study of American goshawks (Astur atricapillus) in Arizona, USA. Generalized Additive Mixed Models were used to identify the relative contributions of four prominent explanatory variables (eggs laid, nest failed, nest successful, mate loss) and 21 individual and environmental variables in a machine learning Conditional Inference Forest to predict breeding dispersal. Ninety-five percent of males and 92% of females exhibited lifetime territory fidelity and 97% exhibited lifetime mate fidelity. Mate loss alone (to divorce, possible emigration or death) made the biggest difference in the predicted probability of dispersal (0.11 with mate loss, 0.005 with mate retention). Yet, in 80% of mate losses a hawk stayed on its territory to eventually nest with a new mate. Territory fidelity was highest when the mate was retained in the next breeding and the pair's previous attempt produced fledglings. All males and 86% of females that dispersed to a territory in our study area moved no farther than to a 3rd-order neighboring territory (crossed 2 territories). Despite equivocal evidence of dispersal to territories more frequently occupied by egg-layers, there was otherwise little evidence that hawks on average dispersed to better territories. On average reproduction did not improve post-dispersal and dispersers did not move to territories with greater total (all monitored yrs) reproduction. Goshawks losing their mates appeared to use a home-based mate searching that minimized loss of a familiar territory by waiting on their territory for a new mate and prospecting nearby territories for unpaired mates. The small sample of nearby prospected territories, combined with fortuitous occurrences of unpaired mates, resulted in random (with respect to quality) selections of territories by dispersers.


Conflict of interest statement

The authors have declared that no competing interests exist.

Figures

Fig 1
Fig 1. The Kaibab Plateau study area encompassing goshawk breeding territories in northern Arizona, USA.
The 1,728-km2 study area included the entirety of the Kaibab Plateau above 2,182 m above sea level. The southern one-third of the study area included the Grand Canyon National Park-North Rim, and the northern two-thirds included the North Kaibab Ranger District of the Kaibab National Forest. Displayed are the numbered centroids (see Methods) of 125 American goshawk breeding territories, natural meadows, and the location and year of high-severity fires. Territory numbers in the figure correspond to territory numbers displayed in S1 Fig S1 Appendix. Map outline derived from Landsat 5 Thematic Mapper imagery courtesy of the U.S. Geological Survey, and the photo image provided courtesy of NASA/GSFC/LaRC/JPL, 12/31/2000 (photo image taken before the 2006 Warm Fire).
Fig 2
Fig 2. Frequency and distance of breeding dispersals made by male and female goshawks in Arizona, USA.
All male and 62% of female dispersals moved no further than to a 3rd-order neighboring territory (i.e., crossed two territories); maximum female dispersal was 51.2 km on the Kaibab Plateau, Arizona, USA, 1991-2010.
Fig 3
Fig 3. Probability of goshawk breeding dispersal given sex, prior nesting outcome, and mate retention in Arizona, USA.
Dispersal probabilities with 95% confidence intervals (bracketed lines) within combinations of sex, outcome of the prior nest attempt (no eggs laid; eggs laid but nest failed; fledgling produced), and mate retention or loss (retention in green and loss in purple) by goshawks on the Kaibab Plateau, Arizona, USA, 1991-2010. Points show individual predictions (fitted values) while predicted means are denoted by “X.”.
Fig 4
Fig 4. Probability of goshawk breeding dispersal given sex, territory familiarity, prior nesting outcome, and mate retention.
Means and 95% confidence bands of predicted probabilities of breeding dispersal across years of a goshawk’s familiarity with its territory given combinations of sex, outcome of the prior nest attempt (no eggs laid; eggs laid but nest failed; fledgling produced), and mate retention (dashed line) or loss (solid line) on the Kaibab Plateau, Arizona, USA, 1991-2010. Sample sizes of dispersals (top line) and non-dispersals (bottom line) are depicted by point size and colored by mate retention or mate loss.
Fig 5
Fig 5. Conditional Inference Forest importance of 21 variables for predicting goshawk breeding dispersal in Arizona, USA.
Permutation-based area under the curve (AUC) from conditional inference forest (CIF) of the importance of 21 individual and environmental variables for predicting breeding dispersal by 13 male (A) and 13 female (B) American goshawks on the Kaibab Plateau, Arizona, USA, 1991-2010. Length of bars show the relative importance of each variable measured by the difference in predictive accuracy of the model using the permuted values versus the original values. Variable descriptions are in Table 1.
Fig 6
Fig 6. Did dispersing goshawks move to more frequently occupied territories in Arizona, USA?
(A) Box plots of the proportional years of territory occupancy (yrs occupied/yrs territory monitored) by egg-laying pairs in territories from which hawks (n = 61) dispersed from vs. to. (B) Display of changes in the total (all monitored yrs) proportional years of occupancy of an original vs. new territory by individual dispersal events on the Kaibab Plateau, Arizona, USA, 1991-2010.
Fig 7
Fig 7. Did dispersed goshawks improve their post-dispersal reproduction in their new territories in Arizona, USA?
(A) Box plots of mean annual z-scores of fledgling production by dispersed hawks in their original territories vs. their new territories. (B) Display of changes in mean annual z-scores of fledgling production in an original vs. new territory by individual dispersal events on the Kaibab Plateau, Arizona, USA, 1991-2010.
Fig 8
Fig 8. Did dispersed goshawks settle in territories with greater (all monitored years) reproduction in Arizona, USA?
(A) Box plots of differences in the mean z-scores of annual fledgling production by the complete (all monitored yrs) ensemble of breeders in territories which male and female goshawks dispersed from and to. Red horizontal line indicates equal quality rankings (z-scores) of original and new territory. Positive values show higher productivity in the new vs. old territory and negative values show lower productivity in the new territory. (B) Display of changes in mean z-scores of annual fledgling production by individual goshawks that dispersed to new territories on the Kaibab Plateau, Arizona, USA, 1991-2010.
Fig 9
Fig 9. Did dispersed goshawks settle in territories with hawks that out-produced them during the disperser’s pre-dispersal years?
Fledgling production by dispersers in their original territories during the years when they could via territory intrusions monitor the nesting success in neighboring territories prior to their dispersal. (A) Differences (new ‒ old territory) in mean annual z-scores of fledgling production in an original vs. new territory where z-scores were averaged across those years when a prospective disperser could have monitored the reproduction of a breeder(s) in the new territory prior to their dispersal. Red horizontal line indicates no difference (i.e., equal quality rankings of original and new territory or mate), positive values show higher productivity and negative values depict lower productivity. (B) Display of differences in mean annual territory z-scores of fledgling production for individual dispersal events across prospecting years in original territories (closed black circles) and new territories (open circles).

References

    1. Hansson L. Dispersal and connectivity in metapopulations. Metapopulation Dynamics: Empirical and Theoretical Investigations. Elsevier. 1991;89–103. doi: 10.1016/b978-0-12-284120-0.50009-7 - DOI
    1. Brawn JD, Robinson SK. Source‐Sink Population Dynamics may Complicate the Interpretation of Long‐ Term Census Data. Ecology. 1996;77(1):3–12. doi: 10.2307/2265649 - DOI
    1. Hengeveld R. Small-step invasion research. Trends Ecol Evol. 1994;9(9):339–42. doi: 10.1016/0169-5347(94)90155-4 - DOI - PubMed
    1. Ibrahim KM, Nichols RA, Hewitt GM. Spatial patterns of genetic variation generated by different forms of dispersal during range expansion. Heredity. 1996;77(3):282–91. doi: 10.1038/hdy.1996.142 - DOI
    1. McLaughlin JF, Roughgarden J. Predation across spatial scales in heterogeneous environments. Theoretical Population Biology. 1992;41(3):277–99. doi: 10.1016/0040-5809(92)90030-w - DOI

LinkOut - more resources