. 2025 Jul 1;37(7):koaf127.
doi: 10.1093/plcell/koaf127.

Cyanoglobule lipid droplets are a stress-responsive metabolic compartment of cyanobacteria and the progenitor of plant plastoglobules

Affiliations

Cyanoglobule lipid droplets are a stress-responsive metabolic compartment of cyanobacteria and the progenitor of plant plastoglobules

Febri A Susanto et al. Plant Cell. .

Abstract

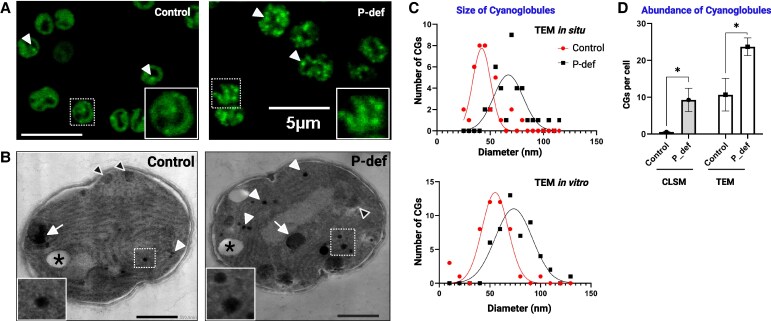
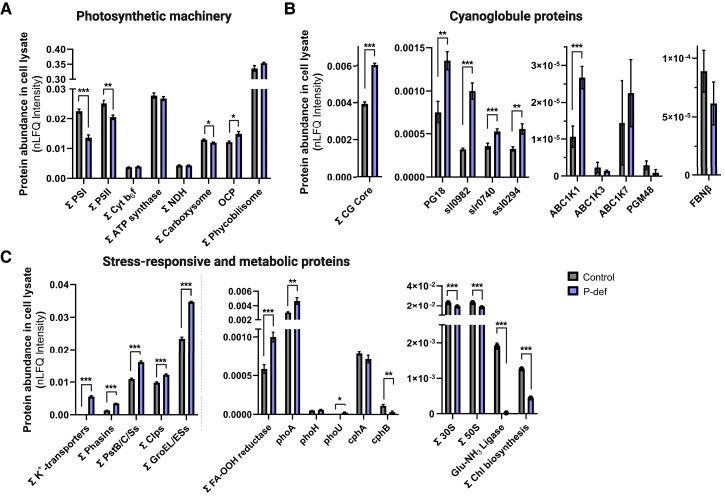
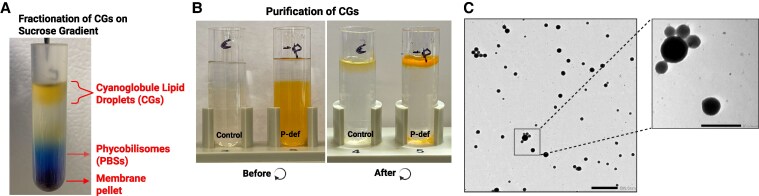
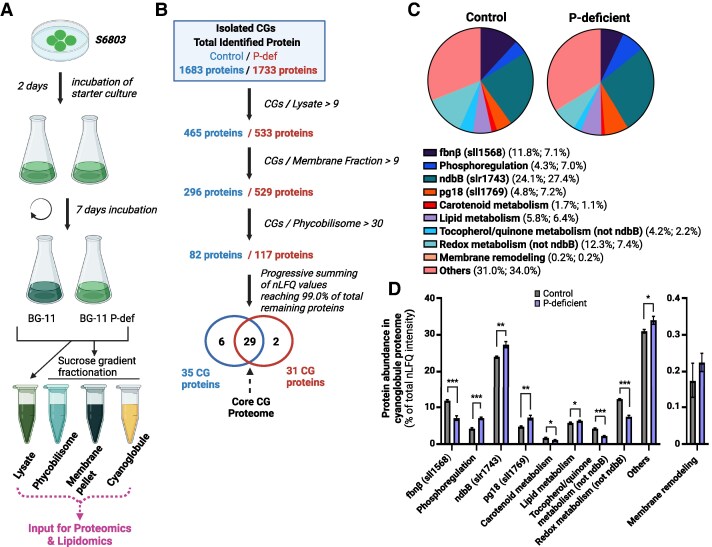
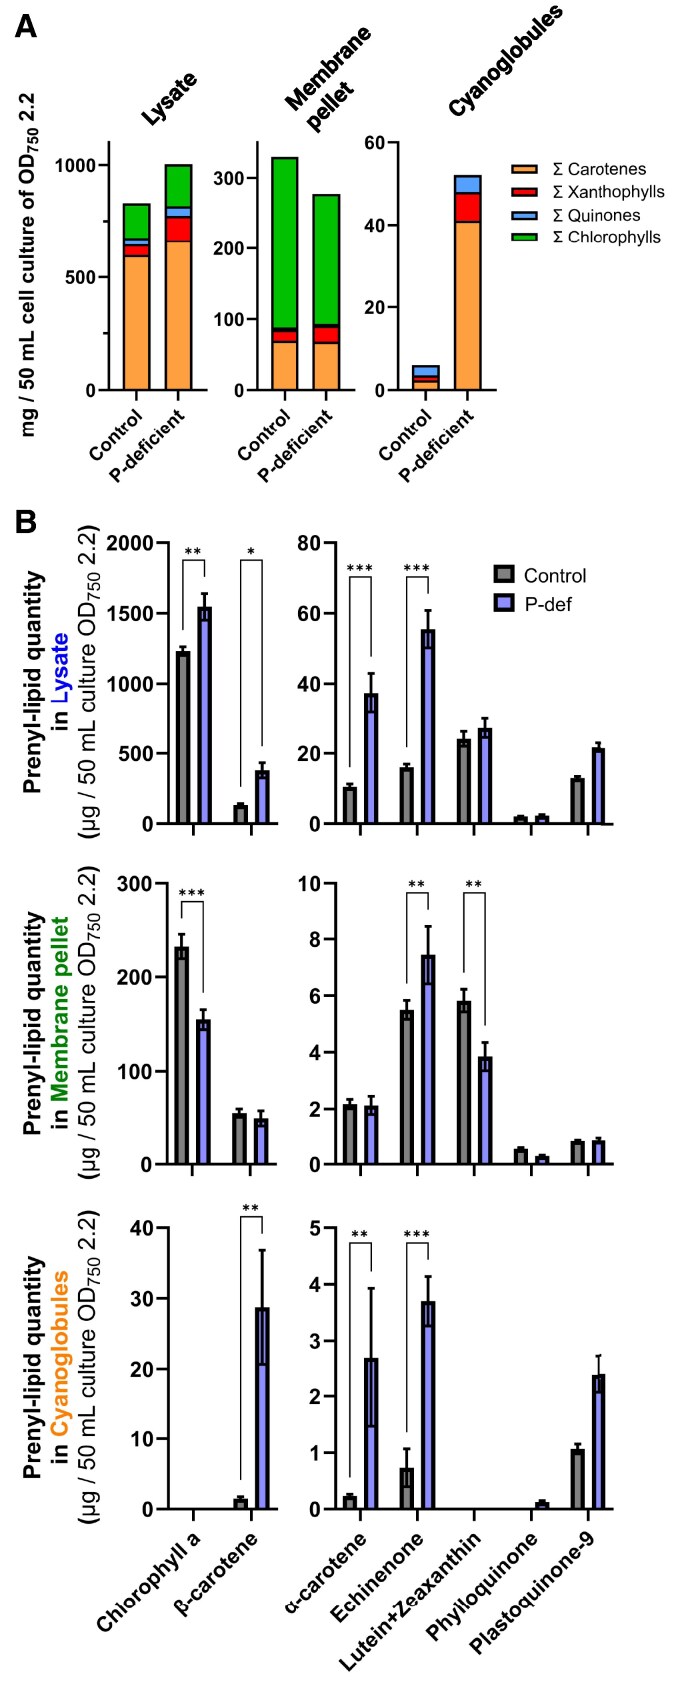
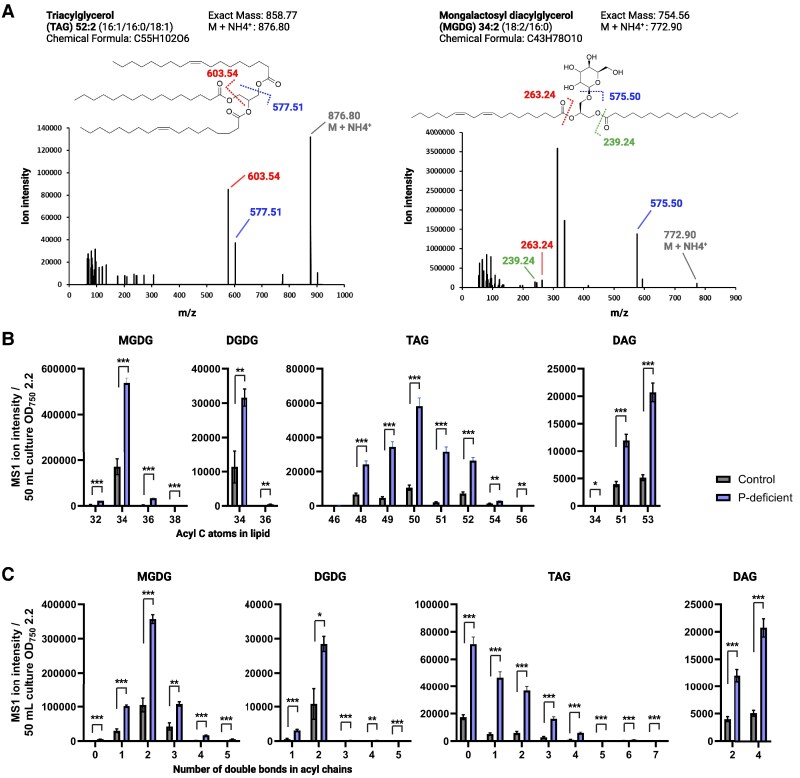
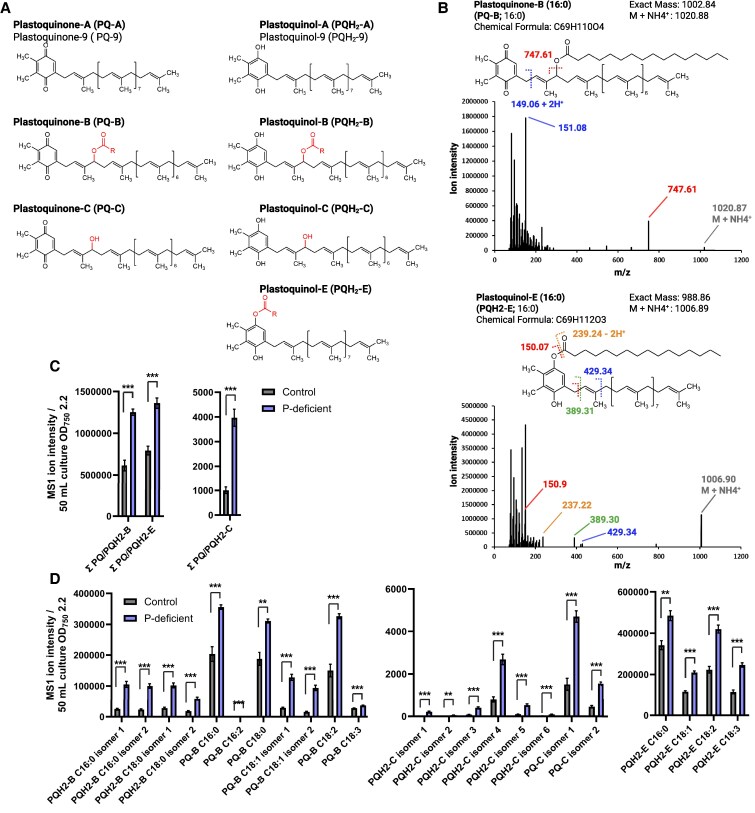
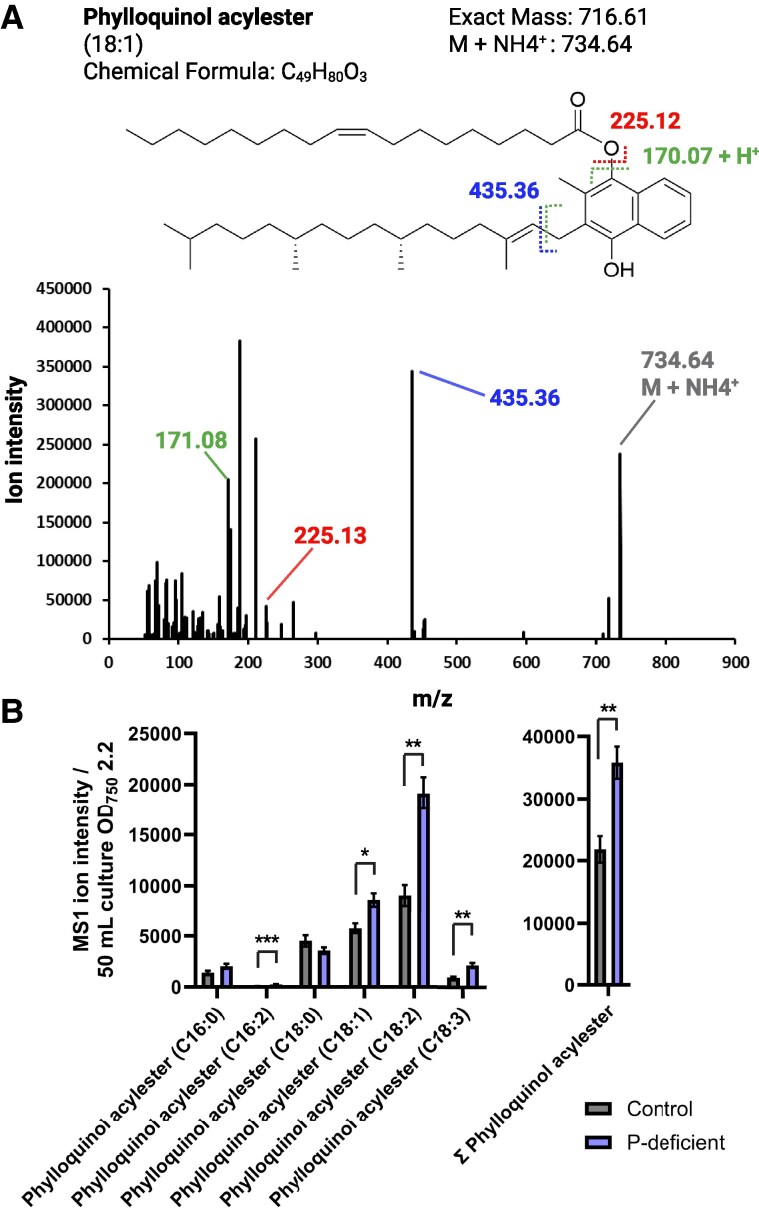
Lipid droplets (LDs) are well integrated into multiple facets of cellular physiology and potentially represent an effective platform for engineering heterologous metabolic pathways. LDs of chloroplasts, known as plastoglobules, mediate stress tolerance through dynamic and reversible changes to morphology and molecular composition. However, the dynamics and functional role(s) of cyanobacterial LDs are almost wholly unknown. Here, we have characterized the morphological behavior and quantitative proteome and lipidome of cyanobacterial LDs of Synechocystis sp. PCC 6803 grown under permissive or phosphorous-deficient media for 7 d. Our results show that cyanobacterial LDs are a metabolically active subcompartment of cyanobacteria with dynamic morphology and composition. The cyanobacterial LD proteome and lipidome are qualitatively similar to those of plant plastoglobules including an enrichment of prenyl lipids and the presence of twelve orthologs of Arabidopsis thaliana plastoglobule proteins. In view of these results, we propose that cyanobacterial LDs be named as cyanoglobules. In addition, we established that various plastoquinone derivatives containing hydroxyl and/or acyl groups on their solanesyl tail or quinone head accumulate in cyanoglobules. Deletion mutants of selected cyanoglobule proteins exhibit impairments in growth, pigmentation, and photosynthesis. Our results collectively support an evolutionary relationship between cyanoglobules and plastoglobules and reveal a possible central role for cyanoglobules in organismal physiology and stress adaptation.


Conflict of interest statement

Conflict of interest statement. None declared.

Figures

Figure 1.
Figure 1.
Effects of P deficiency on cell morphological features of Synechocystis sp. PCC 6803. Increased size and abundance of CG LDs under P-deficient growth is demonstrated by TEM and CLSM. A) CLSM images of cells grown for 7 d under P-replete (control) or P-deficient (P-def) media. Cells were stained with the lipophilic fluorescent dye, monodansylpentane, to visualize LDs. White arrowheads point out selected putative LDs indicated by the concentrated fluorescent intensity. Scale bars indicate a length of 500 nm. Insets are of higher zoom images of the portions boxed by white dashed lines. B) TEMs of cells grown for 7 d under P-replete (control) or P-deficient (P-def) media. White arrowheads point out selected osmiophilic lipid bodies, which we name CGs; black arrowheads, selected carboxysomes; black asterisks, selected PHA bodies; and white arrows, selected cyanophycin granules. Scale bars indicate a length of 500 nm. Insets are of higher zoom images of the portions boxed by white dashed lines. C) Quantification of CG size (cross-sectional diameter in nm) measured from TEMs of intact cells (in situ) or isolated by sucrose density centrifugation (in vitro). D) Quantification of CG abundance on a per-cell basis, measured from CLSM or TEM images of cells grown for 7 d under control or P-deficient conditions. Data were obtained from 50 independent micrographs. Statistical significance was determined by homoscedastic, Student's t-test; n = 50 independent cells, *P < 0.05.
Figure 2.
Figure 2.
Comparative protein abundances from the whole-cell lysate of the Synechocystis sp. PCC 6803 proteome grown under P-replete or P-deficient media for 7 d. A) Protein abundances of photosynthetic complexes are compared between the growth conditions, highlighting effects due to P deficiency. Protein subunits of each complex are indicated with a “Σ.” B) Protein abundances of the 29 proteins of the CG core proteome as identified in the main text, and selected individual proteins of the core proteome are compared between the growth conditions, highlighting effects due to P deficiency. C) Abundances of selected stress-related, metabolic, and protein chaperone/turnover proteins compared between the growth conditions, highlighting effects due to P deficiency. Protein members of each functional grouping are indicated with a “Σ.” Mean ± 1 SEM. Statistical significance was determined by homoscedastic 2-tailed Student's t-test; n = 4 biological replicates (i.e. independently grown cultures), *P < 0.05, **P < 0.01, ***P < 0.001. The full list of gene accessions corresponding to each functional group is provided in Supplementary Table S2-2. OCP, orange carotenoid protein.
Figure 3.
Figure 3.
Isolation of CGs, phycobilisomes, and the membrane pellet fraction of Synechocystis sp. PCC 6803 by sucrose density centrifugation. A) Whole-cell lysate in 250 mm sucrose was overlaid with a layer of buffer lacking sucrose. Following ultracentrifugation, CGs float to the top of the gradient, phycobilisomes settle at the 250/0 mm sucrose interface, and membranes and other high-density material pellets at the bottom. B) After isolating the top (i.e. CGs) layer from the fractionation, CGs are overlaid with a sucrose cushion for further purification and harvested from the resulting floating pad. C) TEMs of isolated CGs indicate their high purity and osmiophilic nature, consistent with their identity as the osmiophilic globules observed in in situ TEM images. The absence of larger, less osmiophilic material indicates the absence of polyhydroxy alkanoate (PHA) bodies in these isolations. The scale bar in the main micrograph represents 500 nm; the scale bar in the inset (magnified image) represents 200 nm.
Figure 4.
Figure 4.
Determination of the quantitative CG proteome and its dynamics under P deficiency. A) Cartoon of the cyanobacterial growth and isolation steps leading to the recovery of the different fractions. B) Filtering workflow to identify bona fide CG proteins. The workflow relies on comparison of protein abundances (nLFQ) in the differing fractions to identify those enriched specifically in the isolated CGs. Filtering thresholds were established based on the behavior of proteins with known localization at the thylakoid membrane, which are expected to be contaminants, and of homologs of plastoglobule proteins, which are expected to localize to the CGs. C) Pie chart of mean relative abundance (nLFQ) of summed functional categories and selected individual proteins. The ndbB protein is a redox-active enzyme involved in quinone metabolism; however, it was excluded from either of these functional categories and plotted independently. Functional categories are listed in the legend with the mean relative abundance of each category listed in brackets, first under the control conditions and then under P deficiency. D) Bar charts of protein abundance of functional categories and selected individual proteins. Refer to Supplementary Table S3 for the categorization of the CG proteins. Mean ± 1 SEM. Statistical significance was determined by homoscedastic 2-tailed Student's t-test; n = 4 biological replicates (i.e. independently grown cultures), *P < 0.05, **P < 0.01, ***P < 0.001.
Figure 5.
Figure 5.
Prenyl-lipid quantification from lysate, membrane pellet, and CG fractions. Prenyl-lipid compounds were identified and quantified using HPLC with photodiode array detection and standard curves with authentic standards of each compound class. A) Cumulative amounts of each compound class, including unidentifiable compounds that could be assigned to that class based on absorption spectra and retention times, are presented as a stacked bar chart. B) Quantities of selected prenyl-lipid compounds in each of the cellular fractions. Mean ± 1 SEM. Statistical significance in B) was determined by ordinary 2-way ANOVA; n = 3 to 4 biological replicates (i.e. independently grown cultures), *P < 0.033, **P < 0.002, ***P < 0.0001.
Figure 6.
Figure 6.
Neutral and polar lipids annotated in CGs of Synechocystis sp. PCC 6803. A) MS/MS fragmentation spectra of a selected TAG and MGDG lipid species. B) Bar chart of number of C atoms across all acyl chains of each lipid class under control or P-deficient growth conditions. C) Bar chart of the number of double bonds across all acyl chains of each lipid class under control or P-deficient growth conditions. Mean ± 1 SEM. Statistically significant differences between control and P-deficient growth conditions were determined by homoscedastic 2-tailed Student's t-test; n = 4 biological replicates (i.e. independently grown cultures), *P < 0.01, ***P < 0.001.
Figure 7.
Figure 7.
LC-MS/MS-based annotation of PQ derivatives in CGs of Synechocystis sp. PCC 6803. A) Structures of the canonical plastoquinone and plastoquinol compounds and each of the derivatives annotated in isolated CGs. Structural features distinct from the canonical structure are highlighted in red, in which “R” indicates an acyl chain. The position of the hydroxyl group in the -C form (and, therefore, of the acyl ester in the -B form) can be located at multiple locations along the prenyl tail giving rise to multiple isomers, although for simplicity the hydroxyl group is only presented at the end of the 1st prenyl group. A subset of PQ isomers had been initially referred to as plastoquinone-D before structures were determined; the name, plastoquinone-D, has been subsequently retired after structural determination demonstrated its isomeric relationship to plastoquinone-C isomers. B) MS/MS fragmentation spectra of 2 selected PQ derivatives. The intact mass, selected for fragmentation, is indicated in gray. Other fragmentation ions are indicated in distinct colors along with their accurate mass or m/z value. C) Bar chart of cumulative MS1 ion intensity levels of each PQ-derivative compound class annotated in isolated CGs under control or P-deficient growth conditions. Mean ± 1 SEM. Statistically significant differences between control and P-deficient growth conditions were determined by homoscedastic 2-tailed Student's t-test; n = 4, biological replicates (i.e. independently grown cultures) ***P < 0.001. D) Bar chart of MS1 ion intensity levels of individual PQ-derivative compounds annotated in isolated CGs under control or P-deficient growth conditions. Mean ± 1 SEM. Statistically significant differences between control and P-deficient growth conditions were determined by homoscedastic 2-tailed Student's t-test; n = 4 biological replicates (i.e. independently grown cultures), **P < 0.01, ***P < 0.001.
Figure 8.
Figure 8.
LC-MS/MS-based annotation of acylated phylloquinones in CGs of Synechocystis sp. PCC 6803. A) MS/MS fragmentation spectra of the C18:1 acylated phylloquinone. The intact mass, selected for fragmentation, is indicated in gray. Other fragmentation ions are indicated in distinct colors along with their accurate mass or m/z value. B) Bar chart of cumulative MS1 ion intensity levels of each phylloquinone-derivative compound class identified in isolated CGs under control or P-deficient growth conditions. Mean ± 1 SEM. Statistically significant differences between control and P-deficient growth conditions were determined by homoscedastic 2-tailed Student's t-test; n = 4 biological replicates (i.e. independently grown cultures), *P < 0.01, ***P < 0.001.
Figure 9.
Figure 9.
Phenotypic analysis of wild-type and selected deletion mutants of Synechocystis sp. PCC 6803. A)  Synechocystis cultures in plastic cuvettes illustrating differing pigmentation states after growth in liquid BG-11 media under control conditions (5 d of growth) or P-deficient conditions (4 d of growth). B) Chlorophyll a levels measured from liquid cultures grown in BG-11 media under control (left) or P-deficient (right) conditions. Levels are normalized to an OD750 of 1.0. Bars indicate mean ± 1 SEM. Lowercase letters indicate statistical comparisons from an ordinary 1-way ANOVA at P < 0.05, n = 3 biological replicates (i.e. independently grown cultures). C) The growth of the genotypes was assayed on BG-11 solid agar media under control (top) or P-deficient conditions (bottom). Starter culture was grown in liquid BG-11 media to an OD750 of 0.5 and serially diluted in 10-fold increments before spotting 10 μL of each dilution and incubating for 10 d at 30 μmol m−2 s−1 of PAR. Images represent typical results from at least 3 independent replicates. D) Photosynthetic measurements were made at 4 levels of irradiance (30, 60, 120, and 240 PAR). Values indicate mean ± 1 SEM. Where the error bar is missing, it is smaller than the data point. Statistically significant differences between control and P-deficient growth conditions at each irradiance level were determined by ordinary 2-way ANOVA; n = 3 biological replicates (i.e. independently grown cultures), *P < 0.02, ***P < 0.001.

Similar articles

References

    1. Abell BM, Hahn M, Holbrook LA, Moloney MM. Membrane topology and sequence requirements for oil body targeting of oleosin. Plant J. 2004:37(4):461–470. 10.1111/j.1365-313X.2003.01988.x - DOI - PubMed
    1. Abell BM, High S, Moloney MM. Membrane protein topology of oleosin is constrained by its long hydrophobic domain. J Biol Chem. 2002:277(10):8602–8610. 10.1074/jbc.M103712200 - DOI - PubMed
    1. Aizouq M, Peisker H, Gutbrod K, Melzer M, Holzl G, Dormann P. Triacylglycerol and phytyl ester synthesis in Synechocystis sp. PCC6803. Proc Natl Acad Sci U S A. 2020:117(11):6216–6222. 10.1073/pnas.1915930117 - DOI - PMC - PubMed
    1. Amesz J. The function of plastoquinone in photosynthetic electron transport. Biochim Biophys Acta. 1973:301(1):35–51. 10.1016/0304-4173(73)90011-6 - DOI - PubMed
    1. Austin JR, Frost E, Vidi PA, Kessler F, Staehelin LA. Plastoglobules are lipoprotein subcompartments of the chloroplast that are permanently coupled to thylakoid membranes and contain biosynthetic enzymes. Plant Cell. 2006:18(7):1693–1703. 10.1105/tpc.105.039859 - DOI - PMC - PubMed