. 2025 May 22;13(5):e011636.
doi: 10.1136/jitc-2025-011636.

Single-cell RNA sequencing of baseline PBMCs predicts ICI efficacy and irAE severity in patients with NSCLC

Affiliations

Single-cell RNA sequencing of baseline PBMCs predicts ICI efficacy and irAE severity in patients with NSCLC

Gyeong Dae Kim et al. J Immunother Cancer. .

Abstract

Background: Immune checkpoint inhibitors (ICIs) have transformed treatment and have provided significant clinical benefits and durable responses for patients with advanced non-small cell lung cancer (NSCLC). However, only a small percentage of patients respond to ICI treatment, and immune-related adverse events (irAEs) leading to treatment discontinuation remain challenging. Despite the recognized need for biomarkers to predict both the efficacy of ICIs and the risk of irAEs, such biomarkers are yet to be clearly identified.

Methods: In this study, we performed single-cell RNA sequencing (scRNA-seq) of peripheral blood mononuclear cells (PBMCs) from 33 patients with NSCLC before ICIs treatment. To validate our findings, we reanalyzed public scRNA-seq data, conducted a cytometric bead array (CBA), and supported our findings with T-cell receptor sequencing.

Results: While the immune response was more pronounced in patients with a favorable prognosis, the hypoxic pathway was more prominent in patients with primary resistance. Lymphocytes such as CD8 T cells, CD4 T cells, and natural killer cells were primarily involved in these pathways, with PRF1 and GZMB expression showing strong associations with favorable prognosis. In contrast, irAEs were mainly linked to myeloid cells, such as monocytes and macrophages. As irAE severity increased, inflammation and the TNF-NFKB1 pathway were more prominent. Specifically, increased expression of IL1B, CXCL8, and CXCL2 in monocytes and TNF in macrophages was closely associated with severe irAE through involvement in these pathways.Notably, the increase of PRF1 and GZMB expression showed a close association with both a favorable prognosis and a reduced severity of irAE, which was validated through CBA analysis. Moreover, the expression of these key markers varied according to prognosis and irAE severity regardless of patient background, such as programmed death-ligand 1 expression levels, tumor histology, or prior treatment regimens.

Conclusions: This study identified biological pathways and key biomarkers associated with ICI prognosis and irAE severity using PBMC samples before treatment. These findings provide a foundation for improved therapeutic strategies that enhance clinical outcomes while minimizing ICI treatment-associated risks.

Keywords: Biomarker; Immune Checkpoint Inhibitor; Immune related adverse event - irAE; Lung Cancer; Next generation sequencing - NGS.


Conflict of interest statement

Competing interests: No, there are no competing interests.

Figures
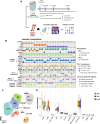
Figure 1
Figure 1. Comprehensive profiling of 33 patients with NSCLC PBMC prior to ICI therapy. (A) Workflow showing overall study design. (B) Clinical information of each patient included in our study. IrAE grades are indicated by a numerical value, and cancer stage are denoted by letter. (C) UMAP (Uniform Manifold Approximation and Projection) depicting 11 major cell types. Each cell type is labeled on the UMAP, and distinct colors represent individual cell types. (D) Box plot illustrating changes in the proportions of three ICIs prognosis groups (CR, AR, priR) in whole cell types. Each color indicates a specific prognosis group. Adeno, adenocarcinoma; AR, acquired resistance; aPD-1, anti-programmed cell death protein 1; aPD-L1, anti-programmed death-ligand 1; CD8_Pro, proliferating CD8 T cells; CR, complete remission; DC, dendritic cells; ICI, immune checkpoint inhibitor; irAE, immune-related adverse event; Macro, macrophages; Mono, Monocytes; NK, natural killer cells; NSCLC NOS, non-small cell lung cancer (NSCLC) not otherwise specified; PBMC, peripheral blood mononuclear cell; PD-1, programmed death-1; PD-L1, programmed death ligand 1; priR, primary resistance; SqCC, squamous cell carcinoma; TPS, tumor proportion score.
Figure 2
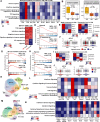
Figure 2. Profiling of 33 non-small cell lung cancer peripheral blood mononuclear cell samples and characterization associated with CR (A). Heatmap demonstrating the biological pathway of genes increased in CR compared with priR in all cell types. Color indicates values of significance (−log10(p value)). (B) Box plot illustrating each biological pathway score among the three ICI prognosis groups (CR, AR, priR) in CD8 T cells. Each color indicates a specific prognosis group. (C) Heatmap exhibiting the biological pathway of genes increased in CR compared with AR and priR in CD8 T cells. The asterisk indicates the significance, and the color shows normalization enrichment score. (D) The fgsea displaying gene set enrichment of hypoxia and UV response pathway variation between AR and priR in CD8 T cells. (E) Heatmap showing target motif enrichment (left) and gene expression (right) of the transcription factors in the CD8 T cells. The color indicates enrichment and expression levels. (F) Violin plot showing expression of HIF1A and FOXO1 across the hypoxia scores. ∗p<0.05, ∗∗p<0.01, ∗∗∗p<0.001. (G) The fgsea displaying gene set enrichment of NK cell-mediated cytotoxicity pathway variation between CR and priR (upper) or CR and AR (lower) in NK cells. (H) The fgsea displaying gene set enrichment of hypoxia and UV response pathway variation between AR and priR in NK cells. (I) Heatmap showing target motif enrichment (left) and gene expression (right) of the transcription factors in the NK cells. The color indicates enrichment and expression levels. (J) Violin plot showing expression of HIF1A and FOXO1 across the hypoxia scores. ∗p<0.05, ∗∗p<0.01, ∗∗∗p<0.001. (K) UMAP depicting 10 subtypes of CD8 T cells. Each cell type is labeled on the UMAP, and distinct colors represent individual cell types. (L) The heatmap illustrating the biological pathway of genes increased in CR compared with priR in CD8 T-cell subtypes. Color indicates values of significance (−log10(p value)). (M) UMAP depicting 12 subtypes of CD4 T cells. Each cell type is labeled on the UMAP, and distinct colors represent individual cell types. (N) The heatmap illustrating the biological pathway of genes increased in CR compared with priR in CD4 T-cell subtypes. Color indicates values of significance (−log10(p value)). AR, acquired resistance; CR, complete remission; DC, dendritic cells; DP, double positive; fgsea, fast gene set enrichment analysis; Macro, macrophages; Mono, Monocytes; NES, normalized enrichment score; NK, natural killer cells; priR, primary resistance; pro_CD8, proliferating CD8 T; Tcm, central memory CD4 T; TCR, T-cell receptor; Tem, effector memory CD4; Temra, terminally differentiated effector CD8; Tm, memory CD8 T; Tn, naive CD4 T; Treg, regulatory CD4; Trm rest, tissue resident memory resting CD4; UMAP, Uniform Manifold Approximation and Projection; UV, ultraviolet radiation.
Figure 3
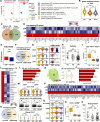
Figure 3. Discovery of key candidates linked to ICI therapy prognosis in CD8 T and CD4, and NK cells (A). Volcano plot displaying differentially expressed modules, which resulted from weighted gene correlation network analysis, between CR and priR. Each color indicates each module, and numbers represent the number of genes belonging to each module. The x-axis represents avg_log2FC and y-axis shows −log(p_value). (B) Violin plot indicating gene set scores of genes belonging to a green module in memory CD8 T cell2. Each color represents each prognosis group. (C) Venn diagram showing the number of overlapping genes between CR specifically increased genes and green module genes. (D) Pseudo-bulk analysis showing expression levels of 52 genes overlapping between CR in CD8 T cells and green modules. The color indicates expression levels of each gene among different prognosis groups. (E) Box plot illustrating 52 gene scores between the ICI response group and no response groups from public data (GSE216329). (F) Venn diagram showing the number of overlapping genes between our data and public data. (G) Violin plot indicating NKG7, GZMH, and PRF1 expression levels in memory CD8 T cells of our data (left) and public data (right). (H) Bee swarm plot indicating perforin expression levels among three prognosis groups. The y-axis indicates expression levels. ∗p<0.05, ∗∗p<0.01, ∗∗∗p<0.001. (I) Box plot illustrating changes in the proportion of cells with higher expression levels than an average expression of PRF1 and NKG7 among CD8A positive cells. (J) Pseudo-bulk analysis showing expression levels of 18 genes increased in CR from Trm rest1 of CD4 T cells. The color indicates expression levels of each gene among different prognosis groups. (K) Venn diagram showing the number of overlapping genes between our data (18 genes) and public data. (L) Bar plot presenting biological pathways in CR of a Trm rest1 of CD4 T cells. The x-axis indicates −log10(p value). (M) Violin plot indicating STAT1 and GBP2 expression levels between three prognosis groups in Trm rest1 (upper), whole CD4 T cells from public data (middle), and whole CD4 T cells from our data (lower). (N) UMAP depicting subtypes of NK cells (left) and violin plot showing NK cell-mediated cytotoxicity score (Kyoto Encyclopedia of Genes and Genomes) in NK subtypes. (O) Bar plot presenting biological pathways in CR of an NK subtype. The x-axis indicates −log10(p value). (P) Pseudo-bulk analysis showing expression levels of differentially increased in CR of NK cells. The color indicates expression levels of each. (Q) Violin plot indicating HLA-DRB5, GZMB, PRF1, and ITGAL expression levels between three prognosis groups in NK cells. (R) Box plot illustrating change in the proportion of NK cells with expression levels above an average expression of GZMB and positive expression of ITGAL. ∗p<0.05, ∗∗p<0.01, ∗∗∗p<0.001. (S) Bee swarm plot indicating granzyme B expression levels among three prognosis groups. The y-axis indicates expression levels. ∗p<0.05, ∗∗p<0.01, ∗∗∗p<0.001. AR, acquired resistance; CR, complete remission; DEG, differentially-expressed gene; GO, gene ontology; ICI, immune checkpoint inhibitor; NK, natural killer; priR, primary resistance; Trm rest1, tissue-resident memory resting CD4; UMAP, Uniform Manifold Approximation and Projection.
Figure 4
Figure 4. Identification of irAE biomarkers in monocytes strongly associated with irAE severity (A). The heatmap illustrating the biological pathway of genes increased in severe_irAE compared with no_irAE in all cell types. The color visualizes values of significance (−log10(p value)). (B) The fgsea displaying gene set enrichment of hypoxia and UV response pathway variation between no irAE and severe irAE in monocytes. (C) Pseudo-bulk analysis showing gene expression levels specifically increased in severe_irAE of monocytes. The color indicates expression levels of each gene among different irAE groups. Biological pathways associated with each gene are denoted by a number. The main candidate genes were highlighted in red color. (D) Volcano plot displaying gene expression changes between severe_irAE and no_irAE. The main candidate genes are labeled on the plot. The red and blue dots indicated increased genes in severe_irAE and no_irAE, respectively. The x-axis represents avg_log2FC and y-axis shows −log10(p_val_adj). (E) Bubble plot showing expression levels of five main candidates (CXCL8, IL1B, CXCL2, CCL3, EREG) in whole cell types. The color and dot size represent expression levels and per cent of cells expressing each gene, respectively. (F) Violin plot showing expression of main candidate genes according to the inflammation score levels. ∗p<0.05, ∗∗p<0.01, ∗∗∗p<0.001. (G) Dot plot indicating IL1R-IL1B interaction intensities between three irAE groups of monocytes and DCs. The dot color represents interaction intensities (log2(mean)), and dot size indicates interaction significance. (H) Heatmap displaying interaction potential and ligand and target gene expression. Ligand expression indicates IL1B expression levels in monocytes and DC between the three irAE groups. Regulatory potential represents the likelihood that ligands regulate the target genes. Target expression indicates the expression levels of target genes. (I) Expression level of TNFA_NFKB1 score between three irAE groups in monocytes. Each color represents each irAE group. (J) Line plot demonstrating the correlation between TNF_NKFB1 score and whole genes in monocytes. The main candidate genes are labeled on the plot. (K) Violin plot indicating NFKB1 expression levels in monocytes. (L) Violin plot indicating TNF expression levels in macrophages. (M) Dot plot indicating TNF-TNF receptor interaction intensities between three irAE groups of monocytes and macrophages. The dot color represents interaction intensities (log2(mean)), and dot size indicates interaction significance (−log10(p value)). (N) Heatmap displaying interaction potential and ligand and target gene expression. Ligand expression indicates TNF expression levels between the three irAE groups in macrophages. Regulatory potential represents the likelihood that ligands regulate the target genes. Target expression indicates the expression levels of target genes. (O) Heatmap showing target motif enrichment (upper) and gene expression (lower) of the transcription factors in the monocytes. The color indicates enrichment and expression levels. DC, dendritic cell; fgsea, fast gene set enrichment analysis; irAE, immune-related adverse event; NES, normalized enrichment score; UV, ultraviolet radiation.
Figure 5
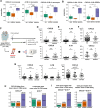
Figure 5. Validation of irAE severity biomarkers in large cohorts (A). Box plot illustrating changes in the proportion of cells expressing each gene CXCL8 (left) and IL1B (middle) or both genes (right) among three irAE groups of monocytes. (B) Box plot illustrating changes in the proportion of cells expressing all three genes (CXCL8, IL1B, and CCL3 or CXCL8, IL1B, and EREG) in three irAE groups of monocytes. (C) Workflow of CBA for the validation in a large cohort composing 175 patients with NSCLC prior to treatment. (D–F) Bee swarm plot indicating CXCL8 (D), IL1B (E), and CXCL2 (F) expression levels between no_irAE and severe_irAE (upper) or mild-to-moderate_irAE and severe_irAE (lower). The y-axis indicates expression levels. ∗p<0.05, ∗∗p<0.01, ∗∗∗p<0.001. (G) Bee swarm plot indicating CXCL8 (left), IL1B (middle), and CXCL2 (right) expression levels among three irAE groups. The y-axis indicates expression levels. ∗p<0.05, ∗∗p<0.01, ∗∗∗p<0.001. (H) Bar plot indicating proportion changes of cells showing higher expression levels than mean expression of CXCL8 (left) or IL1B (right) in CBA assay. (I) Bar plot indicating proportion changes of cells showing higher expression levels than average expression (left) or median expression (right) of CXCL8 and IL1B in CBA assay. CBA, cytometric bead array; ICI, immune checkpoint inhibitor; irAE, immune-related adverse event; NSCLC, non-small cell lung cancer.
Figure 6
Figure 6. Identification of irAE severity biomarkers in CD8 T cells (A). Bubble plot and violin plot illustrating expression levels of IFNG in CD8 (left), Pro_CD8 (middle), and NK cells (right). (B) Violin plot indicating IFNGR1 and IFNGR2 expression levels between the three irAE groups of macrophages and monocytes, and DC. (C) Dot plot indicating IFNG-IFNGR interaction intensities between three irAE groups in various cell types. The dot color represents interaction intensities (log2(mean)), and dot size indicates interaction significance. (D) Heatmap displaying interaction potential, ligand, and target gene expression. Ligand expression indicates IFNG expression levels between the three irAE groups. Regulatory potential represents the likelihood that ligands regulate the target genes. Target expression indicates the expression levels of target genes. (E) Box plot illustrating TCR diversity among three irAE groups. The dot represents each sample. (F) Bar plot showing a TCR clonotype specifically identified in severe irAE. The x-axis indicates each sample, and the y-axis indicates the proportion of each clonotype in each sample. DC, dendritic cell; irAE, immune-related adverse event; NK, natural killer; TCR, T-cell receptor.
Figure 7
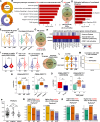
Figure 7. Discovery of biomarkers indicating good prognosis and less irAE (A). Donut plot showing the composition of samples indicating prognosis in the mild/moderate irAE and no irAE groups, respectively. (B) Bar plot showing biological pathways activated in CR compared with AR in the mild/moderate irAE group of CD8 T cells. The x-axis indicates −log10(p value). (C) Venn diagram showing the number of overlapping genes upregulated in the CR of mild/moderate irAE group within CD8 T cells, and genes upregulated in CR (vs AR and priR of all irAE group within CD8 T cells. (D) Bar plot showing biological pathways of overlapped 48 genes from (C). The x-axis indicates −log10(p value). (E) Violin plot indicating overlapped 48 genes score between the three prognosis groups within CD8 T cells from no_irAE samples. (F) Violin plot indicating overlapped 48 genes score between the three irAE groups within CD8 T cells. (G) Venn diagram showing the number of overlapping genes between 48 genes and genes upregulated in mild/moderate irAE (compared with severe irAE and no irAE) across CD8 T cells. (H) Pseudo-bulk analysis showing expression levels of 14 genes from (G). The color indicates expression levels of each gene among different prognosis groups. (I) Violin plot indicating overlapped 14 genes score between response and no response groups from public data (GSE216329). (J) Violin plot showing two biological pathways score between response and no response groups from public data. CD8 T-cell activation (left) and NK cell-mediated cytotoxicity (right). (K) Venn diagram showing the number of overlapping genes between 14 genes and genes differentially increased in the response group of public data. (L) Violin plot showing two candidate expressions between the three prognosis groups from CD8 T cells of no irAE samples. (M) Line plot demonstrating the correlation between CD8 T-cell activation score and whole genes in CD8 T cells. The two candidate genes we found in (K) are labeled on the plot. (N) Box plot illustrating changes in the proportion of cells with higher expression levels than an average expression of PRF1 in CD8 T cells in the prognosis group (left) and irAE group (right). (O) Box plot illustrating the proportion of cells with higher expression levels than an average expression of PRF1 in CD8 T cells in the response group (left) and irAE grade group (right) from public data (GSE216329). (P) Bee swarm plot indicating perforin expression levels among three irAE groups. The y-axis indicates expression levels. ∗p<0.05, ∗∗p<0.01, ∗∗∗p<0.001. (Q) Bar plot indicating proportion changes of cells showing higher expression levels than the mean (left) and median expression (right) of perforin among three prognosis groups from the CBA assay. (R) Bar plot indicating proportion changes of cells showing higher expression levels than the mean (left) and median expression (right) of perforin among three irAE groups from the CBA assay. AR, acquired resistance; CBA, cytometric bead array; CR, complete remission; DEG, differentially-expressed gene; irAE, immune-related adverse event; NK, natural killer; priR, primary resistance; TCR, T-cell receptor.

References

    1. Lim SM, Hong MH, Kim HR. Immunotherapy for Non-small Cell Lung Cancer: Current Landscape and Future Perspectives. Immune Netw. 2020;20:e10. doi: 10.4110/in.2020.20.e10. - DOI - PMC - PubMed
    1. Shukla N, Hanna N. Neoadjuvant and Adjuvant Immunotherapy in Early-Stage Non-Small Cell Lung Cancer. Lung Cancer (Auckl) 2021;12:51–60. doi: 10.2147/LCTT.S277717. - DOI - PMC - PubMed
    1. Carbone DP, Gandara DR, Antonia SJ, et al. Non-Small-Cell Lung Cancer: Role of the Immune System and Potential for Immunotherapy. J Thorac Oncol. 2015;10:974–84. doi: 10.1097/JTO.0000000000000551. - DOI - PMC - PubMed
    1. Sharma P, Hu-Lieskovan S, Wargo JA, et al. Primary, Adaptive, and Acquired Resistance to Cancer Immunotherapy. Cell. 2017;168:707–23. doi: 10.1016/j.cell.2017.01.017. - DOI - PMC - PubMed
    1. Zhou S, Yang H. Immunotherapy resistance in non-small-cell lung cancer: From mechanism to clinical strategies. Front Immunol. 2023;14:1129465. doi: 10.3389/fimmu.2023.1129465. - DOI - PMC - PubMed

MeSH terms

Substances