Position-Specific Substitution in Cellulose Ethers Studied by DNP Enhanced Solid-State NMR Spectroscopy
- PMID: 40404341
- PMCID: PMC12223920
- DOI: 10.1002/mrc.5535
Position-Specific Substitution in Cellulose Ethers Studied by DNP Enhanced Solid-State NMR Spectroscopy
Abstract
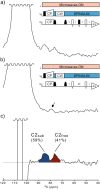
Ethyl hydroxyethyl cellulose (EHEC) and methyl ethyl hydroxyethyl cellulose (MEHEC) are hydrophilic cellulose ethers commonly employed as rheology modifiers in diverse industrial applications. The performance of these polymers, and their resistance to degradation by various cellulase enzymes, depends on their intricate molecular structure. Distribution of the etherifying groups, within the anhydroglucose units and along the polymer chain, is the key property to control. However, characterizing such structural properties is challenging, necessitating the development of novel analysis methods. In this study, we demonstrate the application of solid-state nuclear magnetic resonance (NMR) spectroscopy, enhanced by dynamic nuclear polarization (DNP), for this purpose. We prove that the hydrophilic EHEC and MEHEC samples are homogenously swelled in D2O/H2O-based radical solutions, a necessity to ensure uniform DNP enhancement throughout the material. And we illustrate how the high sensitivity enhancements obtained can be used to perform selective, J-coupling-based C1 to C2 transfer experiments to measure the fraction of substituted C2 positions in these cellulose ethers. Moreover, with further refinement, the methodology outlined in this work holds promise for elucidating C3-specific substitution patterns.
Keywords: DNP; EHEC; MEHEC; cellulose ethers; solid‐state NMR; substitution.
© 2025 The Author(s). Magnetic Resonance in Chemistry published by John Wiley & Sons Ltd.
Figures


Similar articles
-
Comparison of cellulose, modified cellulose and synthetic membranes in the haemodialysis of patients with end-stage renal disease.Cochrane Database Syst Rev. 2001;(3):CD003234. doi: 10.1002/14651858.CD003234. Cochrane Database Syst Rev. 2001. Update in: Cochrane Database Syst Rev. 2005 Jul 20;(3):CD003234. doi: 10.1002/14651858.CD003234.pub2. PMID: 11687058 Updated.
-
Elucidating the Substitution Pattern of a Hydroxyethyl Cellulose Thickening Agent by DNP-Enhanced Solid-State NMR.Anal Chem. 2025 Aug 5;97(30):16161-16167. doi: 10.1021/acs.analchem.5c00487. Epub 2025 Jul 23. Anal Chem. 2025. PMID: 40696966
-
Assessing the comparative effects of interventions in COPD: a tutorial on network meta-analysis for clinicians.Respir Res. 2024 Dec 21;25(1):438. doi: 10.1186/s12931-024-03056-x. Respir Res. 2024. PMID: 39709425 Free PMC article. Review.
-
Cost-effectiveness of using prognostic information to select women with breast cancer for adjuvant systemic therapy.Health Technol Assess. 2006 Sep;10(34):iii-iv, ix-xi, 1-204. doi: 10.3310/hta10340. Health Technol Assess. 2006. PMID: 16959170
-
Signs and symptoms to determine if a patient presenting in primary care or hospital outpatient settings has COVID-19.Cochrane Database Syst Rev. 2022 May 20;5(5):CD013665. doi: 10.1002/14651858.CD013665.pub3. Cochrane Database Syst Rev. 2022. PMID: 35593186 Free PMC article.
References
-
- Arca H. C., Mosquera‐Giraldo L. I., Bi V., Xu D., Taylor L. S., and Edgar K. J., “Pharmaceutical Applications of Cellulose Ethers and Cellulose Ether Esters,” Biomacromolecules 19 (2018): 2351–2376. - PubMed
-
- Nasatto P., Pignon F., Silveira J., Duarte M., Noseda M., and Rinaudo M., “Methylcellulose, a Cellulose Derivative With Original Physical Properties and Extended Applications,” Polymers 7 (2015): 777–803.
-
- Cheroni S., Gatti B., Margheritis G., Formantici C., Perrone L., and Galante Y. M., “Enzyme Resistance and Biostability of Hydroxyalkylated Cellulose and Galactomannan as Thickeners in Waterborne Paints,” International Biodeterioration & Biodegradation 69 (2012): 106–112.
-
- Tothill I. E. and Seal K. J., “Biodeterioration of Waterborne Paint Cellulose Thickeners,” International Biodeterioration & Biodegradation 31 (1993): 241–254.
Grants and funding
LinkOut - more resources
Full Text Sources
Miscellaneous

