. 2025 May 22;16(1):4760.
doi: 10.1038/s41467-025-59838-4.

The patient-specific mouse model with Foxg1 frameshift mutation provides insights into the pathophysiology of FOXG1 syndrome

Affiliations

The patient-specific mouse model with Foxg1 frameshift mutation provides insights into the pathophysiology of FOXG1 syndrome

Shin Jeon et al. Nat Commun. .

Abstract

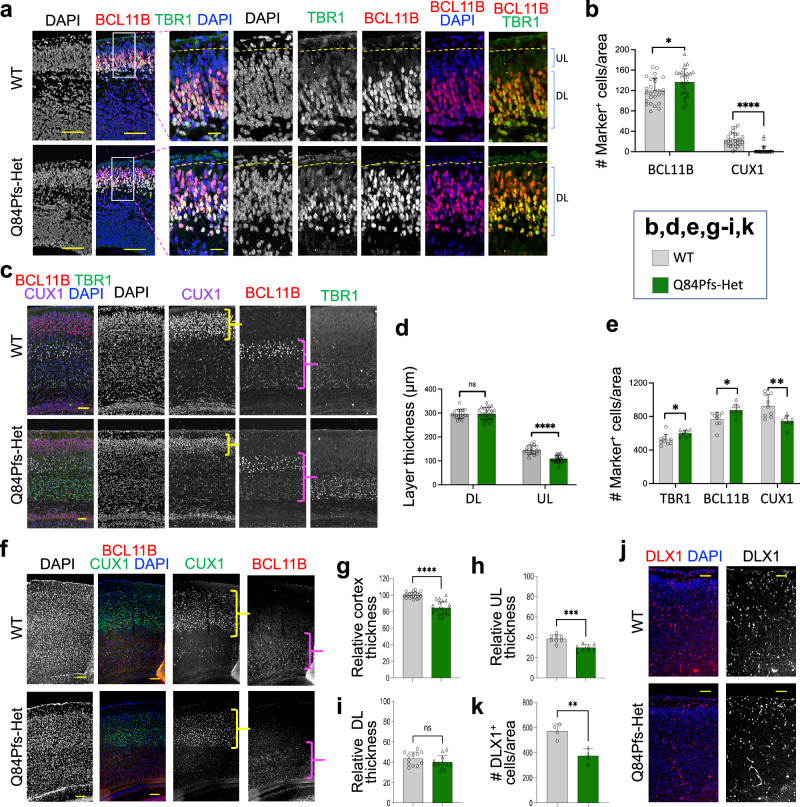
Single allelic mutations in the FOXG1 gene lead to FOXG1 syndrome (FS). To understand the pathophysiology of FS, which vary depending on FOXG1 mutation types, patient-specific animal models are critical. Here, we report a patient-specific Q84Pfs heterozygous (Q84Pfs-Het) mouse model, which recapitulates various FS phenotypes across cellular, brain structural, and behavioral levels. Q84Pfs-Het cortex shows dysregulations of genes controlling cell proliferation, neuronal projection and migration, synaptic assembly, and synaptic vesicle transport. The Q84Pfs allele produces the N-terminal fragment of FOXG1 (Q84Pfs protein) in Q84Pfs-Het mouse brains, which forms intracellular speckles, interacts with FOXG1 full-length protein, and triggers the sequestration of FOXG1 to distinct subcellular domains. Q84Pfs protein promotes the radial glial cell identity and suppresses neuronal migration in the cortex. Our study uncovers the role of the FOXG1 fragment from FS-causing FOXG1 variants and identifies the genes involved in FS-like cellular and behavioral phenotypes, providing insights into the pathophysiology of FS.


Conflict of interest statement

Competing interests: Elise Brimble is a salaried employee of Citizen Health and holds vested and unvested stock options. All other authors declare no competing interests.

Figures

Fig. 1
Fig. 1. Frameshift variants causing FS reveal the three mutation hot spots in the FOXG1 gene.
a Depictions of the human FOXG1 protein structure show that its N-terminal region includes domains rich in histidine (H), proline (P)/glutamine (Q), and glycine (G)/glutamic acid (E)/lysine (K). FOXG1 also contains a Forkhead DNA-binding domain (DBD) and Groucho- and Jarid-interacting domains. The three G (guanine) or C (cytosine)-repeat regions in the FOXG1-coding sequences, labeled as 7 C (coding DNA reference sequences, c.250-256), 7 G (c.454-460), and 6 G (c.501-506), are mutation-prone areas in FS. Frameshift mutations in these regions are annotated with a “p” prefix to signify the resulting amino acid sequence changes. b, c Pie charts showing the fraction of each mutation type that results in FS (b) and the fraction of frameshift mutations occurring before, within, or after the DBD in the FOXG1 protein (c). d Clinical findings of eight FS patients with FOXG1 mutations at c.250-256 and c.454-460 positions. e Frequency of phenotypes among the eight FS patients in (d).
Fig. 2
Fig. 2. Generation of the FS mouse model Q84Pfs and its anatomical brain deficits.
a Schematics of mouse FOXG1 full-length (FOXG1-fl) protein and Q84Pfs fragment, and the antigenic regions for two FOXG1 antibodies. The antibody FOXG1-N-Ab detects both FOXG1-fl and Q84Pfs proteins. The antibody FOXG1-C-Ab recognizes FOXG1-fl, but not Q84Pfs. b Sanger sequencing results of the Foxg1 gene of wild-type (WT), Q84Pfs-Het, and Q84Pfs-Homo mice. An extra cytosine (C) insertion occurred after the 250th nucleotide cytosine in the Q84Pfs allele, indicated as a cytosine duplication (dupC) in the sequencing data of Q84Pfs-Homo mice. c The morphology of WT, Q84Pfs-Het, and Q84Pfs-Homo brains at E18.5. d The representative images for Nissl stain of the serial coronal sections of WT and Q84Pfs-Het adult brains. The anterior-to-posterior sections were as shown. e Magnified views of the midline areas as marked as red-dotted rectangles in (d). Yellow and red arrows indicate the septum and corpus callosum deficits, respectively. f Magnified views of the hippocampus as marked as blue-dotted rectangles in (d). g Quantification of the corpus callosum (CC) thickness in the serial coronal sections of WT and Q84Pfs-Het adult brains from the anterior (1:**p = 0.0079, 2:p = 0.4127, 3:p = 0.5556, 4:p = 0.7302, 5:p = 0.3333), corresponding to the area of the most left column of (e), to the posterior, corresponding to the area of the most right column of (e). h, i Quantification of the length of the dentate gyrus (DG, ****p < 0.0001) and the size of the hippocampus (HP, *p = 0.0107) areas in the serial coronal sections of WT and Q84Pfs-Het adult brains. (gi, n = 4 for WT, 5 for Q84Pfs-Het mice). Scale bars, 1 mm (d) or 200 μm (e, f). jn Quantification of body weight (j, p = 0.7432), brain weight (k, ****p < 0.0001), anterior-posterior length (m, ****p < 0.0001), or the total area (n, ****p < 0.0001) of the corpus callosum in the sagittal section of the brains, as depicted in (l) in WT and Q84Pfs-Het adult mice. (j, k, m, n, n = 7 males, 9 females for WT, 8 males and 7 females for Q84Pfs-Het mice). The error bars (gk, m, n) represent SEM. Two-tailed Mann-Whitney test (g, m, n) or unpaired two-tailed t test (hk). Only the representative images are shown.
Fig. 3
Fig. 3. Q84Pfs fragment (Q86Pfs for human) is expressed in Q84Pfs-Het mouse cortex and interacts with FOXG1-fl.
a, b The immunostaining analyses of E16 Q84Pfs-Het and WT cortices with FOXG1-N-Ab and FOXG1-C-Ab. The fluorescence intensity in individual cells was quantified in (b). The signal intensity with FOXG1-N-Ab was increased in Q84Pfs-Het relative to WT (**p = 0.0011), but the signal intensity with FOXG1-C-Ab was significantly lower in Q84Pfs-Het than WT (****p < 0.0001). The mean intensity was measured in three independent sections per mice (n = 3 mice/condition). The midline represents the mean. Two-tailed Mann-Whitney test was used. Scale bars, 25 μm (a set of images on the left) or 10 μm (a set of magnified images on the right). c CoIP assays in HEK293T cells transfected with Flag-tagged FOXG1-fl and HA-tagged FOXG1-fl (the left set) or with FOXG1-fl and Flag-tagged Q86Pfs (the right set). In the coIP set on the left, the association between Flag-FOXG1-fl and HA-FOXG1-fl was tested by immunoprecipitation with Flag antibody, followed by western blot with HA antibody. In the coIP set on the right, the association between FOXG1-fl and Flag-Q84Pfs was monitored by immunoprecipitation with Flag antibody, followed by western blot with FOXG1-N-Ab that detects both FOXG1-fl and Q84Pfs and distinguishes the two proteins by the protein size differences. CoIP data show that FOXG1-fl interacts with each other and with Q86Pfs fragment. d The immunostaining analyses in HEK293T cells transfected with FOXG1-fl alone (top panel), Q86Pfs alone (middle panel), and both FOXG1-fl and Q86Pfs (bottom panel). GFP labels the transfected cells as all plasmids have ires-GFP sequences. The subcellular distribution of FOXG1-fl and Q86Pfs proteins was assessed using FOXG1-N-Ab and FOXG1-C-Ab. FOXG1-fl protein, detected by both antibodies, is localized in nuclei, whereas Q86Pfs, recognized by only FOXG1-N-Ab but not by FOXG1-C-Ab, shows prominent speckles in nuclei and cytosol. When co-expressed, FOXG1-fl is localized in Q86Pfs+ nuclear speckles (white arrows). Scale bars, 5 μm. e The model. In Q84Pfs-Het neurons, Q84Pfs proteins are co-expressed and form speckle-like patterns with FOXG1-fl. In WT neurons, FOXG1 is primarily expressed in nuclei. Only the representative images are shown. The experiments repeated three (c) and six times (d) independently.
Fig. 4
Fig. 4. Q86Pfs inhibits neuronal migration, and promotes self-renewing RGC fate.
The in vivo activity of Q86Pfs was monitored in mouse brains electroporated with GFP or Q86Pfs-ires-GFP constructs. a, d Schematics of in utero electroporation at E15.5 and brain analysis at E18.5 (ac) or E17.5 (dh). GFP labels the electroporated cells expressing Q86Pfs (Q86Pfs-ires-GFP) or GFP. ac Analysis of GFP+ neuronal migration. The proportion of GFP+ cells was increased in the IZ and decreased in the CP in Q86Pfs-expressing brains compared to GFP-alone-expressing brains, indicating that Q86Pfs suppresses neuronal migration. BCL11B marks deep-layer neurons and demarcates the CP. The immunostaining with Flag antibody shows the subcellular localization pattern of Flag-tagged Q86Pfs protein. The magnified view of the Flag staining depicts the speckle-like distribution of Q84Pfs. Red-arrow, GFP+ RGC cell bodies at the ventricular surface; blue-arrow, GFP+ RGC’s glial processes; green-arrow, GFP+ RGC’s basal endfeet at the pial-surface; red-line, ventricular surface. VZ, ventricular zone; IZ, intermediate zone; SP, subplate; CP, cortical plate. c The percentage of GFP+ cells in each area. n = 5 mice/condition. The error bars represent SEM. VZ: p = 0.5377, IZ: **p = 0.0027, SP: p = 0.0650, CP: **p = 0.0045 in two-tailed Mann-Whitney test. e, f Analysis of RGC fate using the RGC marker NESTIN. g, h Analysis of proliferating cells using BrdU labeling. f, h Quantification of the number of GFP+NESTIN+ RGC scaffold processes (f) or GFP+BrdU+ proliferating cells (h) in 100μm-wide vertical areas encompassing VZ to CP of the cortex. The number of GFP+ RGC’s glial scaffold (f) and BrdU+ proliferating cells (h) was increased in Q86Pfs-expressing brains relative to GFP-expressing brains. n = 5 mice/condition, ****p < 0.0001 (f) or n = 8 mice for GFP alone and n = 13 mice for Q86Pfs-ires-GFP, **p = 0.0028 (h). Scale bars, 100 μm (low magnification images in b), 10 μm (magnified view of Flag immunostaining, b), 50 μm (low magnification images in e, g), 20 μm (magnified images in e, g). Yellow-line, ventricular surface (g). In the box-plots (f, h) the whiskers show minimum and maximum values, the box represents the 25th and 75th percentile of the data, and the center line indicates the median. Only the representative images are shown. i, Model for Q84Pfs actions to block neuronal migration and promote RGC fate.
Fig. 5
Fig. 5. The dysregulated genes and pathways in Q84Pfs-Het cortex at P1.
a Differentially expressed genes (DEGs) in the RNA-seq analyses of P1 cortices of Q84Pfs-Het and WT mice as shown by the volcano plot (n = 3 for Q84Pfs-Het mice; n = 2 for WT). The posterior probability of being equally expressed (PPEE) was used as P-value. b Cortical upper layer and interneuron genes were downregulated, whereas the deep layer genes were upregulated. c The integration of DEGs of Q84Pfs-Het cortex and FOXG1 ChIP-seq data revealed the fraction of the DEGs that directly recruit FOXG1, as marked by orange. d The motif analysis (HOMER) of FOXG1 ChIP-seq peaks associated with up- or down-regulated genes in Q84Pfs-Het cortex reveals the potential partner TFs that work with FOXG1 in cortex development. TF, transcription factor. P values are adjusted for multiple testing using the Benjamini-Hochberg false discovery rate (FDR) correction and the tests were two-sided. eh, Gene set enrichment analysis (GSEA) of DEGs. The tissue (e) and cell type (f) analyses show the tissue types and cell types that are associated with up- and down-regulated DEGs. Analyses of biological process (BP) and cellular component (CC) terms for up-regulated (g) and down-regulated (h) DEGs. Benjamini-Hochberg FDR was applied to adjust for multiple comparisons and the tests were two-sided.
Fig. 6
Fig. 6. NPCs increased in Q84Pfs-Het cortex.
The immunostaining analyses of Q84Pfs-Het and WT cortices at E16 with the NPC marker Pax6 (a, c) and the proliferation cell marker phosphorylated histone H3 (pHH3) (d, e). The quantification of cortex thickness (b), the thickness of Pax6+ progenitor areas (c), and the number of pHH3+ cells (e). Scale bars, 200 μm (lower magnification images in a, d), or 50 μm (higher magnification images in a, d). Thickness in (b, c) was measured in three independent areas per section (n = 3 mice/condition). The cell number in (e) was counted in three mice per condition. The error bars (b, c, e) represent SD. ****p < 0.0001 (b, c) and *p = 0.0412 (e) in unpaired two-tailed t tests. Only the representative images are shown.
Fig. 7
Fig. 7. Q84Pfs-Het cortex showed a reduction of upper layer excitatory neurons and inhibitory interneurons and an increase of deep layer excitatory neurons.
The immunostaining analyses of Q84Pfs-Het and WT brains with cortical excitatory and inhibitory neuronal markers at E16 (a, b), P1 (ce, j, k), P30 (fi). BCL11B and TBR1 mark deep layer (DL) neurons, whereas CUX1 labels upper layer (UL) neurons. DLX1 marks cortical interneurons. a, b The yellow dotted lines indicate the upper limit of the cortical pyramidal neurons (a). BCL11B+ DL neurons increased, whereas UL neurons located above BCL11B+ neurons were markedly reduced in Q84Pfs-Het cortex at E16 (a, b). Similarly, the number of CUX1+ UL neurons, the thickness of CUX1+ UL, and the cortex thickness were significantly reduced in Q84Pfs-Het cortex at P1 (ce) and P30 (f, g, h). The number of TBR1+ and BCL11B+ DL neurons increased, but the thickness of DL did not significantly change in Q84Pfs-Het cortex (ch). The UL and DL were marked by yellow and magenta brackets, respectively (c, f). The number of DLX1+ interneurons was reduced in Q84Pfs-Het cortex (j,k). Scale bars, 100 μm (lower magnification images in a), 20 μm (higher magnification images in a), 500 μm (c, j), or 1 mm (f). n = 4 mice/condition for b, d, e, h, i, k; n = 7 mice/condition for g. The error bars represent SD. BCL11B: *p = 0.0243; CUX1: ****p < 0.0001 (b), DL: p = 0.8381; UL: ****p < 0.0001 (d), TBR1: *p = 0.0105; BCL11B: *p = 0.0126; CUX1: **p = 0.0029 (e), Cortex thickness: ****p < 0.0001 (g), UL thickness:***p = 0.0001 (h), DL thickness: p = 0.2130 (i), DLX1+ cells: **p = 0.0029 (k) in unpaired two-tailed t test. Only representative images are shown.
Fig. 8
Fig. 8. Q84Pfs-Het cortex exhibited axonal defects.
The immunostaining analyses of Q84Pfs-Het and WT brains with the axonal marker L1 and thalamocortical axonal marker NTNG1 at P0 (a), E16 (b, c), and P1 (d). Probst bundles (yellow arrow in a) were formed at the midline of Q84Pfs-Het brains, but not of WT brains. In addition, Q84Pfs-Het cortex exhibited an increase in displaced L1/NTNG1-double positive axonal bundles (yellow arrows in b), as quantified (c,d). Scale bars, 1 mm (a), or 200 μm (b). n = 4 mice/condition. The error bars represent SD. ***p = 0.0009 (c), ***p = 0.0003 (d) in unpaired two-tailed t test. Only representative images are shown.
Fig. 9
Fig. 9. Q84Pfs-Het mice showed myelination deficits.
The immunostaining analyses of Q84Pfs-Het and WT brains with oligodendrocyte lineage cell marker OLIG2 (a, b) and myelination marker MBP (ce) at P30. Q84Pfs-Het cortex exhibited increased OLIG2+ oligodendrocyte lineage cells, markedly reduced myelinated areas, and disrupted patterns of myelination structure. The number of OLIG2+ cells was measured across three separate regions from the medial to the lateral cortex in coronal sections (b). The proportion of the myelinated area marked by MBP within the total cortical area (d) and the relative fluorescence intensity of MBP in the entire cortical region (e) were quantified. b, d, e n = 6 for WT; 7 mice for Q84Pfs-Het mice. The error bars represent SD. ****p < 0.0001 in unpaired two-tailed t test (b, d, e). Only representative images are shown. Scale bars, 1 mm (the images in the first two columns in a, c), 300 μm (the images in the third column in c), 500 μm (the images in the third column in c), or 100 μm (higher magnification images in a, c). The dotted rectangles marked the area that was magnified in the following columns.
Fig. 10
Fig. 10. Movement deficits, autism-like behaviors, and behavioral arrest in Q84Pfs-Het mice showed.
a, b, GSEA revealed the association of the DEGs in Q84Pfs-Het cortex with human disorders (e.g., autism and Huntington’s disease) and OPC genes. Benjamini-Hochberg correction to control for multiple testing, and P-values in two-sided tests c WT and Q84Pfs-Het mice showed similar body weights (n=WT 12 male, 9 female; Q84Pfs-Het 9 male, 10 female). d Wire hanging test. Q84Pfs-Het mice showed a reduced hanging time. P30: p = 0.3674, P60: **p = 0.0032, P90: ***p = 0.0008. e Open field test. Q84Pfs-Het mice showed reduced travel distance at P60/P90. P30, 10 min: p = 0.1764, 20 min: p = 0.2451, 30 min: p = 0.9975, 40 min: p = 0.9639, 50 min: p = 0.6118, 60 min: p = 0.1409. P60, 10 min: p = 0.2737, 20 min: ***p = 0.0001, 30 min: ****p < 0.0001, 40 min: **p = 0.0010, 50 min: ***p = 0.0003, 60 min: ****p < 0.0001. P90, 10 min: p = 0.9821, 20 min: p = 0.6561, 30 min: p = 0.0631, 40 min: **p = 0.0027, 50 min: *p = 0.0239, 60 min: ***p = 0.0002. f Some Q84Pfs-Het mice but none of the WT mice displayed extended behavioral arrest (movement paused for more than 3 min at one episode during a one-hour-long open field test). The black bars represent the percentage of mice experiencing behavioral arrest. g Center time during a one-hour-long open field test. Q84Pfs-Het mice showed a reduced center time at P60/P90. P30: p = 0.0681, P60: p = ***0.0007, P90: ****p < 0.0001. h Q84Pfs-Het mice exhibited increased self-grooming behavior relative to WT. P30: **p = 0.0032, P60: ****p < 0.0001, P90: ***p = 0.0002. i Q84Pfs-Het mice buried significantly fewer marbles than WT mice at P60/P90 but showed a tendency to bury more marbles at P30. P30: p = 0.0896, P60, P90: ****p < 0.0001. ci Error bars, SEM. Two-way ANOVA test (c, d, e, g, i) and p values adjusted for multiple comparisons. Two-tailed Mann-Whitney Test (h). Each circle and triangle correspond to one animal. d, i, For P30, WT n = 22 (12 male, 10 female), Q84Pfs-Het n = 20 (10 male, 10 female); for P60 and P90, WT n = 21 (12 male, 9 female), Q84Pfs-Het n = 19 (9 male, 10 female). eh, For P30 and P60, WT n = 20 (12 male, 8 female), Q84Pfs-Het n = 18 (8 male, 10 female); for P90 in e, g WT n = 21 (12 male, 9 female), Q84Pfs-Het n = 18 (8 male, 10 female) and for P90 in f, h WT n = 21 (12 male, 9 female), Q84Pfs-Het n = 17 (7 male, 10 female).

Update of

References

    1. Tao, W. & Lai, E. Telencephalon-restricted expression of BF-1, a new member of the HNF-3/fork head gene family, in the developing rat brain. Neuron8, 957–966 (1992). - PubMed
    1. Xuan, S. et al. Winged helix transcription factor BF-1 is essential for the development of the cerebral hemispheres. Neuron14, 1141–1152 (1995). - PubMed
    1. Cadwell, C. R., Bhaduri, A., Mostajo-Radji, M. A., Keefe, M. G. & Nowakowski, T. J. Development and arealization of the cerebral cortex. Neuron103, 980–1004 (2019). - PMC - PubMed
    1. Lim, L., Mi, D., Llorca, A. & Marín, O. Development and functional diversification of cortical interneurons. Neuron100, 294–313 (2018). - PMC - PubMed
    1. Martynoga, B., Morrison, H., Price, D. J. & Mason, J. O. Foxg1 is required for specification of ventral telencephalon and region-specific regulation of dorsal telencephalic precursor proliferation and apoptosis. Developmental Biol.283, 113–127 (2005). - PubMed

LinkOut - more resources