. 2025 May 22;16(1):4781.
doi: 10.1038/s41467-025-59820-0.

Revealing 3D microanatomical structures of unlabeled thick cancer tissues using holotomography and virtual H&E staining

Affiliations

Revealing 3D microanatomical structures of unlabeled thick cancer tissues using holotomography and virtual H&E staining

Juyeon Park et al. Nat Commun. .

Abstract

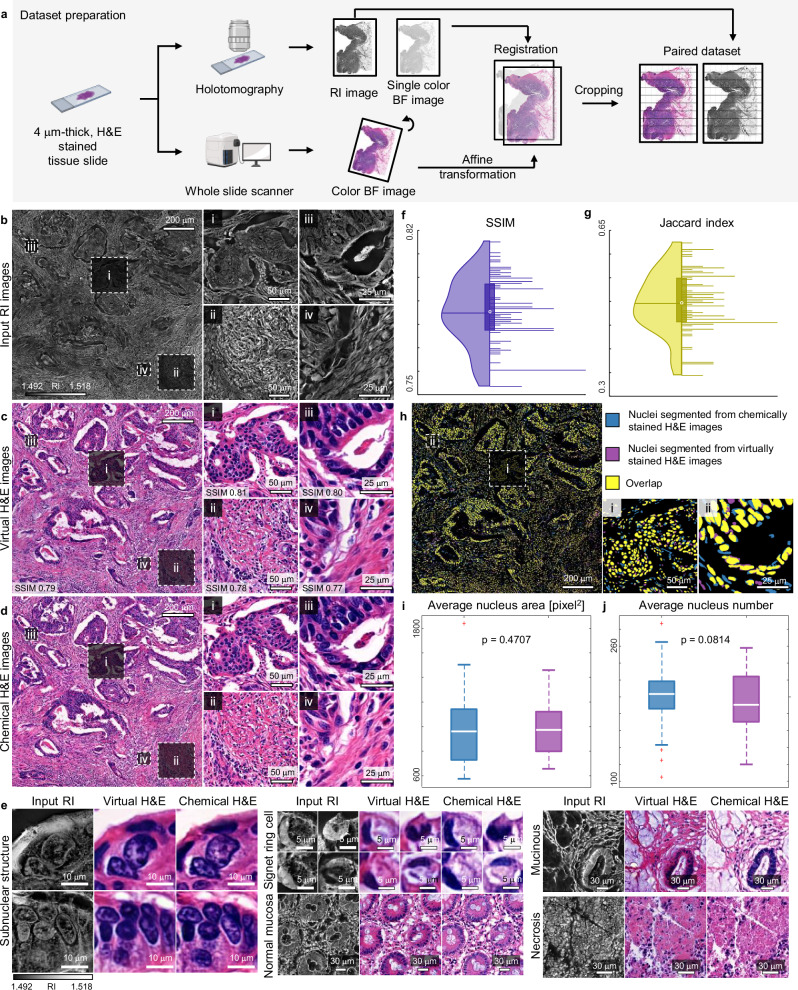
In histopathology, acquiring subcellular-level three-dimensional (3D) tissue structures efficiently and without damaging the tissues during serial sectioning and staining remains a formidable challenge. We address this by integrating holotomography with deep learning and creating 3D virtual hematoxylin and eosin (H&E) images from label-free thick cancer tissues. This method involves measuring the tissues' 3D refractive index (RI) distribution using holotomography, followed by processing with a deep learning-based image translation framework to produce virtual H&E staining in 3D. Applied to colon cancer tissues up to 50 µm thick-far surpassing conventional slide thickness-this technique provides direct methodological validation through chemical H&E staining. It reveals quantitative 3D microanatomical structures of colon cancer with subcellular resolution. Further validation of our method's repeatability and scalability is demonstrated on gastric cancer samples across different institutional settings. This innovative 3D virtual H&E staining method enhances histopathological efficiency and reliability, marking a significant advancement in extending histopathology to the 3D realm and offering substantial potential for cancer research and diagnostics.


Conflict of interest statement

Competing interests: D.R., D.A., H.C., H.-S.M. and Y.K.P. have financial interests in Tomocube, a company that commercializes holotomography instruments. T.H.H. is a scientific co-founder of Kure.ai Therapeutics and its subsidiary, Kure.S. He holds no official roles in the companies and receives no salary or consulting fees. The companies did not influence the design, execution, or interpretation of this study. All other authors declare no competing interests.

Figures

Fig. 1
Fig. 1. Overview of the proposed framework.
a Procedures for conventional 3D histopathology including multiple sectioning, H&E staining, and imaging under BF microscopy. b The proposed framework of 3D virtual H&E staining. Integration of holotomography and deep learning enabled label-free 3D virtual H&E staining of thick cancer tissue slides. c Optical setup for holotomography and reconstruction procedures. Raw intensity images are deconvolved with the optical transfer functions, reconstructing 3D RI images. d Training and testing phases for 3D virtual staining. The neural network is trained to map between RI and BF images using the conventional 4 μm-thick H&E-stained tissue slides during the training phase. The trained neural network is directly applied to the 3D RI images obtained from label-free, thick tissue slides. e A supervised learning workflow employed during the training phase. Figures 1a, b, d were created with BioRender.com.
Fig. 2
Fig. 2. Validations of the trained network with a 4 m-thick, H&E-stained colon cancer tissue slide.
a Dataset preparation steps before network training. b A wide-field RI image obtained from a 4 μm-thick, H&E-stained colon cancer slide and its detailed images. Results are from a single experiment. c A wide-field virtual H&E image generated by the trained neural network and its detailed images. Results are from a single experiment. d A ground truth chemical H&E image obtained using a WSS and its detailed images. Results are from a single experiment. e Comparison of virtual and chemical H&E images across various pathological features. Results are from a single experiment. f Distribution of SSIM values computed from 100 cropped patches. In the box plot, the white circle at the center of the box represents the median, the ends of the box represent the first and third quartiles, and the whicker spans a 1.5 interquartile range from the ends. g Distribution of Jaccard index values computed from 100 cropped patches of nucleus segmentation results. In each box plot, the white circle at the center of the box represents the median, the ends of the box represent the first and third quartiles, and the whicker spans a 1.5 interquartile range from the ends. h An overlapped nuclei segmentation map obtained from virtual (blue) and chemical (purple) H&E images. Results are from a single experiment. i, j Distribution of average nucleus area (i) and average number of nuclei (j) at each cropped patch obtained from virtual (blue) and chemical (purple) H&E images. The distributions were derived from a total of 100 patches. Paired, two-sided Student’s t-test was used to calculate P values. In each box plot, the white line represents the median, the ends of the box represent the first and third quartiles, and the whicker spans a 1.5 interquartile range from the ends. Figure 2a was created with BioRender.com.
Fig. 3
Fig. 3. Virtual 3D H&E staining of 10 μm-thick colon cancer tissue slide.
a Workflow of generating 3D virtual H&E of 10 μm-thick colon cancer tissue slides (b). A wide-field RI image obtained from the label-free 10 μm-thick colon cancer tissue slides using holotomography. A single focal plane of the 3D RI image is presented. c Detailed 3D RI images of glands and lumens obtained from 10 μm-thick colon cancer tissue slides. d A wide-field virtual H&E image predicted from (b). A single focal plane of the 3D virtual H&E image is presented. e Detailed images of 3D virtual H&E images. Cyan arrows indicate the necrotic structures. Figure 3a was created with BioRender.com.
Fig. 4
Fig. 4. Virtual 3D H&E staining of 20 μm-thick colon cancer tissue slide.
a A wide-field RI image obtained from the label-free 20 μm-thick colon cancer tissue slide using holotomography. A single focal plane of the 3D RI image is presented. b Detailed 3D RI images of glands and lumens obtained from the 20 μm-thick colon cancer tissue slide. c A wide-field virtual H&E image predicted from (a). A single focal plane of the 3D virtual H&E image is presented. d Detailed images of 3D virtual H&E images. Cyan arrows indicate lumens.
Fig. 5
Fig. 5. 3D subcellular examination of colon cancer tissue slide a, b.
The xy, yz, and xz cross sections of 3D virtual H&E images of the 10 (a) and 20 μm-thick colon cancer tissue slide (b). c, d Detailed images to visualize individual nuclei in input RI images and corresponding virtual H&E images from the 10 (c) and 20 μm-thick tissue slide (d) and their corresponding chemical H&E images. Yellow and cyan arrows indicate the individual nuclei at different axial positions.
Fig. 6
Fig. 6. Validations using the standard histopathology procedures.
a, d A single focal plane of 3D virtual H&E images predicted from label-free 10 (a) and 20 (d) μm-thick colon cancer tissue slide. b, e, Minimum intensity projection of 3D virtual H&E images predicted from label-free 10 (b) and 20 μm-thick colon cancer tissue slide (e). c, f Same 10 (c) and 20 μm-thick tissue slides (f) were stained with H&E and imaged using WSS. Detailed images of selected glandular structures are presented (i, ii). Data shown are from a single experiment.
Fig. 7
Fig. 7. 3D microanatomical rendering and quantitative analysis of a whole 50 μm-thick colon cancer tissue slide.
a A label-free colon cancer slide of 50 μm thickness used for imaging. b A maximum projected whole slide 3D RI image of (a). c A minimum projected whole slide 3D virtual H&E image of (a). d A WSS image of (a) after the staining. e Zoomed-in RI images of (b). f Zoomed-in virtual H&E images of (c). g Zoomed in WSS images of (d). h Detailed 3D RI images of the selected region. i, Detailed 3D virtual H&E images of the selected region. j Detailed WSS image of the selected region. k 3D rendering of the microanatomical structure of the selected region. l 3D binary masks of the single nucleus overlaid to the virtual H&E images. m 3D rendering of the nucleus using the binary masks in (l). n Tracking of average numbers, areas, and eccentricities of the nuclei along the axial axis. o Tracking of perimeter, area, and major axis length of the lumen along the axial axis.
Fig. 8
Fig. 8. Validations of the virtual staining across different organ types and institutional settings a.
A wide-field RI image obtained from the label-free 20 μm-thick gastric cancer tissue slide. A single section of the 3D RI image is presented. b Detailed 3D RI images of muscular (cyan arrows) and vascular (yellow arrows) structures obtained from the 20 μm-thick gastric cancer tissue slide. c A wide-field H&E image predicted from (a). A single section of the 3D H&E image is presented. d Detailed images of 3D H&E images predicted from (a). e, f The x-y, y-z, and x-z cross sections of predicted 3D H&E images.

References

    1. Wang, L., Li, M. & Hwang, T. H. The 3D revolution in cancer discovery. Cancer Discov.14, 625–629 (2024). - PubMed
    1. Kiemen, A. L. et al. CODA: quantitative 3D reconstruction of large tissues at cellular resolution. Nat. Methods19, 1490–1499 (2022). - PMC - PubMed
    1. Olson, E., Levene, M. J. & Torres, R. Multiphoton microscopy with clearing for three dimensional histology of kidney biopsies. Biomed. Opt. Express7, 3089–3096 (2016). - PMC - PubMed
    1. Paul, D., Cowan, A. E., Ge, S. & Pachter, J. S. Novel 3D analysis of Claudin-5 reveals significant endothelial heterogeneity among CNS microvessels. Microvascular Res.86, 1–10 (2013). - PMC - PubMed
    1. Glaser, A. K. et al. Light-sheet microscopy for slide-free non-destructive pathology of large clinical specimens. Nat. Biomed. Eng.1, 0084 (2017). - PMC - PubMed

MeSH terms

LinkOut - more resources