. 2025 May 22;16(1):4750.
doi: 10.1038/s41467-025-59375-0.

Insights from the Biorepository and Integrative Genomics pediatric resource

Collaborators, Affiliations

Insights from the Biorepository and Integrative Genomics pediatric resource

Silvia Buonaiuto et al. Nat Commun. .

Abstract

The Biorepository and Integrative Genomics (BIG) Initiative in Tennessee has developed a pioneering resource to address gaps in genomic research by linking genomic, phenotypic, and environmental data from a diverse Mid-South population, including underrepresented groups. We analyzed 13,152 exomes from BIG and found significant genetic diversity, with 50% of participants inferred to have non-European or several types of admixed ancestry. Ancestry within the BIG cohort is stratified, with distinct geographic and demographic patterns, as African ancestry is more common in urban areas, while European ancestry is more common in suburban regions. We observe ancestry-specific rates of novel genetic variants, which are enriched for functional or clinical relevance. Disease prevalence analysis linked ancestry and environmental factors, showing higher odds ratios for asthma and obesity in minority groups, particularly in the urban area. Finally, we observe discrepancies between self-reported race and genetic ancestry, with related individuals self-identifying in differing racial categories. These findings underscore the limitations of race as a biomedical variable. BIG has proven to be an effective model for community-centered precision medicine. We integrated genomics education, and fostered great trust among the contributing communities. Future goals include cohort expansion, and enhanced genomic analysis, to ensure equitable healthcare outcomes.


Conflict of interest statement

Competing interests: The Regeneron Genetic Center is a subsidiary of Regeneron Pharmaceuticals, Inc. All the other authors declare no competing interests.

Figures

Fig. 1
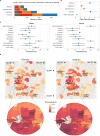
Fig. 1. Geographic distribution and global ancestry deconvolution of individuals from the BIG initiative.
a Overview of data collected across four sites in Tennessee, US. b Global ancestry deconvolution of 13,152 sequenced individuals, based on RFMix and using reference populations in the 1000 Genomes and Human Genome Diversity Project (HGDP) data sets. Each vertical bar represents one individual, colors are proportional to inferred ancestry. For further analyses, individuals were grouped based on the ancestry proportions in seven categories (colored bar, number of individuals per category in parentheses), and classified as admixed or not (black and gray bar) as described in the text. c Proportion of individuals corresponding to each ancestry stratified by the zip code. Some colors might not be visible, see supplementary Fig. 3 or table for details. d Prevalence of ancestries by zip code - EUR: European; AFR: African; EAS: East-Asian; AMR: Indigenous-American. Maps were produced with the leaflet package (v. 2.2.1) using GeoJSON data for state ZIP-code boundaries publicly available.
Fig. 2
Fig. 2. Prevalence of diseases common in health disparities populations.
a Number of cases stratified by inferred ancestry categories. b Odds ratios for asthma, diabetes, hypertension, and obesity compared to odds ratio of two hundred random diseases, observed among individuals self-identifying as belonging to non-White racial groups (n = 6374) versus White racial groups (n = 6115). The `Other diseases' reference represents a meta-analysis of the randomly selected diseases using the Mantel-Haenszel method. Error bars indicate 95% confidence intervals calculated using log odds ratio and its standard error. c Prevalence of obesity and asthma by zone. Data are presented as prevalence (proportion) with 95% confidence intervals (error bars) calculated using the Wald method. d The map displays zones color-coded by prevalence levels in locations with more than 100 total individuals. The Memphis Metropolitan area, characterized by high population density, is zoomed in. Maps were produced with the leaflet package (v. 2.2.1) using GeoJSON data for state ZIP-code boundaries publicly available.
Fig. 3
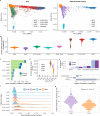
Fig. 3. Genetic variability and genetic burden in the BIG cohort.
a Joint principal component analysis of genetic data from individuals in the BIG and in the 1000 Genomes populations, represented separately for clarity. Colors represent inferred genetic ancestry. The first two principal components explain 76% of the variance captured by the first 20 PCs. b Number of variable sites per genome compared to the reference sequence as a function of inferred ancestry. c Estimate of the number of novel variants by individuals per ancestry with indication of variants private to the ancestry (d) Count of rare novel variants by ancestry segments. Individuals in admixed groups are represented twice (e) Proportion of known and novel variants across different impact categories (top panel). Data are presented as ratios of variant counts to total variants, with known variants (n = 6,114,914) in light blue and novel variants (n = 771,717) in purple. The bottom panel shows logistic regression coefficients comparing the likelihood of variants being novel across impact categories, with MODIFIER serving as the reference level. Error bars represent 95% confidence intervals. Asterisks indicate statistical significance (***p < 0.001). Detailed statistics from this logistic regression analysis are presented in Supplementary Table 3. f Rare deleterious-to-synonymous variant ratio across inferred ancestries. The peaks and spreads of these distributions highlight variation in the frequency of deleterious mutations across ancestries, reflecting potential differences in genetic diversity, mutation load, and evolutionary pressures. g Count of rare deleterious variants in EUR-AMR admixed individuals (n = 426), which have the highest deleterious-to-synonymous ratio. Variant counts are assigned based on the inferred ancestry of the genomic regions where they are found. This means individuals are counted twice: once for their AMR ancestry regions and once for their EUR ancestry regions. Statistical comparison was performed using a two-sided Wilcoxon rank-sum test with exact p-value = 2.2e-16. No adjustments were made for multiple comparisons.
Fig. 4
Fig. 4. Poor alignment between self-reported race and genetic ancestry.
a Counts of individuals per inferred ancestry (left) and self-reported race (right). b Genome segments shared Identical By Descent (IBD) in centimorgans (cM) between all individual pairs in BIG, categorized by whether individuals self-reported the same or different race. In some instances, individuals who self-report as belonging to different races are related at the third-degree level (e.g., first cousins) or even as close as second-degree relatives (e.g., half-siblings), as indicated by the IBD analysis. c IBD genome sharing and inferred ancestry among individuals self-reporting the same race (color-coded). In some cases, the self-reported race of a pair deviates from the patterns observed in other pairs within the same ancestry category.

References

    1. Van Hout, C. V. et al. Whole exome sequencing and characterization of coding variation in 49,960 individuals in the uk biobank. Nat. Commun.11, 1–11 (2020). - PMC - PubMed
    1. Kyriazis, C. C. et al. Human genetic diversity and disease: from outside africa to within europe. Commun. Biol.6, 353 (2023). - PubMed
    1. Sabeti, P. C. & Reich, D. Genetic and archeological evidence for early human population structure. Cell179, 1462–1474 (2019).
    1. Sirugo, G., Williams, S. M. & Tishkoff, S. A. The missing diversity in human genetic studies. Cell177, 26–31 (2019). - PMC - PubMed
    1. Fatumo, S. et al. A roadmap to increase diversity in genomic studies. Nat. Med.28, 243–250 (2022). - PMC - PubMed

LinkOut - more resources