. 2025 May 22;16(1):4770.
doi: 10.1038/s41467-025-60074-z.

Glioma-neuronal circuit remodeling induces regional immunosuppression

Affiliations

Glioma-neuronal circuit remodeling induces regional immunosuppression

Takahide Nejo et al. Nat Commun. .

Abstract

Neuronal activity-driven mechanisms influence glioblastoma cell proliferation and invasion, while glioblastoma remodels neuronal circuits. Although a subpopulation of malignant cells enhances neuronal connectivity, their impact on the immune system remains unclear. Here, we show that glioblastoma regions with enhanced neuronal connectivity exhibit regional immunosuppression, characterized by distinct immune cell compositions and the enrichment of anti-inflammatory tumor-associated macrophages (TAMs). In preclinical models, knockout of Thrombospondin-1 (TSP1/Thbs1) in glioblastoma cells suppresses synaptogenesis and glutamatergic neuronal hyperexcitability. Furthermore, TSP1 knockout restores antigen presentation-related genes, promotes the infiltration of pro-inflammatory TAMs and CD8 + T-cells in the tumor, and alleviates TAM-mediated T-cell suppression. Pharmacological inhibition of glutamatergic signaling also shifts TAMs toward a less immunosuppressive state, prolongs survival in mice, and shows the potential to enhance the efficacy of immune cell-based therapy. These findings confirm that glioma-neuronal circuit remodeling is strongly linked with regional immunosuppression and suggest that targeting glioma-neuron-immune crosstalk could provide avenues for immunotherapy.


Conflict of interest statement

Competing interests: The authors declare no competing interests.

Figures
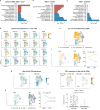
Fig. 1
Fig. 1. Distinct immune-related gene expression programs and tumor-associated macrophage compositions in functionally connected intratumoral regions of human glioblastoma.
ac Bar plots summarizing the results of gene set enrichment analyses (GSEA) with MSigDB Hallmark collection comparing HFC vs. LFC within tumor cells (a), myeloid cells (b), and lymphoid cells c. Statistical values are shown in each figure as normalized enrichment scores (NES) and adjusted p values. Positive and negative NES values indicate upregulation (shown in red) and downregulation (shown in blue) in HFC compared with those from LFC regions. The top six upregulated and downregulated signatures are presented. Complete results of the GSEA are provided in Supplementary Data 1. d Feature plots showing the expression patterns of representative marker genes used for the cell annotations. UMAP plots showing the relative compositions of pro-inflammatory, anti-inflammatory, or undetermined subpopulation in the entire myeloid cell population (e), and within those isolated from intratumoral regions with HFC and LFC f. The percentages of each subpopulation within each region are shown on the right. g Feature plots highlighting the distributions of the Mg-TAM and Mo-TAM signature scores. h UMAP plots showing the relative compositions of Mg-TAMs and Mo-TAMs within those isolated from intratumoral regions with HFC and LFC (left), and their percentages within each region are shown in the line plot (right). i Feature plots and violin plots showing the distributions of TSP1 gene expression in Mg-TAMs and Mo-TAMs. p values were calculated using a two-sided Fisher’s exact test f, h. For details on statistical tests used in ac and i, see “Methods”. Source data are provided as a Source Data file.
Fig. 2
Fig. 2. Spatial transcriptomic analyses reveal the inverse association between neuro-synaptic activities and immune regulation.
ac Spatial transcriptomic analysis of a representative human glioblastoma case (sample name: 260_T). a Histological images (H&E) of the specimen. b Surface plots showing the distribution of the CNA index. c Surface plots displaying gene set enrichment signature scores for Postsynaptic Neurotransmitter Receptor Activity (GO:MF), TNFα-Signaling via NFκB, IFNγ Response, and Inflammatory Response (all from Hallmark) within the entire specimen. Scatter plots display the correlations between the scores of Post-synaptic Neurotransmitter Receptor Activity and the other pathways. di Spatial transcriptomic analysis of a representative murine glioblastoma preclinical model (SB28 #1). d Histological images (H&E). Surface plots show the distribution of the gene set enrichment scores for Verhaak Glioblastoma Mesenchymal (“GBM-MES” [C2:CGP]) (e) and Neuronal System (Reactome) f. g Scatter plot showing the relationship between GBM-MES and Neuronal System scores across the entire data set, where the spots with upper 10–30 percentiles of GBM-MES scores and lower 10–30 percentiles of Neuronal Systems (Reactome) scores are highlighted in blue. h Surface plot showing “putative glioma-neuronal infiltration areas” defined based on the distribution of GBM-MES and Neuronal Systems scores. i Surface and scatter plots equivalent to (c) in the SB28 tumor-bearing mouse brain. p values were calculated using Pearson’s correlation test (two-sided) (c) and Spearman’s correlation test (two-sided) i. r correlation coefficient. Source data are provided as a Source Data file.
Fig. 3
Fig. 3. TSP1-KO reduces glioma-associated neuronal hyperexcitability.
a Scatter plot illustrating differential gene expression among three RNA sequencing datasets: SB28 (GSE127075), GL261 (GSE94239), and normal murine brain (E-MTAB-6081). Thbs1 is highlighted in red. b Representative confocal images of neonatal mouse cortical neurons (mCN) co-cultured with SB28-TSP1-WT or KO cells for 24 h, showing synaptic puncta colocalization (yellow arrows). Green, synapsin-1 (pre-synaptic); red, Homer-1 (post-synaptic); white, MAP2 (neurons); cyan, GFP (SB28 cells); blue, DAPI. Scale bar, 10 µm. The bar plot quantifies colocalized pre- and post-synaptic puncta on neurites from 12 fields (135 µm × 135 µm) per group across 3 experiments (mean: 1.23 [WT] vs. 0.56 [KO] per 10 µm neurite; p = 0.004). c Representative GCaMP calcium imaging traces of neonatal mouse cortical neurons alone (mCN only [top]) or co-cultured with SB28-TSP1-WT (middle) or KO (bottom) cells. d Bar plots comparing calcium imaging data across the three conditions, quantifying synchronized neuronal activity as calcium events per neuron (regions of interest [ROIs]: n = 5 for mCN only, n = 8 for mCN + WT, n = 7 for mCN + KO). e Enrichment plots and volcano plots summarizing GSEA with the gene set Synaptic Transmission Glutamatergic (GO:BP). Positive normalized enrichment scores (NES) indicate upregulation in WT tumors vs. KO. In volcano plots, gene set members are highlighted, leading-edge genes are labeled, and genes exceeding log2FC or adjusted p value thresholds are shown at the edges. f Representative traces of spontaneous excitatory postsynaptic currents (EPSCs) from pyramidal neurons identified in mouse cortical layers 5 and 6 (L5/6) near GFP-positive TSP1-WT or KO tumor lesions (400 to 800 μm in distance). g Cumulative frequency distributions of inter-event intervals (IEIs) from the same datasets as Supplementary Fig. 15b (WT: n = 2938 events; KO: n = 1315 events). p values were calculated using the two-sided Welch’s unpaired t-test (b), one-way analysis of variance (ANOVA) with Tukey’s post hoc test (d), and the two-sided Kolmogorov-Smirnov (K-S) test g. For details on statistical tests used in (e), see “Methods”. Data are mean ± s.e.m. b, d. FC fold change, NS not significant. Source data are provided as a Source Data file.
Fig. 4
Fig. 4. TSP1-KO alleviates glioma immunosuppression.
Enrichment plots and volcano plots summarizing GSEA with the gene sets Interferon Signaling (Reactome) (a) and TNF-mediated Signaling Pathway (GO:BP) b. Negative normalized enrichment scores (NES) indicate downregulation in WT tumors vs. KO. In volcano plots, gene set members are highlighted, leading-edge genes are labeled, and genes exceeding log2FC or adjusted p value thresholds are shown at the edges. c Flow cytometry of brain-infiltrating leukocytes (BILs) using a tumor-associated macrophage (TAM)-related marker panel in mice with SB28-TSP1-WT or KO tumors. Representative contour plots show CD86+CD206− “pro-inflammatory” and CD86−CD206+ “anti-inflammatory” populations within CD45+CD11b+F4/80+ TAMs. Box plot shows the ratio of CD86+/CD206− to CD86−/CD206+ populations (n = 5 mice per group; p = 0.01; mean, 0.58 [WT] vs. 1.34 [KO]). Values in contour plots are percentages of gated populations. The box plot shows the median (center line), interquartile range (box limits), and minimum and maximum values (whiskers). d Histogram and bar plot summarizing the suppressive effect of TAMs on CD8+ T-cell proliferation. CD11b+ BILs were isolated from mice with SB28-TSP1-WT (n = 5) or KO (n = 4) tumors and co-cultured for 72 h with carboxyfluorescein succinimidyl ester (CFSE)-labeled T-cells isolated from a non-tumor-bearing mouse. The histograms show the peak distributions of CFSE signals in positive (PC) and negative controls (NC) and representative samples from WT and KO groups. The bar plot displays the percentages of proliferating T-cells. e Flow cytometry of BILs from mice with SB28-TSP1-WT or KO tumors, using a T-cell-related marker panel. Representative contour plots distinguish CD8+ and CD4+ populations within CD45+CD3+ T-cells. The bar plot shows the percentages of CD8+ T-cells identified in each sample (n = 4 mice per group; p = 0.01; mean: 21.4% [WT] vs. 71.5% [KO]). p values were calculated using the two-sided Welch’s unpaired t-test (ce). For details on statistical tests used in (a) and (b), see “Methods”. In bar plots, data are mean ± s.e.m. d, e. Source data are provided as a Source Data file.
Fig. 5
Fig. 5. TSP1-mediated immunosuppression and therapeutic implications of targeting glutamatergic excitatory signals.
a Flow cytometry of brain-infiltrating leukocytes (BILs) using a tumor-associated macrophage (TAM)-related marker panel in perampanel (PER)-treated and untreated mice with SB28-TSP1-WT tumors. The data were analyzed and displayed as in Fig. 4c (n = 8 mice per group; p = 0.001; mean: 0.83 [Ctrl] vs. 1.63 [PER]). The box plot shows the median (center line), interquartile range (box limits), and minimum and maximum values (whiskers). b Histogram and bar plot summarizing the suppressive effect of TAMs on CD8+ T-cell proliferation. CD11b+ BILs were isolated from PER-treated and untreated mice with SB28-TSP1-WT tumors (n = 5 mice per group). The data were analyzed as in Fig. 4d. Data are mean ± s.e.m. c Kaplan–Meier survival curves of C57BL/6J mice orthotopically inoculated with SB28-TSP1-WT cells (10,000 cells/1 µL/mouse) and treated with PER (0.75 mg/kg), or vehicle control (Ctrl) via oral gavage, starting the day after tumor inoculation (n = 10 mice per group). d Schematic representation of interactions among glioblastoma cells, neurons, and immune cells, highlighting the key role of TSP1 in crosstalk and summarizing key findings from this study. p values were calculated using the two-sided Welch’s unpaired t-test (a, b) and the Log-rank test c. PC positive control, NC negative control, NS not significant. Source data are provided as a Source Data file. The figure was created in BioRender. Nejo (2025) https://BioRender.com/z1dmf4kd.

Update of

References

    1. Schaff, L. R. & Mellinghoff, I. K. Glioblastoma and other primary brain malignancies in adults: a review. JAMA329, 574–587 (2023). - PMC - PubMed
    1. Venkatesh, H. S. et al. Neuronal activity promotes glioma growth through neuroligin-3 secretion. Cell161, 803–816 (2015). - PMC - PubMed
    1. Venkatesh, H. S. et al. Targeting neuronal activity-regulated neuroligin-3 dependency in high-grade glioma. Nature549, 533–537 (2017). - PMC - PubMed
    1. Venkatesh, H. S. et al. Electrical and synaptic integration of glioma into neural circuits. Nature573, 539–545 (2019). - PMC - PubMed
    1. Pan, Y. et al. NF1 mutation drives neuronal activity-dependent initiation of optic glioma. Nature594, 277–282 (2021). - PMC - PubMed

MeSH terms

Substances