. 2025 May 22;11(1):84.
doi: 10.1038/s41522-025-00716-8.

Pathogenicity of commensal gut biofilm in prefrail aging

Affiliations

Pathogenicity of commensal gut biofilm in prefrail aging

Guillaume Le Cosquer et al. NPJ Biofilms Microbiomes. .

Abstract

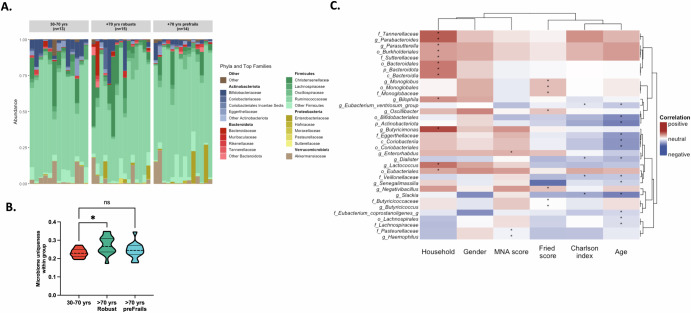
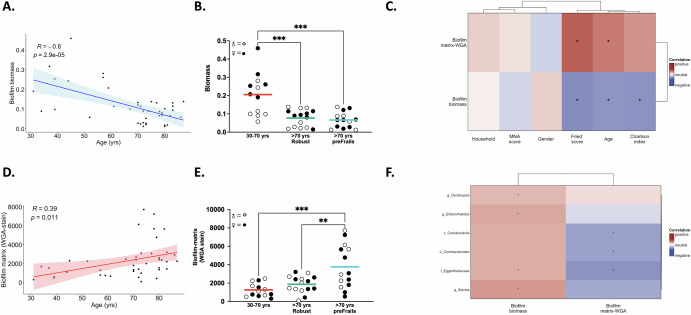
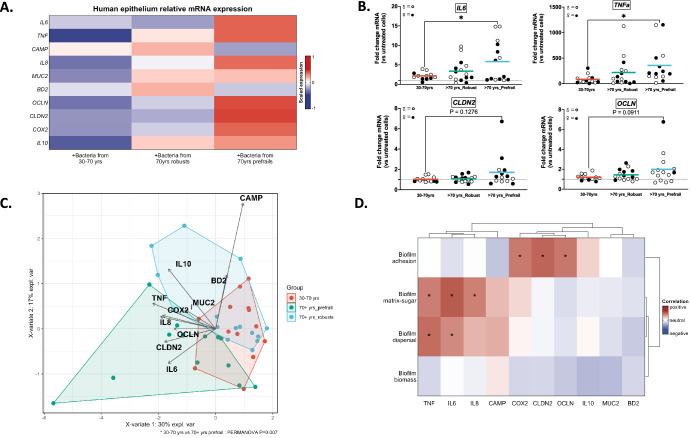
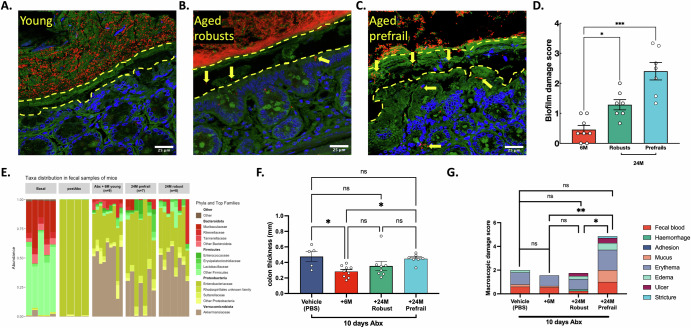
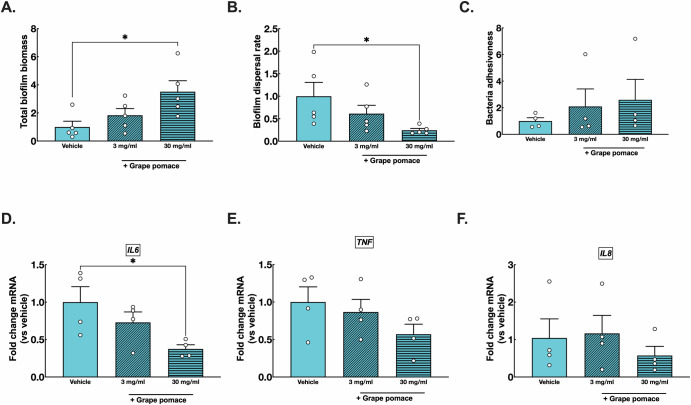
Pathophysiological mechanisms of unhealthy aging, particularly the transition from robustness to frailty, remain poorly understood. Despite extensive microbiome research on taxonomy, the behavior of early prefrail gut bacteria in their natural community-host mucosal tissue context remains unexplored. Using fecal samples from the INSPIRE-T aging human cohort, we characterized gut microbiota phenotype during prefrailty stages using a polymicrobial biofilm model. Results revealed that prefrail-derived biofilms exhibited distinct taxonomic and physical alterations, enhanced dispersal, and increased epithelial virulence compared to robust counterparts. Multiparametric analyses linked biofilm characteristics to clinical traits, suggesting their potential as aging status indicators. Polyphenol-rich grape pomace extract partially reversed prefrail biofilm alterations and reduced proinflammatory prefrail biofilm responses in vitro. Microbiota from prefrail-aged mice induced colon damage in antibiotic-treated recipients, establishing a prefrail microbiome-inflammation causality. Overall, the findings identified novel prefrail microbiome characteristics, established causal inflammatory links, and supported microbiota-targeted geroprotective interventions for the prefrail populations.


Conflict of interest statement

Ethics: The INSPIRE cohort protocol ID NCT04224038 was approved by the French Ethical Committee located in Rennes (CPP Ouest V) in October 2019. Mice experimentation protocol has been approved by local ethic committee of Toulouse University and by the Ministry of Superior Education and Research under the agreement APAFIS2023060610225611. Competing interests: The authors declare no competing interests.

Figures

Fig. 1
Fig. 1. Taxonomic analyses of biofilms from human aging cohort.
Fecal microbiota cultured in vitro on a polymicrobial anaerobic biofilm model underwent 16S rRNA V3-V4 gene sequencing. The study groups include individuals aged 30–70 years (n = 13), individuals aged 70 years and above characterized as healthy aging (robust, n = 15) and +70 years prefrail (n = 14). A The stacked bar plots illustrate the relative abundance of the five major Phyla and their top five most abundant Families. Each individual is depicted as a separate bar plot, highlighting taxonomic variations. B For each individual, the average of the lowest values from four different beta-diversity matrices (Bray–Curtis, Jaccard, unifrac, and weighted unifrac) represented individual uniqueness. Statistical significance was determined by ANOVA followed by Tukey’s for multiple comparisons, where P < 0.05 was considered significant (* for P < 0.05, *** for P < 0.0010). C Heatmap represents Kendall’s correlation coefficients between biofilm taxa counts and clinical parameters from human donors. Clinical parameters include discrete and continuous clinical features: household (1: solo 2: with a partner), gender (1: male, 2: female), MNA score, Charlson index, age, and Fried Frailty Index. The color gradient from blue to red signifies negative to positive correlations, and * corresponds to Kendall’s P value < 0.05. For enhanced clarity, the heatmap was filtered to include only significantly positive or negative correlations (P < 0.05).
Fig. 2
Fig. 2. Prefrailty associated microb-aging is linked with physical alterations of human biofilms.
Feces from individuals aged 30–70 years, 70+ years robust, and 70+ years prefrail, were cultured in vitro as a polymicrobial anaerobic biofilm. A, B The total biofilm biomass and D, E the total sialic acid/N-acetylglucosamine glycoproteins content of extracellular biofilm matrix were measured with WGA stain. AD Pearson correlation relationship between biofilm measures (biomass in A, WGA-matrix in D) and donor’s age is presented. Shaded area around the regression line represents the 95% confidence interval. BE Scatter plots depict for each individual’s its corresponding value of biofilm biomass (B) and biofilm WGA-matrix (E) and were grouped for each three cohort of individuals. B, E each dot is the average value of an individual donor biofilm (at least 12 replicates). The gender of each donor is indicated using open(male)/filled(female) circles. Statistical significance was determined by ANOVA followed by Tukey’s for multiple comparisons, where P < 0.05 was considered significant. CF Heatmaps represent Kendall (F) or Pearson (C) correlation coefficients between biofilm physical structure and clinical data (C) or biofilm taxa counts (F). Clinical parameters include discrete and continuous clinical features: household (1: solo 2: with a partner), gender (1: male, 2: female), MNA score, Charlson index, age, and Fried Frailty Index. The color gradient ranges from blue (negative) to red (positive) correlations, with statistically significant associations (P < 0.05) marked with *. For enhanced clarity, the heatmap in (F). was filtered to include only taxa rank with significantly positive or negative correlations (P < 0.05).
Fig. 3
Fig. 3. Prefrailty associated microb-aging is linked with pathogenic traits of human biofilms.
Feces from individuals aged 30–70 years, 70+ years robust, and 70+ years prefrail, were cultured in vitro as a polymicrobial anaerobic biofilm. A, B The rate of dispersal of planktonic bacteria, biofilm-dispersed bacteria, during a 24-hour period from biofilms was measured. Raw values were normalized to the average dispersal rate of the 30–70 years group. D, E Normalized counts of biofilm-dispersed bacteria were cultured on the apical surface of the human Caco2/HT29MTX monolayer. After a 4-hour coculture, the number of bacteria adhered to the epithelium was quantified. AD Pearson correlations between biofilm rate of dispersal (A) or adhesiveness (D) with the age of donors are presented. (BE) Scatter plots depict for each individual’s its corresponding value of biofilm dispersal rate (B) or adhesiveness (E) and were grouped for each three cohort of individuals. B, E each dot is the average value of an individual donor biofilm (at least 12 replicates). The gender of each donor is indicated using open(male)/filled(female) circles. Statistical significance was determined by ANOVA followed by Tukey’s for multiple comparisons, where P < 0.05 was considered significant. CF Heatmaps represent Kendall (F) or Pearson (C) correlation coefficients between biofilm pathogenic traits and clinical data (C) or biofilm taxa counts (F). Clinical parameters include discrete and continuous clinical features: household (1: solo 2: with a partner), gender (1: male, 2: female), MNA score, Charlson index, age, and Fried Frailty Index. The color gradient ranges from blue (negative) to red (positive) correlations, with statistically significant associations (P < 0.05) marked with *. For enhanced clarity, the heatmap in F was filtered to include only taxa rank with significantly positive or negative correlations (P < 0.05).
Fig. 4
Fig. 4. Increased host epithelial inflammatory response to prefrailty-associated human biofilms.
After coculture with a normalized amount of biofilm-dispersed bacteria, epithelial cells were collected for RNA extraction. A The heatmap represents scaled relative expression of a targeted list of host response genes. Specifically, these genes are involved in innate inflammatory signaling (IL6, TNF, IL8, IL10, COX2, and BD2), secretion (BD2 and MUC2), and tight junction function (OCLN and CLDN2). The color gradient from blue to red corresponds to the scale of relative mRNA expression. B Scatter plot depicts relative mRNA expression of IL6, TNF, CLDN2 and OCLN for each individual’s and were grouped for each three cohort of individuals. The gender of each donor is indicated using open (male)/filled (female) circles. Dotted line at 1 corresponds to basal mRNA expression in wells without bacteria. Statistical significance was determined by ANOVA followed by Tukey’s for multiple comparisons, where P < 0.05 was considered significant. C Gene expression dataset was ordinated using Partial least squares-discriminant analysis (PLS-DA) with its corresponding loading vectors. Pairwise PERMANOVA revealed statistical differences between the group of 30–70 years and +70 years prefrail (P = 0.007). D The heatmap corresponds to Pearson correlation coefficients between host epithelial gene response and biofilm features. The color gradient from blue to red signifies negative to positive correlations, and * corresponds to Pearson P value < 0.05.
Fig. 5
Fig. 5. Prefrailty aging in mice is linked with altered gut biofilm and emergence of pathogenic behavior when transferred into recipient mice.
AC Using 16S fluorescent in situ hybridization, we visualized tissue-associated microbiota in the distal colon of young (6 months, 6 M, n = 8, A), aged (24 months, 24 M) robust (n = 7, B), and aged prefrail (n = 7, C) mice. Representative images are presented with blue is DAPI staining for host nuclei, green is fluorescein-coupled wheat germ agglutinin for glycoproteins-rich content (e.g., mucus layer), and red is the 16S-Cyanine3 probe for all bacteria. Dashed lines represent the limits of mucosal tissue and the “inner mucus layer”. Arrows highlight areas of interest. Scale bars are 25 µm. D Biofilm-damage scores were calculated for the three groups of mice, with dots representing the mean score from at least 3 fields per animal. EG C57Bl/6 animals (8 weeks old) were previously exposed to 10-day antibiotics and underwent oral gavage with either vehicle (PBS, n = 5), or with feces from young (6 M, n = 9), aged robust (24 M robust, n = 8), and aged prefrail (24 M prefrail, n = 7) mice. E Four days after inoculation, feces were collected for microbial taxonomy assessment using 16S rRNA V3-V4 gene sequencing. Colons were harvested for (F) parietal thickness measurement and (G) macroscopic damage score. D, F, G Bar plots correspond to mean value per group ±SEM. Statistical significance was determined by ANOVA followed by Dunnett’s test for multiple comparisons, where P < 0.05 was considered significant (* for P < 0.05, ** for P < 0.01).
Fig. 6
Fig. 6. Positive impact of grape pomace on prefrailty-associated human biofilm structure and virulence.
Polymicrobial anaerobic biofilms were generated from human feces of prefrails individuals aged >70 yrs, n = 4–5 per group) and exposed to grape pomace diluted in microbial broth at concentrations of 3–30 mg/ml for 24 hours. A Total biomass was evaluated using safranin-O stain, and the data are presented as the fold change of mean biomass from control prefrail biofilms (broth media). B The rate of dispersal for each biofilm was evaluated as a ratio between the amount of biofilm-dispersed bacteria and biofilm biomass previously assessed. C Normalized counts of biofilm-dispersed bacteria were cultured on the apical surface of the human Caco2/HT29MTX monolayer. After a 4-hour coculture, the number of bacteria adhered to the epithelium was quantified by plating and was represented as fold change of vehicle-treated biofilms (broth media). DF Dispersed bacteria were collected from biofilms previously exposed to grape pomace. Human intestinal epithelial cell lines (Caco2 and HT29MTX, at a 3:1 ratio) were then exposed to these bacteria for 4 hours, and mRNA expression of IL6 (D), TNF (E), and IL8 (F) genes was assessed. AC Bar plots corresponds to average value ± SEM of 12 biofilm replicates from human donors (represented as individual dots). DF Bar plots corresponds to average value ± SEM of relative mRNA expression of vehicle control group (n = 4 human donors). Statistical significance was determined by ANOVA followed by Dunnett’s for multiple comparisons, where P < 0.05 was considered significant and * for P < 0.05 and *** for P < 0.001.

References

    1. World Health, O. Decade of healthy ageing: baseline report. (World Health Organization, 2020).
    1. Fried, L. P. et al. Frailty in older adults: evidence for a phenotype. J. Gerontol. A Biol. Sci. Med. Sci.56, M146–M156 (2001). - PubMed
    1. Romero-Ortuno, R. & Kenny, R. A. The frailty index in Europeans: association with age and mortality. Age Ageing41, 684–689 (2012). - PMC - PubMed
    1. Sierra, F. The emergence of geroscience as an interdisciplinary approach to the enhancement of health span and life span. Cold Spring Harb. Perspect. Med.6, a025163 (2016). - PMC - PubMed
    1. Ghosh, T. S., Shanahan, F. & O’Toole, P. W. The gut microbiome as a modulator of healthy ageing. Nat. Rev. Gastroenterol. Hepatol.19, 565–584 (2022). - PMC - PubMed

LinkOut - more resources