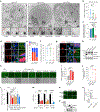
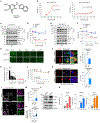
. 2025 Jun;10(6):1501-1520.
doi: 10.1038/s41564-025-02018-3. Epub 2025 May 22.

Kaposi's sarcoma-associated herpesvirus induces mitochondrial fission to evade host immune responses and promote viral production

Affiliations

Kaposi's sarcoma-associated herpesvirus induces mitochondrial fission to evade host immune responses and promote viral production

Qing Zhu et al. Nat Microbiol. 2025 Jun.

Abstract

Mitochondrial dynamics are pivotal for host immune responses upon infection, yet how viruses manipulate these processes to impair host defence and enhance viral fitness remains unclear. Here we show that Kaposi's sarcoma-associated herpesvirus (KSHV), an oncogenic virus also known as human herpesvirus 8, encodes Bcl-2 (vBcl-2), which reprogrammes mitochondrial architecture. It binds with NM23-H2, a host nucleoside diphosphate (NDP) kinase, to stimulate GTP loading of the dynamin-related protein (DRP1) GTPase, which triggers mitochondrial fission, inhibits mitochondrial antiviral signalling protein (MAVS) aggregation and impairs interferon responses in cell lines. An NM23-H2-binding-defective vBcl-2 mutant fails to evoke fission, leading to defective virion assembly due to activated MAVS-IFN signalling. Notably, we identify two key interferon-stimulated genes restricting vBcl-2-dependent virion morphogenesis. Using a high-throughput drug screening, we discover an inhibitor targeting vBcl-2-NM23-H2 interaction that blocks virion production in vitro. Our study identifies a mechanism in which KSHV manipulates mitochondrial dynamics to allow for virus assembly and shows that targeting the virus-mitochondria interface represents a potential therapeutic strategy.


Conflict of interest statement

Competing interests: C.L., Q.Z. and R.M. are inventors of provisional patent 63/693,000, assigned to The Wistar Institute, and claiming compositions and methods disclosed herein. The other authors declare no competing interests.

Figures

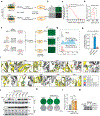
Extended Data Fig. 1 |
Extended Data Fig. 1 |. KSHV vBcl-2 targets NM23-H2 independently of inhibition of autophagy and apoptosis.
a, Co-immunoprecipitation (co-IP) of vBcl-2 with NM23-H2 in HEK293T cells co-transfected with HA-vBcl-2 and Flag-NM23-H2. Actin serves as a loading control. b, Co-IP of endogenous NM23-H2 with vBcl-2 in HEK293T cells expressing empty vector (Vec) or HA-vBcl-2. c, Schematic of WT vBcl-2 and deletion mutants, with binding to NM23-H2 determined by co-IP of Flag-NM23-H2 with HA-vBcl-2 in HEK293T cell lysates. BH (Bcl-2 homology) domains and the conserved 84W85G86R residues in BH1 domain are highlighted. TM, transmembrane domain. +, strong binding; −, no binding. d, Co-IP of Flag-tagged NM23-H2 with HA-tagged wild-type (WT) or mutant vBcl-2 in HEK293T cells. The binding results are summarized in c. e, IB analysis of LC3-I/LC3-II and p62 in HEK293T cells stably expressing Vec or HA-vBcl-2 (WT or mutants) with or without Torin 1 (50 nM, 3 h). f, Densitometric quantification of LC3-II/LC3-I (red bars) and p62/actin (blue) from e. n = 3. g, Flow cytometry analysis of apoptosis in HEK293T cells stably expressing Vec or HA-vBcl-2 (WT or mutants) treated with TNF-α (10 ng/ml) and CHX (5 μg/ml) for 4 h. Early apoptotic cells (Annexin V-positive and PI-negative) were quantified (n = 3). Data in a,b,d,e are from one experiment that is representative of three independent experiments. See Source Data for uncropped data of a,b,d,e. Data shown in f,g are mean ± s.d. analyzed by one-way ANOVA followed by Tukey’s post hoc test for comparisons among multiple groups. *, p < 0.05; **, p < 0.01; ****, p < 0.0001; ns, not significant. Exact P values are provided in Source Data Extended Data Fig. 1.
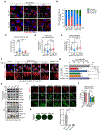
Extended Data Fig. 2 |
Extended Data Fig. 2 |. vBcl-2 interaction with NM23-H2 is required for infectious virion production.
a, Experimental schematic to assess vBcl-2 knockout (KO) effects on KSHV reactivation. iSLK-BAC16.vBcl-2 WT and iSLK-BAC16-vBcl-2 KO cells were induced (Dox/NaB, 60-72 h), and supernatants infected naïve SLK cells for 24 h (results in b-d). b, Bright field (BF) and GFP images of SLK cells infected with virus from induced iSLK-BAC16 cells. Scale bars, 50 μm. c,d, Virus titres determined by two-fold serial dilution of supernatants collected 72 h post-reactivation (a) and quantification of GFP-positive SLK cells per well by flow cytometry at 24 h post-infection (c), expressed as infectious units/ml (d). e, Schematic for assessing vBcl-2 KO impact on KSHV de novo infection in HCT116 cells infected with vBcl-2 WT or vBcl-2 KO KSHV at MOI = 10, and supernatant collected were used to infect SLK cells for 24 h (results in f-h). f, GFP images of SLK cells infected in e. Scale bars, 430 μm. g, Flow cytometry analysis of GFP-positive SLK cell percentages and mean fluorescence intensity from e. h, qPCR analysis of viral genome copies in supernatants from e. (n = 3 independent experiments). i, Close-up view of site variations between NM23-H2 (yellow) and -H1 (cyan) in the structural model of NM23-H2 and vBcl-2. The corresponding residues of NM23-H2 and NM23-H1 are shown in stick. The ΔG for the hydrogen (H)-bonding interactions of NM23-H2 Q50 was noted, which was lost when Q50 was replaced by E50. j, Co-IP of Flag-NM23-H2 (WT/mutant) with HA-vBcl-2 in HEK293T cells. k-m, iSLK-BAC16.vBcl-2 WT cells transduced with ctrl or NM23-H1 shRNA induced as above and supernatants infected SLK cells. GFP/BF images are shown in k, virus titer determined in l (n = 3), and protein expression shown in m. Data in j,m are representative of three independent experiments (see Source Data for uncropped data). Data in d,h,l are mean ± s.d. analyzed by two-tailed Student’s t test and one-way ANOVA with Tukey’s post hoc test. *, p < 0.05; **, p < 0.01; ****, p < 0.0001. ns, not significant. Exact P values are provided in Source Data Extended Data Fig. 2.
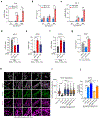
Extended Data Fig. 3 |
Extended Data Fig. 3 |. KSHV vBcl-2 regulates NM23-H2 activities.
a, IB (top) and densitometric quantification (bottom) of NM23-H2 stability in cells transduced with Vec or HA-vBcl-2 (WT/E14A) and treated with CHX (n = 3). b, Coupled pyruvate kinase-lactate dehydrogenase assay (Methods) showing vBcl-2-driven NDPK activity of recombinant NM23-H2 preincubated with GST-vBcl-2 (WT/E14A) or Vec (n = 3 independent experiments). c, in vitro assay showing that increasing amount of recombinant GST-vBcl-2 (WT or E14A) modulate histidine phosphorylation of purified His-NM23-H2 in the presence of ATP, detected by IB with anti-1-pHis antibody. Coomassie blue staining shows input of each purified proteins as indicated. d, Densitometric quantification of 1-pHis levels in (c) normalized to NM23-H2 input (n = 3 independent experiments). e-g, Representative confocal images of in HeLa cells (e) co-transfected with HA-vBcl-2 and Flag-NM23-H2 showing the distributions of vBcl-2 (green) and NM23-H2 (red) relative to organelle markers (magenta), including PDI (ER), TGN46 (trans-Golgi), TOM20 (mitochondria), and WGA (wheat germ agglutinin; plasma membrane). Scale bars, 10 μm. The percentage of vBcl-2 overlapping with each marker (f) and vBcl-2 colocalization with NM23-H2 (g) were quantified (n = 50 cells pooled from three independent experiments). Data in a,c,e are from one experiment that is representative of three independent experiments. See Source Data for uncropped data of a,c. Data in a,b,d represent mean ± s.d. analyzed by one-way ANOVA followed by Tukey’s post hoc test. Box-plot data in f,g are presented as median (center line), interquartile range (IQR; box, 25th to 75th percentiles), and whiskers extending from minimum to maximum values; and analyzed using Kruskal-Wallis with post hoc Dunn’s test. *, p < 0.05; **, p < 0.01; ***, p < 0.001; ****, p < 0.0001; ns, not significant. Exact P values are provided in Source Data Extended Fig. 3.
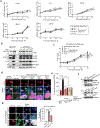
Extended Data Fig. 4 |
Extended Data Fig. 4 |. Characterization of the impacts of vBcl-2 on mitochondrial morphology.
a, Confocal micrographs of mitochondria in iSLK-BAC16.vBcl-2 WT/KO cells induced by Dox/NaB for indicated time and stained with MitoTracker (red) and DAPI (blue). b, Quantification of mitochondrial morphology (tubulated, intermediate, and fragmented) in a (n = 3, with 100 cells/experiment). c-e, Analysis of mitochondrial numbers per cell (c), mean area (d) and perimeter (e) in cells in a (n = 94 cells/group, 3 independent experiments). f,g, Confocal micrographs of mitochondria (red) in cells transduced with indicated shRNAs plus NM23-H2 rescue plasmids post-reactivation (f) with corresponding quantification of fragmentation (g; n = 3, 300 cells/sample). h, IB of the indicated mitochondrial fission and fusion factors in mitochondrial fractions and WCL from iSLK-BAC16.vBcl-2 KO cells stably expressing HA-vBcl-2 (WT/mutants) at 60 h post-reactivation. TOM20, control for mitochondrial fraction. GAPDH, a loading control for WCLs (see Source Data for uncropped WB). i, Confocal micrographs of mitochondria (TOM20, green) in iSLK-BAC16. vBcl-2 KO cells expressing mCherry-vBcl-2 (red) and transduced with Vec, an MFN2-encoding plasmid, or with Ctrl shRNA, DRP1 shRNA, MFF shRNAs at 60 h post- reactivation. j, Percentage of cells in (i) with mitochondrial fission was quantified (n = 3, with 100 cells/experiment). k, Infectious virus titer in cells in (i) with MFF depletion was quantified by infecting SLK cells (top, n = 3) and GFP images are shown (left). Scale bars, 10 μm. Data in a,f,h,i,k are from one experiment that is representative of three independent experiments. Data in b,g,j,k represent mean ± s.d. analyzed by one-way ANOVA followed by Tukey’s post hoc test. Box-plot data in c-e are presented as median (center line), interquartile range (IQR; box, 25th to 75th percentiles), and whiskers extending from minimum to maximum values; and analyzed using Kruskal-Wallis with post hoc Dunn’s test. ***, p < 0.001; ****, p < 0.0001; ns, not significant. Exact P values are provided in Source Data Extended Data Fig. 4.
Extended Data Fig. 5 |
Extended Data Fig. 5 |. Impacts of vBcl-2 on mitochondrial function and integrity.
a, Representative confocal micrographs (left) and quantification (right) of PINK1 (magenta) colocalization with TOM20 (green) in iSLK-BAC16. vBcl-2 KO cells expressing mCherry-vBcl-2 (red) at 60 h post-reactivation (n = 100 cells/sample, 3 independent experiments). Scale bars, 10 μm. b, Co-IP of vBcl-2 and endogenous NM23-H2 with DRP1 in HEK293T cells expressing NM23-H2 shRNA or Ctrl shRNA and transduced with Vec or HA-vBcl-2. c, Co-IP of indicated proteins in HEK293T expressing mCherry-vBcl-2 (WT/E14A). The relative amount of HA-NM23-H2 co-immunoprecipitated with DRP1 was normalized to total HA-NM23-H2 in WCL (right; n = 3 independent experiments). d, DRP1 GTPase activity in the presence/absence of purified NM23-H2, vBcl-2 (WT/E14A), and indicated nucleotides (n = 3 independent experiments). Data in a-c are representative of three independent experiments. See Source Data for uncropped data of b,c. Data in a,c,d are mean ± s.d. analyzed by one-way ANOVA with Tukey’s post hoc test. Exact P values are provided in Source Data Extended Data Fig. 5.
Extended Data Fig. 6 |
Extended Data Fig. 6 |. KSHV vBcl-2 attenuates MAVS-mediated IFN response.
a-c, RT-qPCR analysis of IFNB1 (a) and ISG15 (c) mRNA levels (normalized to 18S rRNA), and IFN-β production (b) in supernatant measured by ELISA in iSLK-BAC16.vBcl-2 WT and vBcl-2 KO cells induced with Dox/NaB for the indicated time. n = 3. d-f, RT-qPCR analysis of vBcl-2 transcripts (d, n = 3), IFNB1 transcripts (e, n = 3), and ISG15 transcripts (f, n = 3) in TREx BCBL-1-RTA cells transfected with two independent vBcl-2-specific siRNA for 12 h and induced with Dox (1 μg/ml) and Nab (1 mM) for 48 h. g, RT-qPCR of IFNB1 mRNA in HCT116 cells infected with vBcl-2 WT or vBcl-2 KO KSHV at 10 MOI for 60 h (n = 3). h, Representative STED micrographs of MAVS (magenta) and TOM20 (green) in iSLK-BAC16.vBcl-2 WT cells transduced with Ctrl vs. DRP1 shRNAs or NM23-H2 shRNAs at 60 h post-reactivation. Insets highlight MAVS distribution. Arrows indicate MAVS puncta and dotted lines denote clustering. Data are from one experiment that is representative of three independent experiments. i, Diameter of MAVS clusters measured from images in h (n = 100). j. RT-qPCR of ISG15 mRNA expression in h (n = 3). Data in a-g represent mean ± s.d. obtained from three independent experiments performed in triplicates, and analyzed by two-tailed t test (a-c) or one-way ANOVA followed by Tukey’s post hoc test (d-g). Box-plot data in i are presented as median (center line), interquartile range (IQR; box, 25th to 75th percentiles), and whiskers extending from minimum to maximum values; and analyzed using Kruskal-Wallis with post hoc Dunn’s test. *, p < 0.05; **, p < 0.01; ***, p < 0.001; ****, p < 0.0001; ns, not significant. Exact P values are provided in Source Data Extended Data Fig. 6.
Extended Data Fig. 7 |
Extended Data Fig. 7 |. The NM23-H2 binding-deficient vBcl-2 E14A mutant KSHV is defective in viral capsid assembly and nuclear egress during the late phase of lytic reactivation.
a, RT-qPCR of viral gene expression in iSLK-BAC16.vBcl-2 cells (WT and KO) stably expressing Vec, HA-vBcl-2 (WT/mutants) at indicated time post-reactivation with Dox/NaB (n = 3). b, IB of viral proteins in WCLs from (a) at 48 h post-reactivation. IE/E, immediate early and early genes; L, late genes. c, Relative viral genome copy number changes in cells from (a; n = 3). d, Representative confocal micrographs of ORF65 (red) in iSLK-BAC16. vBcl-2 WT cells expressing Ctrl shRNA, NM23-H2 shRNAs, or DRP1 shRNAs after 60 h Dox/NaB induction. iSLK-BAC16.vBcl-2 KO cells were included as a control. DAPI stains nuclei (blue). Green signals (GFP) mark virus-infected cells. e, Percentage of cells with cytoplasmic ORF65 in (d) was quantified (n = 3, with 100 cells/group). f, IB for ORF65, NM23-H2, and DRP1 expression in cells in (d). g, Confocal micrographs of ORF65 (red) in HCT116 cells infected with vBcl-2 WT or vBcl-2 KO KSHV at 10 MOI for 60 h (left). The percentage of cells with cytoplasmic ORF65 was quantified (right; n = 3, with 100 cells/group). Scale bars, 10 μm. Data in b,d,f,g are from one experiment that is representative of three independent experiments. See Source Data for uncropped data of b,f. Data shown in a,c,e,g represent mean ± s.d. analyzed by Student’s two-tailed t test or one-way ANOVA followed by Tukey’s post hoc test. ***, p < 0.001; ****, p < 0.0001; ns, not significant. Exact P values are provided in Source Data Extended Data Fig. 7.
Extended Data Fig. 8 |
Extended Data Fig. 8 |. Identification of IFN-induced antiviral factors that restrict vBcl-2-dependent capsid assembly and nuclear egress.
a, Representative confocal images of ORF65 staining in iSLK-BAC16.vBcl-2 KO cells transduced with ISG-specific shRNA as indicated. Scale bars, 10 μm. b, Quantification of the percentage of cells from (a) with cytoplasmic ORF65 staining (100 cells/experiment, n = 3). c, RT-qPCR validation of ISG knockdown in (a, n = 3). d,e, TRIM22 and MxB suppress infectious KSHV production. iSLK-BAC16.vBcl-2 KO cells were transduced with Ctrl or ISG-specific shRNA and induced with Dox/NaB for 72 h. Supernatants were harvested and infectious virus yield was determined by infecting SLK cells for 24 h. Representative GFP/BF images in SLK cells are shown (d). Scale bars, 430 μm. Virus yield was quantified as the percentage of GFP-positive SLK cells (e). DKD, double knockdown (n = 3). f, RT-qPCR analysis of TRIM22 and MxB mRNA in HCT116 cells infected with vBcl-2 WT or vBcl-2 KO KSHV at MOI = 10 for 60 h (n = 3). g-i, Confocal images of ORF65 staining in iSLK-BAC16.vBcl-2 WT/KO cells expressing TRIM22 and MxB post-reactivation. Percentage of cells with cytoplasmic ORF65 (h; n = 3, 300 cells/sample) and the percentage of cytoplasmic ORF65 per cell (i; n = 49 cells/sample) were quantified. Scale bars, 10 μm. Data in a,d,g are from one experiment that is representative of three independent experiments. Data in b,c,e,f,h represent mean ± s.d. analyzed by Student’s two-tailed t test or by one-way ANOVA followed by Tukey’s post hoc test. Scatter plots in i are analyzed with Kruskal-Wallis with post hoc Dunn’s test. *, p < 0.05; **, p < 0.01; ***, p < 0.001; ****, p < 0.0001; ns, not significant. Exact P values are provided in Source Data Extended Data Fig. 8.
Extended Data Fig. 9 |
Extended Data Fig. 9 |. VBNI-1 disrupts KSHV vBcl-2 interaction with NM23-H2 and impairs late stage KSHV lytic replication.
a, HTRF assay. His-NM23-H2 is bound by an anti-His-Tb HTRF donor fluorophore. GST-vBcl-2 is bound by an anti-GST-d2 HTRF acceptor. vBcl-2 binding to NM23-H2 produces FRET. The addition of small molecule inhibitor(s) reduces FRET. b, HTRF showing dose-dependent vBcl-2 binding to NM23-H2 (3 nM; red) or NM23-H1(25 nM; blue fitted by nonlinear regression. c, HTRF comparison of vBcl-2 binding to NM23-H2 vs. BID BH3 peptide in the presence of ABT-263; IC50 values indicated (n = 3). d-g, Co-IP of endogenous NM23-H2, Beclin1, and BAK with vBcl-2 in HEK293T cells expressing HA-vBcl-2 after VBNI-1 treatment at increasing doses for 36 h (d,e) or with VBNI-1 (2 μM) at increasing timepoints (f,g). Interactions with indicated binding partners were quantified in (e,g; n = 3). h, The effects of VBNI-1 on NM23-H1/H2 kinase activity measured by Transcreener ADP2-FI assay; inhibition curves with IC50 values shown. i, Docking model (left) shows the electrostatic surface of vBcl-2 harbouring VBNI-1 (sphere). Overlay (right) of vBcl-2-VBNI-1 with vBcl-2-NM23-H2 highlights potential steric clash between VBNI-1 and NM23-H2 interface residue K128. For clarity, the vBcl-2 molecule bound to VBNI-1 is not shown. j, SPR analysis of VBNI-1 interaction with vBcl-2 across concentrations. k, Cytotoxicity of VBNI-1 in SLK (blue) and BJAB (red) cells; median effective concentration (EC50) values indicated. l, Dose-dependent inhibition of KSHV production by VBNI-1 in reactivated iSLK-BAC16.vBcl-2 WT but not KO cells; EC50 values indicated. m-o, Virus production (m,n) and gene expression (o) following VBNI-1 treatment and indicated shRNA knockdowns post-reactivation. GFP/BF images shown in m; quantified in n (n = 3). Scale bars, 430 μm. Data in d,f,j,m are from one experiment that is representative of three independent experiments. See Source Data for uncropped data (d,f). Data in e,g,n,o represent mean ± s.d. analyzed by one-way ANOVA followed by Tukey’s post hoc test. **, p < 0.01; ****, p < 0.0001; ns, not significant. Exact P values are provided in Source Data Extended Data Fig. 9.
Extended Data Fig. 10 |
Extended Data Fig. 10 |. Schematic representation of the mechanistic action of vBcl-2 manipulation of mitochondrial dynamics for immune subversion and its therapeutic targeting by VBNI-1.
vBcl-2 interaction with host NM23-H2 allows for activation of DRP1-mediated mitochondrial fission, which reduces MAVS aggregation and dampens the downstream type I IFN response, leading to productive virion assembly and nuclear egress. This virus-host interaction can be specifically antagonized by VBNI-1. VBNI-1 blocks the late phase of viral assembly/egress and thwarts virion production through a mechanism that involves induced expression of the ISGs TRIM22 and MxB. See main text for details.
Fig. 1 |
Fig. 1 |. vBcl-2 interaction with NM23-H2 is required for KSHV virion production.
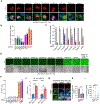
a, In vitro GST pull-down (GST PD) assay showing direct interaction between recombinant GST-vBcl-2 and NM23-H2, detected by immunoblotting (IB). Coomassie staining shows the input proteins. b,c, Co-immunoprecipitation (Co-IP) of endogenous NM23-H2 with vBcl-2 in whole-cell lysate (WCL) of BJAB cells stably expressing a vector (Vec) or HA-vBcl-2 (b), and in iSLK-BAC16.vBcl-2 WT cells treated (+) or untreated (−) with Dox and sodium butyrate (NaB) for 60 h (c). d, Co-IP of Flag-NM23-H2, Beclin 1 and BAK with HA-vBcl-2 (WT/mutants). e,f, iSLK-BAC16.vBcl-2 (WT/KO) cells stably expressing Vec or HA-vBcl-2 (WT/mutants) were treated with Dox/NaB for 72 h. Virus-containing supernatants were collected to infect naïve SLK cells. Representative GFP and bright-field (BF) images of SLK cells are shown (e, top) and vBcl-2 expression was detected by IB (e, bottom). Infectious titre was determined by flow cytometry for GFP-positive SLK cells (f, n = 3). g, Co-IP of Flag-NM23-H2 (WT/mutants) with HA-vBcl-2.LC, light chain. h–j, iSLK-BAC16.vBcl-2 WT cells transduced with control or NM23-H2 shRNA along with 3×HA-NM23-H2 rescue plasmids were Dox/NaB treated. Supernatants were collected to infect SLK cells and representative GFP/BF images are shown in h. Infectious titres were determined and are shown in i (n = 3). Protein expression is shown in j. Data in a–e, g, h and j are from one experiment that is representative of three independent experiments (see Source Data for uncropped western blot (WB) images). Data in f and i represent mean ± s.d. analysed using one-way ANOVA with Tukey’s post hoc test; ***P < 0.001, ****P < 0.0001; NS, not significant. Exact P values are provided in Source Data Fig. 1.
Fig. 2 |
Fig. 2 |. vBcl-2 activates and relocates NM23-H2 to mitochondria.
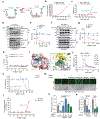
a,b, IB of Flag-NM23-H2 oligomers in HEK293T cells co-transfected with/without HA-vBcl-2 (WT/E14A) and treated with dimethylsulfoxide (DMSO) or disuccinimidyl suberate (DSS) (a). NM23-H2 multimers versus monomers were quantified (b; n = 3 independent experiments). c, Representative STED images of vBcl-2 (red), NM23-H2 (magenta) and TOM20 (green) in iSLK-BAC16.vBcl-2 KO cells expressing mCherry-vBcl-2 (WT/mutants) at 60 h post reactivation. Insets: vBcl-2/TOM20, vBcl-2/NM23-H2 and NM23-H2/TOM20 co-localization. White arrowheads indicate mitochondria-associated NM23-H2. Scale bars, 10 μm. d–f, Quantification of the fraction of NM23-H2 co-localized with TOM20 (d) or vBcl-2 (e), and vBcl-2 co-localization with mitochondria (f) in c (n = 30 cells per group, 3 independent experiments). g–j, IB of mitochondrial/cytosolic fractions (left) and WCL (right) from iSLK-BAC16.vBcl-2 KO cells stably expressing HA-vBcl-2 (WT/mutants) at 60 h post reactivation (g). S.E., short exposure; L.E., long exposure. Relative levels of mitochondrial NM23-H2 (h), cytoplasmic NM23-H2 (i) and mitochondrial vBcl-2 (j) in g are normalized to WCL protein levels (n = 3). k,l, PLAs of NM23-H2-TOM20 in iSLK.BAC16.vBcl-2 KO cells expressing HA-vBcl-2 (WT/mutants), 60 h post reactivation (k). DAPI, nuclei (blue). Insets: PLA puncta (white). PLA puncta per cell (normalized to total NM23-H2 levels) are quantified (l; n = 100 cells, 3 independent experiments). Data in b and h–j are presented as mean ± s.d. and analysed using one-way ANOVA with Tukey’s post hoc test. For boxplot data in d–f and l, the centre line represents the median, the box limits denote the interquartile range (IQR, 25th to 75th percentiles), and whiskers extend from minimum to maximum values; data analysed using Kruskal–Wallis with post hoc Dunn’s test; *P < 0.05, **P < 0.01, ****P < 0.0001. Exact P values are provided in Source Data Fig. 2. See Source Data for uncropped WB images of a and g.
Fig. 3 |
Fig. 3 |. vBcl-2 interaction with NM23-H2 induces DRP1-dependent mitochondrial fission.
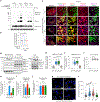
a, Confocal (top) and TEM (bottom) micrographs of mitochondria in cells expressing Vec or HA-vBcl-2 (WT/mutants) at 60 h post reactivation. Arrows denote fragmented mitochondria. b–d, Quantification of mitochondrial fragmentation from confocal images (b, n = 3, 300 cells per sample), and TEM analysis of mitochondrial length (c) and cristae frequency (d; normalized to length) (n = 36 mitochondria per sample). e–h, Confocal micrographs of mitochondria (e; top) in iSLK-BAC16.vBcl-2 cells expressing control (Ctrl) versus DRP1 shRNAs, Vec versus Flag-DRP1 K38A (green) or treated with Mdivi-1 post reactivation. Mitochondrial fragmentation was quantified in f (n = 3, 100 cells per sample). GFP images (e, bottom) depict virus yield, with titre quantified in g (n = 3) and protein expression indicated in h. i, Co-IP of proteins in cells expressing HA-vBcl-2 (WT/mutants). See Source Data for uncropped images. j–l, Immuno-EM (j) of mitochondrial (M) co-localization of NM23-H2 and DRP1 in iSLK-BAC16.vBcl-2 KO expressing vBcl-2 (WT/mutants). NM23-H2 clustered with DRP1 (white arrowheads) were quantified in k (n = 30 mitochondria per sample). DRP1 particles (red arrows) were quantified (l; n = 40 mitochondria per sample). Scale bars, 10 μm (unless stated otherwise). Data in b, f and g are mean ± s.d. and analysed using one-way ANOVA with Tukey’s post hoc test. For boxplot data in c, d, k and l, the centre line represents the median, the box limits denote the IQR (25th to 75th percentiles), and whiskers extend from minimum to maximum values; data analysed using Kruskal–Wallis with post hoc Dunn’s test (c,d) or two-tailed Mann–Whitney test (k,l); **P < 0.01, ***P < 0.001, ****P < 0.0001. Exact P values are provided in Source Data Fig. 3.
Fig. 4 |
Fig. 4 |. Mitochondrial fission dampens virus-induced innate immune response.
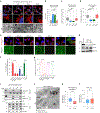
a–c, RT–qPCR of IFN-β mRNA (a) and ISG15 mRNA expression (c) in iSLK-BAC16.vBcl-2 KO cells stably expressing Vec, HA-vBcl-2 (WT/mutants) post reactivation for the indicated time. Fold changes were normalized to 18S rRNA. IFN-β in supernatant was measured by enzyme-linked immunosorbent assay in b. n = 3. d, Representative STED super-resolution micrographs of MAVS (magenta) and mitochondria (TOM20, green) in iSLK-BAC16.vBcl-2 WT/KO cells stably expressing mCherry-vBcl-2 (WT/mutants) at 60 h post reactivation. Insets: MAVS distribution. Arrows indicate MAVS puncta and dotted lines denote clustering. Scale bars, 10 μm. e, Diameter of MAVS clusters measured from images in d (n = 99). f, Quantification of MAVS co-localization with TOM20 in d (n = 100 cells per sample). g, Co-IP of endogenous TBK1 with MAVS in iSLK-BAC16.vBcl-2 KO cells stably expressing HA-vBcl-2 (WT/mutants) at 60 h post reactivation. WCLs were immunoblotted for P-TBK1 and IRF3 dimerization, and mitochondrial fraction was used for SDD–AGE analysis of MAVS aggregation. See Source Data for uncropped images. h–j, Densitometric quantification of MAVS aggregation (h), the ratios of p-TBK1/t-TBK1 (i) and IRF3 dimer/monomer (j) in g. p-TBK1, S172-phosphorylated TBK1; t-TBK1, total TBK1. n = 3. Data in d and g are from one experiment that is representative of three independent experiments. Data in a–c and h–j are mean ± s.d. analysed using one-way ANOVA with Tukey’s post hoc test. For boxplot data in e and f, the centre line represents the median, the box limits denote the IQR (25th to 75th percentiles), and whiskers extend from minimum to maximum values; data analysed using Kruskal–Wallis with post hoc Dunn’s test; *P < 0.05, **P < 0.01, ***P < 0.001, ****P < 0.0001. Exact P values are provided in Source Data Fig. 4.
Fig. 5 |
Fig. 5 |. Mitochondrial fission supports virion assembly through TRIM22 and MxB suppression.
a, TEM of viral particles in iSLK-BAC16.vBcl-2 KO cells expressing HA-vBcl-2 (WT/mutants) 72 h post reactivation. Red arrows, mature nucleocapsids; red arrowheads, enveloped viral particles. Cyto, cytoplasm; Nu, nucleus. b,c Quantification of mature nucleocapsids in the nucleus (b; n = 17 cells per group) and extranuclear space (c; n = 3 independent experiments) in a. d–f, Confocal micrographs of ORF65 (red) in iSLK-BAC16.vBcl-2 KO cells (GFP) expressing HA-vBcl-2 (WT/mutants) post reactivation (d). DAPI, nucleus (blue). The percentage of cells with nuclear/cytoplasmic ORF65 (e; n = 3, 300 cells per sample) and percentage of cytoplasmic ORF65 per cell (f; n = 51 cells per sample) were quantified. g–j, Confocal micrographs of ORF65 (red) in cells transduced with Ctrl or MAVS shRNA post reactivation (g). Indicated protein expression is shown (h). Percentage of cells with cytoplasmic ORF65 (i) and percentage of cytoplasmic ORF65 per cell (j) were quantified (n = 3, 300 cells per sample in i; n = 51 cells per sample in j). k–m, Virus-containing supernatants from Dox/NaB-treated (72 h) iSLK-BAC16.vBcl-2 WT/KO cells transduced with indicated shRNAs were collected to infect SLK cells. Representative GFP/BF images of SLK cells are shown (k), virus titre determined by flow cytometry (l, n = 3) and mRNA expression of indicated genes in k measured by RT–qPCR (m; n = 3). n–p, Virion production in iSLK-BAC16.vBcl-2 WT/KO cells expressing TRIM22 and MxB post reactivation, presented as GFP images in n and quantified in o (n = 3). Indicated gene expression is in p. Scale bars, 10 μm (unless stated otherwise). Data in a, d, g, h, k, n and p are from one experiment that is representative of three independent experiments. See Source Data for uncropped data of h and p. Data in c, e, i, l, m and o are mean ± s.d. analysed using one-way ANOVA with Tukey’s post hoc test. Scatterplots in b, f and j were analysed using Kruskal–Wallis with post hoc Dunn’s test; **P < 0.01, ***P < 0.001, **** P < 0.0001. Exact P values are provided in Source Data Fig. 5.
Fig. 6 |
Fig. 6 |. Development of VBNI-1 as a small-molecule inhibitor of the vBcl-2–NM23-H2 interaction.
a, Chemical structure of VBNI-1 (Z56833834). b, HTRF assays showing the inhibitory activity of VBNI-1 for the vBcl-2–NM23-H2 interaction (left) and the vBcl-2–BH3 peptide (EDIIRNIARHLAQVGDSMDR) interaction (right), with IC50 values determined. c–f, Co-IP (c,e) of indicated proteins with vBcl-2 in SLK.HA-vBcl-2 cells treated with different doses of VBNI-1 for 36 h (c,d) or VBNI-1 (2 μM) for different times (e,f). The respective changes in binding were quantified in d and f (n = 3). g,h, Virus yields in VBNI-1-treated iSLK-BAC16.vBcl-2 WT/KO cells post reactivation, determined by infection of SLK cells, are illustrated by GFP images (g) and quantified (h; n = 3). Scale bars, 430 μm. i, Cytotoxicity of VBNI-1 on cells in g (n = 3). j,k, Confocal micrographs of ORF65 (red) in iSLK-BAC16.vBcl-2 cells (j) treated with VBNI-1 (2 μM, 60 h) and in TREx BCBL-1-RTA cells (k) treated with VBNI-1 (4 μM, 48 h) post reactivation. The cytoplasmic staining of ORF65 was quantified (right; n = 3, 300 cells per sample). l–n, STED micrographs of MAVS (magenta) and TOM20 (red) in VBNI-1-treated cells post reactivation. The cells in l with fission and MAVS aggregation were quantified in m (n = 3, with 100 cells per sample) and n (n = 99), respectively. o, IB of P-TBK1 and P-IRF3 (S379) in VBNI-1-treated cells post reactivation. p, RT–qPCR of indicated transcripts in VBNI-1-treated iSLK-BAC16.vBcl-2 cells post reactivation (n = 3). Scale bars, 10 μm (unless stated otherwise). Data in c, e, g, j–l and o are from one experiment that is representative of three independent experiments. See Source Data for uncropped data of c, e and o. Data in d, f, h–k, m and p are presented as mean ± s.d. and analysed using two-tailed Student’s t-test and one-way ANOVA with Tukey’s post hoc test. For boxplot data in n, the centre line represents the median, the box limits denote the IQR (25th to 75th percentiles), and whiskers extend from minimum to maximum values; data analysed using two-tailed Mann–Whitney test; *P < 0.05, **P < 0.01, ***P < 0.001, ****P < 0.0001. Exact P values are provided in Source Data Fig. 6.

References

    1. Tiku V, Tan MW & Dikic I Mitochondrial functions in infection and immunity. Trends Cell Biol. 30, 263–275 (2020); erratum 30, 748 (2020). - PMC - PubMed
    1. Nunnari J & Suomalainen A Mitochondria: in sickness and in health. Cell 148, 1145–1159 (2012). - PMC - PubMed
    1. Mesri EA, Cesarman E & Boshoff C Kaposi’s sarcoma and its associated herpesvirus. Nat. Rev. Cancer 10, 707–719 (2010). - PMC - PubMed
    1. Naimo E, Zischke J & Schulz TF Recent advances in developing treatments of Kaposi’s sarcoma herpesvirus-related diseases. Viruses 10.3390/v13091797 (2021). - DOI - PMC - PubMed
    1. Cavallin LE, Goldschmidt-Clermont P & Mesri EA Molecular and cellular mechanisms of KSHV oncogenesis of Kaposi’s sarcoma associated with HIV/AIDS. PLoS Pathog. 10, e1004154 (2014). - PMC - PubMed

MeSH terms

LinkOut - more resources