

Mitigating bias in prostate cancer diagnosis using synthetic data for improved AI driven Gleason grading
- PMID: 40404862
- PMCID: PMC12098719
- DOI: 10.1038/s41698-025-00934-5
Mitigating bias in prostate cancer diagnosis using synthetic data for improved AI driven Gleason grading
Abstract
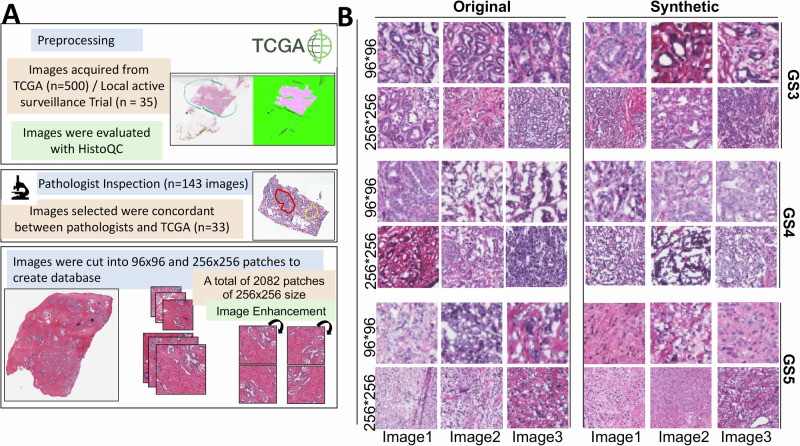
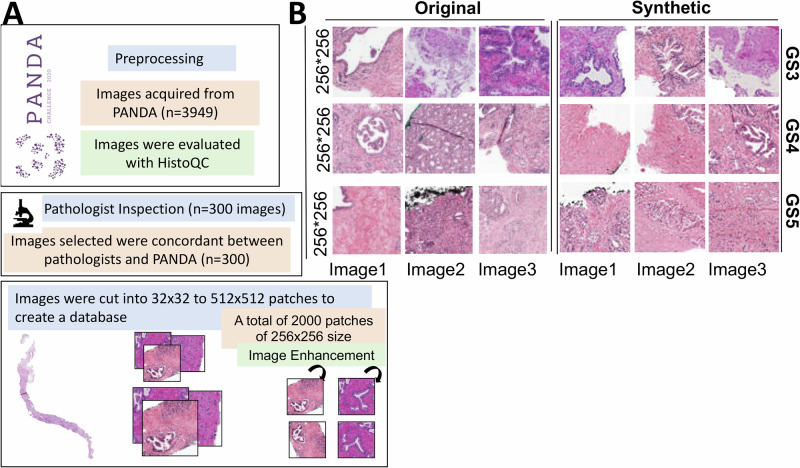
Prostate cancer (PCa) is a leading cause of cancer-related mortality in men, with Gleason grading critical for prognosis and treatment decisions. Machine learning (ML) models offer potential for automated grading but are limited by dataset biases, staining variability, and data scarcity, reducing their generalizability. This study employs generative adversarial networks (GANs) to generate high-quality synthetic histopathological images to address these challenges. A conditional GAN (dcGAN) was developed and validated using expert pathologist review and Spatial Heterogeneous Recurrence Quantification Analysis (SHRQA), achieving 80% diagnostic quality approval. A convolutional neural network (EfficientNet) was trained on original and synthetic images and validated across TCGA, PANDA Challenge, and MAST trial datasets. Integrating synthetic images improved classification accuracy for Gleason 3 (26%, p = 0.0010), Gleason 4 (15%, p = 0.0274), and Gleason 5 (32%, p < 0.0001), with sensitivity and specificity reaching 81% and 92%, respectively. This study demonstrates that synthetic data significantly enhances ML-based Gleason grading accuracy and improves reproducibility, providing a scalable AI-driven solution for precision oncology.
© 2025. The Author(s).
Conflict of interest statement
Competing interests: Disclosure of Patent Information: The authors wish to inform that the technology presented in this study is part of a provisional patent application that has been filed with the United States Patent and Trademark Office (USPTO). The application has been assigned Serial No. 63/598,207 and was filed on November 13, 2023. The patent application is currently pending. Some of the authors of this paper are listed as inventors in the patent application. This patent filing may constitute a potential conflict of interest, and this statement serves to disclose this relationship in the interest of full transparency. Joshua M. Hare reports having a patent for cardiac cell-based therapy and holds equity in Vestion Inc., and maintains a professional relationship with Vestion Inc. as a consultant and member of the Board of Directors and Scientific Advisory Board. Vestion Inc. did not play a role in the design, conduct, or funding of the study. Dr. Joshua Hare is the Chief Scientific Officer, a compensated consultant, and a board member for Longeveron Inc. and holds equity in Longeveron. Dr. Hare is also the co-inventor of intellectual property licensed to Longeveron. Longeveron did not play a role in the design, conduct, or funding of the study. The University of Miami is an equity owner in Longeveron Inc., which has licensed intellectual property from the University of Miami. Ethics statement: This study was conducted in accordance with the principles outlined in the Declaration of Helsinki. Ethical approval was obtained from the Institutional Review Board (IRB) of the University of Miami Miller School of Medicine, Miami, FL (IRB Protocol Number: 20140372). The MAST Trial was registered on ClinicalTrials.gov (Identifier: NCT02242773). Informed consent was obtained from all participants prior to their inclusion in the study. Additionally, external datasets, including those from The Cancer Genome Atlas (TCGA), Radboud University Medical Center, and Karolinska Institute (PANDA challenge), were used in compliance with their respective data use agreements. All data were anonymized to ensure participant confidentiality and privacy.
Figures


References
-
- Brawley, O. W. Prostate cancer epidemiology in the United States. World J. Urol.30, 195–200 (2012). - PubMed
-
- Badalament, R. A. & Drago, J. R. Prostate cancer. Dis. Mon.37, 199–268 (1991). - PubMed
-
- Cook, E. D. & Nelson, A. C. Prostate cancer screening. Curr. Oncol. Rep.13, 57–62 (2011). - PubMed
-
- Litwin, M. S. & Tan, H. J. The Diagnosis and Treatment of Prostate Cancer: A Review. Jama317, 2532–2542 (2017). - PubMed
Grants and funding
LinkOut - more resources
Full Text Sources
