. 2025 Jul;44(13):3586-3613.
doi: 10.1038/s44318-025-00458-5. Epub 2025 May 22.

Translocation of gut bacteria promotes tumor-associated mortality by inducing immune-activated renal damage

Affiliations

Translocation of gut bacteria promotes tumor-associated mortality by inducing immune-activated renal damage

Fei Cong et al. EMBO J. 2025 Jul.

Abstract

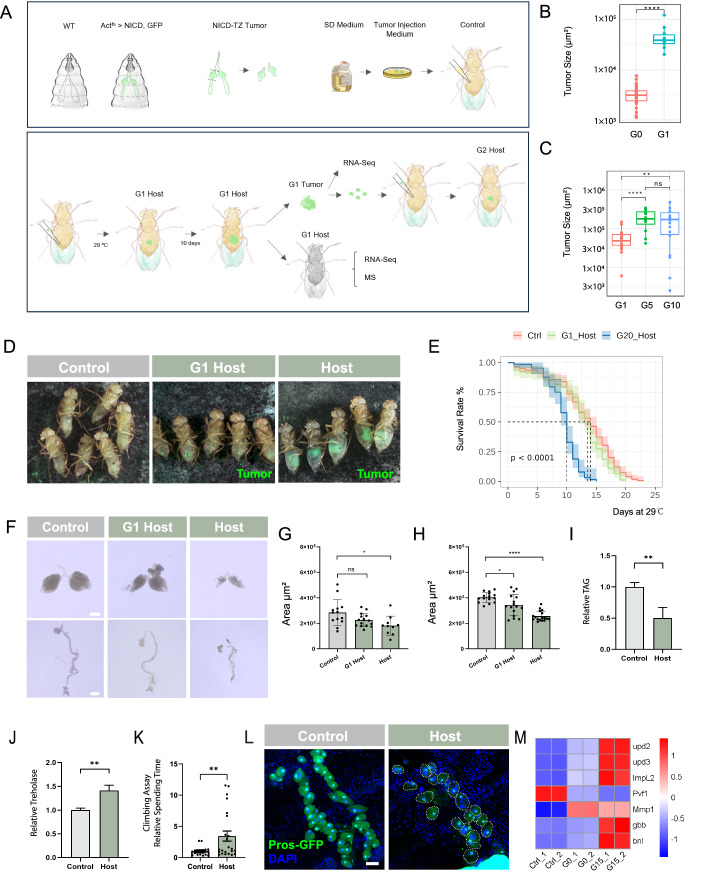
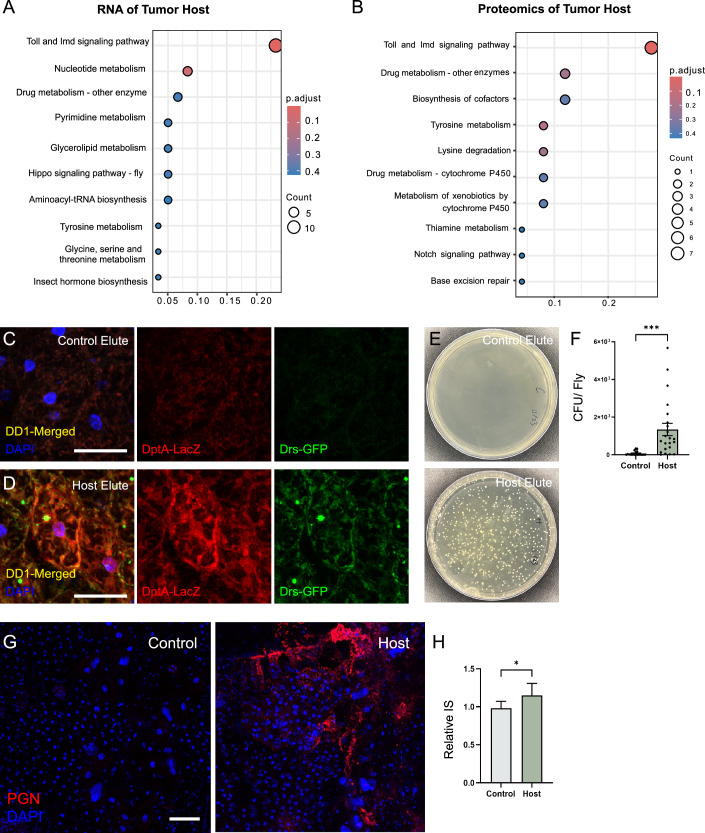
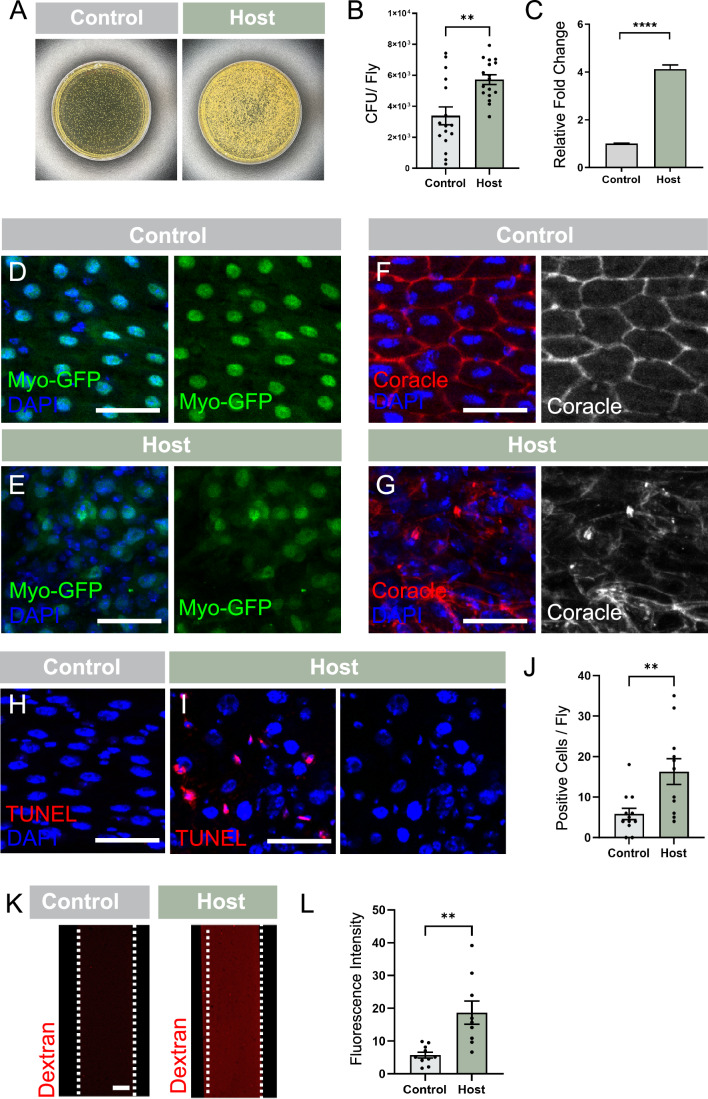
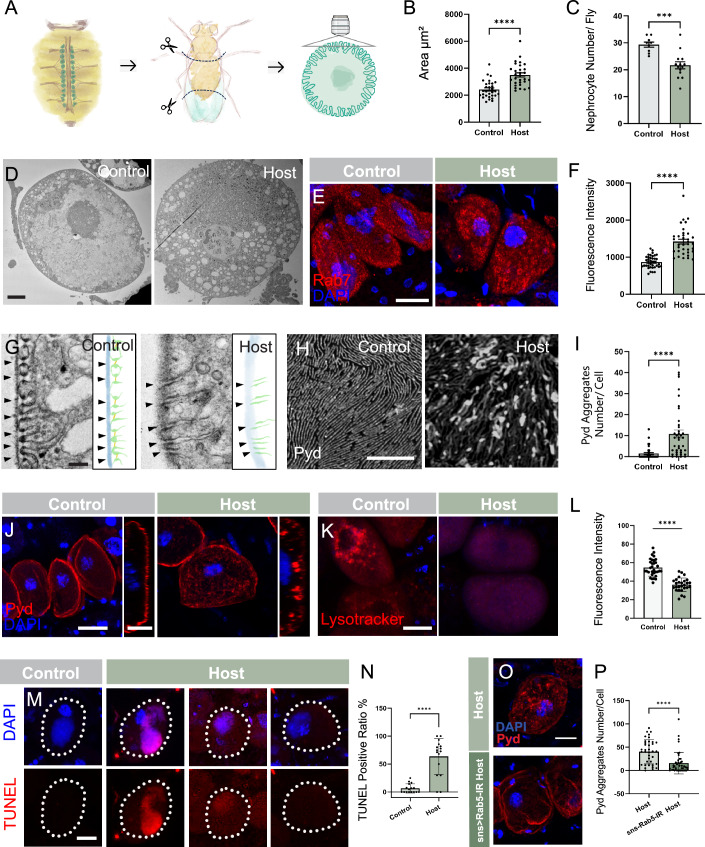
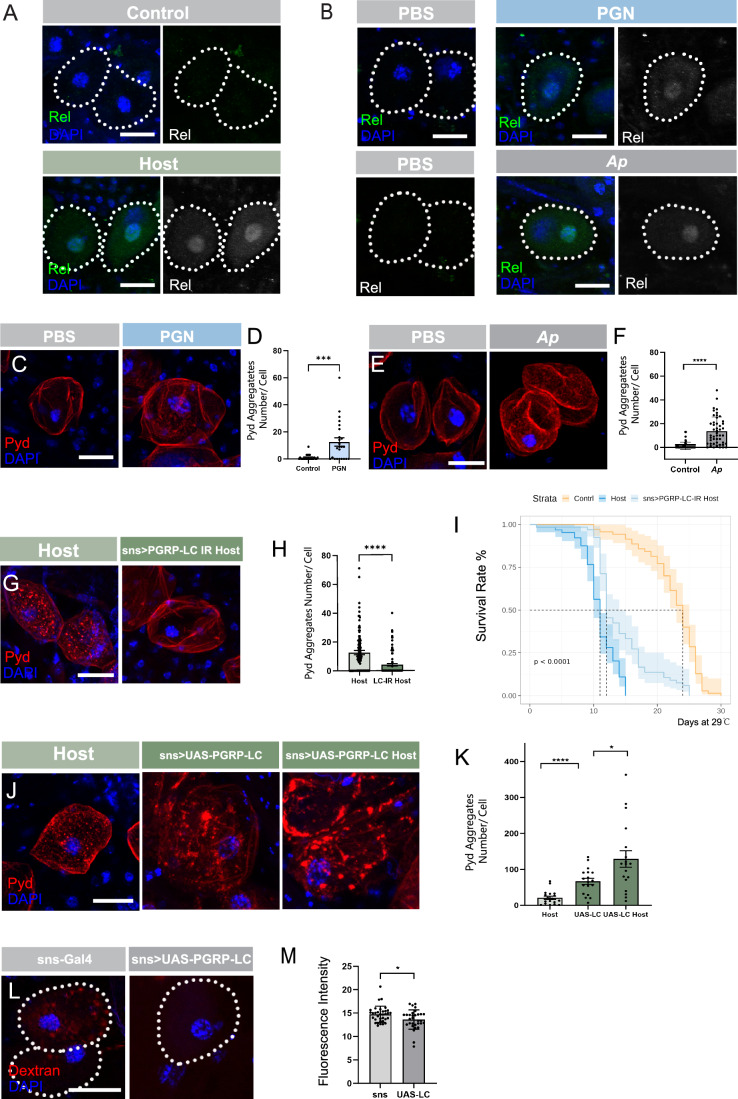
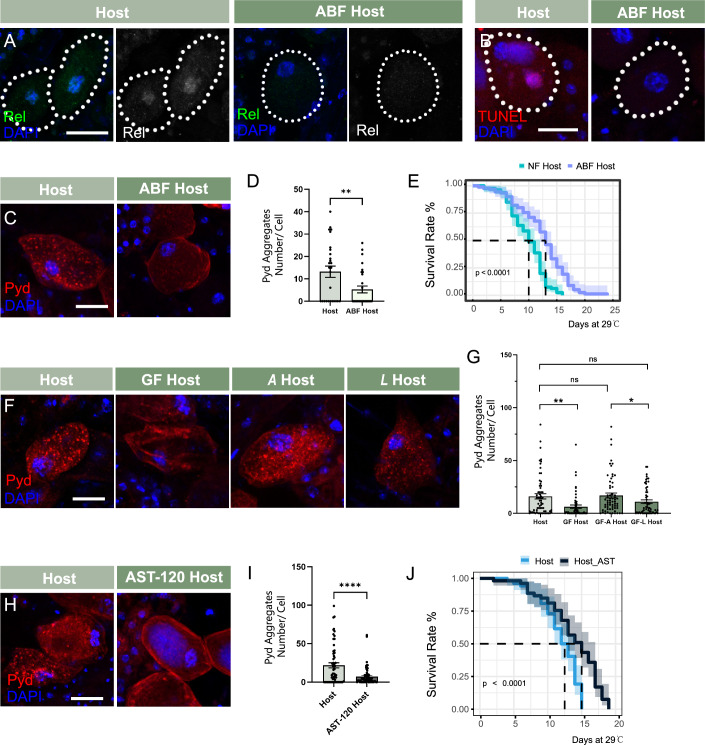
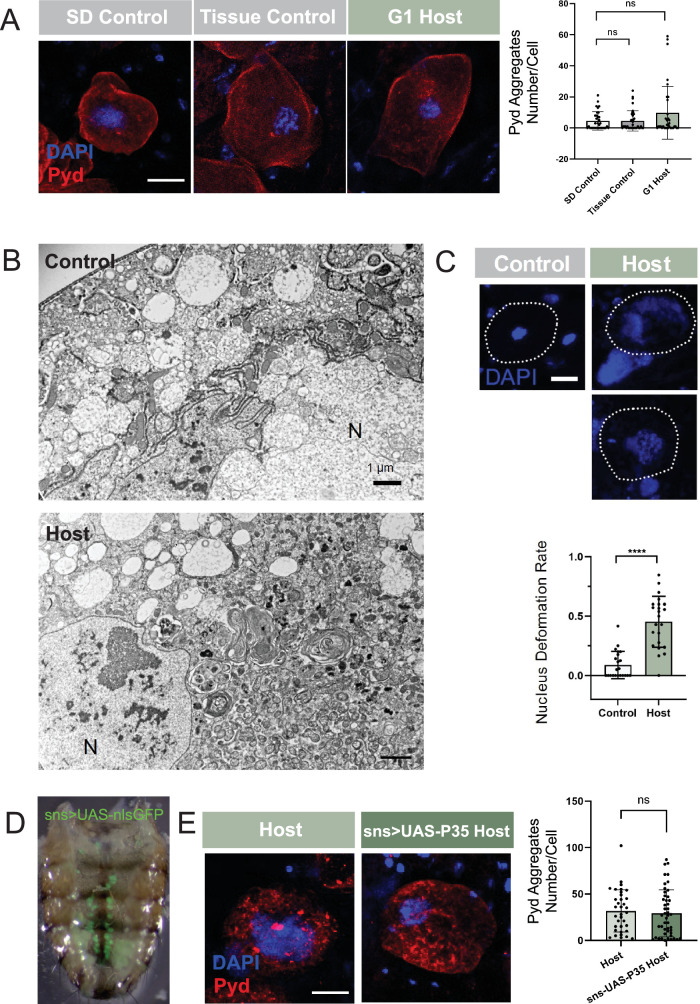
Paraneoplastic syndrome represents severe and complex systemic clinical symptoms manifesting in multiple organs of cancer patients, but its cause and cellular underpinnings remain little explored. In this study, establishing a Drosophila model of paraneoplastic syndrome triggered by tumor transplantation, we found that the innate immune response, initiated by translocated commensal bacteria from a compromised intestine, significantly contributes to reduced lifespan in tumor-bearing hosts. Our data identify the renal system as a central hub of this paraneoplastic syndrome model, wherein the pericardial nephrocytes undergo severe damage due to an elevated immune response triggered by gut dysbiosis and bacterial translocation. This innate immune response-induced nephrocyte damage is a major contributor to reduced longevity in tumor-bearing hosts, as blocking the NF-kB/Imd pathway in nephrocytes or removing gut bacteria via germ-free derivation or antibiotic treatment ameliorates nephrocyte deterioration and extends the lifespan of tumor-bearing flies. Consistently, treatment with a detoxifying drug also extended the lifespan of the tumor hosts. Our findings highlight a critical role of the gut-kidney axis in the paraneoplastic complications observed in cancer-bearing flies, suggesting potential therapeutic targets for mitigating similar complications in cancer patients.

Keywords: Drosophila Tumor Model; Bacterial Translocation; Gut-kidney Axis; Innate Immunity; Paraneoplastic Glomerulopathy.


Conflict of interest statement

Disclosure and competing interests statement. The authors declare no competing interests.

Figures

Figure 1
Figure 1. NICD-TZ tumor model and tumor host interactions.
(A) Procedure for allografting NICD-overexpressed salivary gland transition zone tumor (Actts > NICD, GFP) into the adult fly abdomen. NICD-TZ tumors were dissected from larva and cultured in SD medium for transplantation. Flies injected with SD medium (the medium used during tumor injection) were regarded as the control flies. Flies injected with NICD-TZ tumors (G0) were regarded as G1 hosts. After resting at 25 °C for 1 day, the G1 flies were transferred to 29 °C to promote tumor tissue growth. To passage the tumor tissue, the G1 tumor was separated from the host body 10 days after transfer and was cut into small pieces, each as large as the primary tumor. These small G1 tumor pieces were then transplanted into new adult flies which become the G2 tumor hosts. Partial tumors and host bodies were used for RNA sequencing (RNA-seq) and mass-spectrometry (MS) analyses. (B) Size comparison of G0 tumors with G1 tumors. Box plots are defined as follows: For Primary Tumor—min: 1126, lower whisker: 1126, 25th percentile: 2426, median: 3130, mean: 3334, 75th percentile: 3808, upper whisker: 5881, max: 7606. G1 Tumor—min: 20,413, lower whisker: 20,413, 25th percentile: 33,568, median: 38,988, mean: 48,371, 75th percentile: 50,192, upper whisker: 75,127, max: 124,324.G0, n = 32; G1, n = 10. ****p = 1.4E-09. (C) Size comparison of G1 tumors, G5 tumors and G10 tumors. Box plots are defined as follows: G1 Tumor—min: 6047, lower whisker: 6047, 25th percentile: 37,428, median: 48,503, mean: 56,475, 75th percentile: 70,092, upper whisker: 119,087, max: 150,350. G5 Tumor—min: 42,124, lower whisker: 42,124, 25th percentile: 135,722, median: 181,204, mean: 195,632, 75th percentile: 272,787, upper whisker: 345,174, max: 345,174. G10 Tumor—min: 2505, lower whisker: 2505, 25th percentile: 70,678, median: 174,480, mean: 175,830, 75th percentile: 259,220, upper whisker: 484,617, max: 484,617. G1, n = 21; G5, n = 12; G10, n = 22. **p = 0.002, ****p = 3.4E-05, ns p = 0.6554. (D) Pictures of control, G1 tumor-host flies and high-passage tumor-host flies, high-passage tumor-host flies showed a reduction in white colored fat body in the tumor-host abdomens; green tissues represent the tumors. (E) Lifespan comparison of control flies with G1 tumor hosts and G20 hosts. Control, n = 121; G1-Host, n = 97; G20-Host, n = 64. ****p = 2.3E-16. Three groups were repeated. (F) Ovaries and guts of controls and tumor hosts 10 days after tumor injection at 29 °C. Scale bar, 2000 µm. (G) Quantification of the ovaries shown in (F). Control, n = 13; G1-Host, n = 15; G20-Host, n = 10. ANOVA test followed by post-hoc test. *p = 0.0157, ns p = 0.6894. (H) Quantification of the gut sizes shown in (F). Control, n = 15; G1-Host, n = 16; G20-Host, n = 17. ANOVA test followed by post-hoc test. *p = 0.0187, ****p = 1.406E-11. (I) Relative triglyceride levels in whole flies (tumor removed) normalized to protein amounts. Three groups were repeated. **p = 0.0095. (J) Relative trehalose levels in whole flies (tumor removed) normalized to extracted protein amounts. Three groups were repeated. **p = 0.0040. (K) Quantification of the relative time flies spend in the climbing assay. Control n = 19, Host n = 23. **p = 0.0096. (L) Pros-GFP marked nephrocytes in control and tumor-host flies. The white dots outline the nephrocyte shape. Scale bar, 50 µm. (M) Heatmap depicting representative upregulated cachectic factors within tumors of Control (wild-type tissues), G0 (larval tumors) and G15 tumors. Data is presented as mean ± SEM, Student’s t-test. Source data are available online for this figure.
Figure 2
Figure 2. Immune response is activated in tumor hosts.
(A, B) KEGG pathway enrichment analysis of tumor-host transcriptomic and proteomic data. The top 10 significant pathways are shown for differentially expressed genes between control and host. The gene ratio represents the fraction of differentially expressed genes found within the gene set. (C, D) Immunostaining of fat body from DD1 flies injected with control or tumor-host visceral hemolymph. Scale bar, 20 µm. (E, F) Bacterial loads in control and tumor-host body fluid determined by colonization number on MRS agar plates and quantification is shown in (F). Control, n = 20; Host, n = 22. ***p = 0.0007. (G) Immunostaining of PGN antibody in visceral cavity of control and tumor-host flies. Scale bar, 25 µm. (H) Comparison of relative IS concentration in body fluid between control and tumor-host flies. Six groups were repeated. *p = 0.0485. Data is presented as mean ± SEM, Student’s t test. Source data are available online for this figure.
Figure 3
Figure 3. Bacteria over-load and barrier damage in host guts.
(A, B) Gut bacterial load of single fly of control and tumor-host flies on MRS plates. Quantification of CFU numbers is shown in (B). Control, n = 16; Host, n = 17. **p = 0.001. (C) Relative comparison of gut bacteria numbers between control and tumor-host flies by qPCR. Three groups were repeated. ****p = 6.118E-05. (D, E) Myo1A-Gal4 > nlsGFP-labeled enterocytes (ECs) in control and tumor-host guts. Scale bar, 20 µm. (F, G) Localization of the septate junction marker, Coracle, reveals an aberrant pattern in tumor-hosts’ mid-gut. Scale bar, 20 µm. (HJ) TUNEL assay in control and tumor-host guts; quantification is shown in (J). Scale bar, 15 µm. Control, n = 12; Host, n = 11. **p = 0.0059. (K, L) Representative samples of hemolymph taken from control and tumor-host flies. Red fluorescence intensity reflects dextran concentration. Scale bar, 50 µm. Quantification is shown in (L). Control, n = 10; Host, n = 9. **p = 0.0018. Data is presented as mean ± SEM, Student’s t test. Source data are available online for this figure.
Figure 4
Figure 4. Nephrocyte damage in tumor hosts.
(A) Schematics of pericardial nephrocyte location, dissection and imaging. (B) Size comparison of pericardial nephrocytes from control and tumor-host flies. Control, n = 30; Host, n = 30. ****p = 7.39E-07. (C) Number comparison of control and tumor-host flies pericardial nephrocytes. Control, n = 9; Host, n = 14. ***p = 0.0004. (D) Ultrastructural analysis of nephrocytes in control and tumor-host flies by transmission electron microscopy (TEM). Scale bar, 5 µm. (E) Immunostaining of Rab7 antibody in nephrocytes of control and tumor-host flies. Scale bar, 20 µm. (F) Quantification of Rab7 intensity in each nephrocyte of control and tumor-host flies. Control, n = 38; Host, n = 35. ****p = 7.463E-11. (G) TEM and schematic pictures of nephrocytes basement membrane (blue), slit diaphragm structure (yellow, arrowhead pointed) and lacunar channel (green) in control and tumor-host flies. Scale bar, 200 nm. (H) Pyd antibody staining pattern on the surface of nephrocytes in control and tumor-host flies with 60X lens. Scale bar, 20 nm. (I, J) Pyd location on the membrane and inside of the nephrocyte in control and tumor-host flies with 20X lens. Quantification of Pyd aggregates on the membrane of each nephrocyte is shown in (I). Scale bar, left 20 µm, right 10 µm. Control, n = 38; Host, n = 38. ****p = 7.006E-06. (K, L) Lysotracker staining of nephrocytes in control and tumor-host flies. Scale bar, 20 µm. Quantification of Lysotracker intensity is shown in (L). Control, n = 32; Host, n = 27. ****p = 1.459E-11. (M) TUNEL staining of nephrocytes in control and tumor host flies. The white dots outline the nephrocyte shape. Scale bar, 15 µm. (N) Quantification of TUNEL positive cells ratio in each fly. Control, n = 16; Host, n = 16. ****p = 1.283E-07. (O, P) Pyd staining of nephrocytes in host flies and sns-Gal4>Rab5-RNAi host flies. Scale bar, 20 µm. Quantification of Pyd aggregates is shown in (P). Control, n = 37; Host, n = 44. ****p = 2.463E-05. Data is presented as mean ± SEM, Student’s t test. Source data are available online for this figure.
Figure 5
Figure 5. Aberrant immune response causes damage to nephrocytes.
(A) Relish staining of nephrocytes in control and tumor host flies. The white dots outline the nephrocyte shape. Scale bar, 20 µm. Control, n = 42; Host, n = 32. (B) Relish staining of nephrocytes in flies injected with PBS, PGN or Acetobacter (Ap). The white dots outline the nephrocyte shape. Scale bar, 20 µm. PBS n = 38; PGN, n = 36; Ap, n = 38. (C, D) Pyd staining of nephrocytes in flies injected with PBS or PGN. Scale bar, 20 µm. Quantification of Pyd aggregates is shown in (D). PBS, n = 24; PGN, n = 24. ***p = 0.0005. (E, F) Pyd staining of nephrocytes in w1118 tumor hosts injected with PBS or Acetobacter (Ap). Scale bar, 20 µm. Quantification of Pyd aggregates is shown in (F). PBS, n = 49; Acetobacter, n = 50. ****p = 4.751E-10. (G, H) Pyd staining of nephrocytes in sns-Gal4 tumor hosts or sns-Gal4 > PGRP-LC-RNAi tumor hosts. Scale bar, 20 µm. Quantification of Pyd aggregates is shown in (H). sns-Gal4 host, n = 47; sns-Gal4 > PGRP-LC-RNAi host, n = 47. ****p = 1.283E-09. (I) Lifespan analysis of controls, sns-Gal4 hosts and sns-Gal4 > PGRP-LC-RNAi host flies. Control, n = 69; sns-Gal4 host, n = 64; sns-Gal4 > PGRP-LC-RNAi host, n = 66. ****p = 5.7E-08. (J, K) Pyd staining of nephrocytes in sns-Gal4 tumor hosts, sns-Gal4 > UAS- PGRP-LC flies, or sns-Gal4 > UAS- PGRP-LC tumor hosts. Scale bar, 20 µm. Quantification of Pyd aggregates is shown in (K). sns-Gal4 host, n = 18; sns-Gal4 > UAS- PGRP-LC, n = 18; sns-Gal4 > UAS- PGRP-LC host, n = 18. ANOVA test followed by post-hoc test. *p = 0.0147. ****p = 1.986E-09. (L, M) Dextran uptake assay of nephrocytes from sns-Gal4 and sns-Gal4 > UAS- PGRP-LC flies. Fluorescence intensity reflects dextran concentration; quantified in (M). The white dots outline the nephrocyte shape. Scale bar, 20 µm. sns-Gal4, n = 34; sns-Gal4 > UAS- PGRP-LC, n = 31. *p = 0.0189. Data is presented as mean ± SEM, Student’s t test. Source data are available online for this figure.
Figure 6
Figure 6. Bacteria removal alleviates nephrocyte damage and prolongs lifespan of tumor hosts.
(A) Relish staining of nephrocytes from tumor hosts reared on normal food or antibiotic food (ABF). The white dots outline the nephrocyte shape. Control, n = 40; Host, n = 31. Scale bar, 20 µm. (B) TUNEL assay of nephrocytes from tumor hosts reared on normal food or antibiotic food (ABF). The white dots outline the nephrocyte shape. Control, n = 27; Host, n = 25. Scale bar, 20 µm. (C, D) Pyd staining of nephrocytes from tumor hosts reared on normal food (NF) or antibiotic food (ABF). Scale bar, 20 µm. Pyd-aggregate quantification is shown in (D). NF host, n = 27; ABF host, n = 29. **p = 0.0087. (E) Lifespan analysis of tumor hosts reared on normal food or antibiotic food. NF host, n = 67; ABF host, n = 65. ****p = 1E-08. (F, G) Pyd staining of nephrocytes from tumor hosts grown under normal conditions (Host), germ-free conditions (GF), mono-associated with Acetobacter host (A Host) or Lactobacillus (L Host). Scale bar, 20 µm. Quantification of Pyd aggregates is shown in (G). Host, n = 63; GF Host, n = 58; A Host, n = 63; L Host, n = 60. ANOVA test followed by post-hoc test. **p = 0.001, *p = 0.044, ns lower p = 0.8159, ns upper p = 0.0890. (H, I) Pyd staining of nephrocytes from tumor hosts reared on normal food (Host) or AST-120 supplemented food (AST-120 Host). Scale bar, 20 µm. Quantification of Pyd-aggregates is shown in (I). Host, n = 60; AST-120 Host, n = 68. ****p = 5.090E-05. (J) Survival rate of tumor hosts reared on normal food (Host) or AST-120 supplemented food (AST-120 Host). More than fifty percent control flies fed with AST-120 survived longer than 20 days (not included in Figure). Host, n = 50; AST-120 Host, n = 61. ****p = 2E-05. Data is presented as mean ± SEM, Student’s t test. Source data are available online for this figure.
Figure EV1
Figure EV1. Low- and high- passage NICD-TZ tumors have distinct effects on the host.
(A) Schematic diagram of the shearing of wild-type salivary-gland imaginal rings (IMR) and injection into the control host abdomen. (B) Comparison of the lifespan of control host flies injected with either wild-type IMR or SD medium. SD, n = 58; WT-IMR, n = 57. (C, D) The abdominal cavity of host flies carrying GFP-labeled G1 (C) or G43 (D) tumors. Scale bar, 200 µm. (E) Comparison of tumor sizes with different tumor passages. Box plots are defined as follows: Box plots are defined as follows: Primary Tumor—min: 1126, lower whisker: 1126, 25th percentile: 2426, median: 3130, mean: 3334, 75th percentile: 3808, upper whisker: 5881, max: 7606. No-inject—min: 0, lower whisker: 0, 25th percentile: 0, median: 0, mean: 0, 75th percentile: 0, upper whisker: 0, max: 0. G1 Tumor—min: 6047, lower whisker: 6047, 25th percentile: 37,428, median: 48,503, mean: 56,475, 75th percentile: 70,092, upper whisker: 119,087, max: 150,350. Cut Tumor—min: 841, lower whisker: 841, 25th percentile: 2844, median: 3691, mean: 3901, 75th percentile: 4640, upper whisker: 7335, max: 8026. G5 Tumor—min: 42,124, lower whisker: 42,124, 25th percentile: 135,722, median: 181,204, mean: 195,632, 75th percentile: 272,787, upper whisker: 345,174, max: 345,174. G6 Tumor—min: 1010, lower whisker: 1010, 25th percentile: 36,995, median: 72979, mean: 72,979, 75th percentile: 108,963, upper whisker: 144,947, max: 144,947. G7 Tumor—min: 24862, lower whisker: 24,862, 25th percentile: 41,071, median: 183483, mean: 165,166, 75th percentile: 234,836, upper whisker: 372,677, max: 372,677. G8 Tumor—min: 60,425, lower whisker: 60,425, 25th percentile: 87,598, median: 198,436, mean: 221,770, 75th percentile: 328,039, upper whisker: 501,919, max: 501,919. G9 Tumor—min: 33,675, lower whisker: 33,675, 25th percentile: 74,424, median: 122,889, mean: 127,351, 75th percentile: 177,309, upper whisker: 257,638, max: 257,638. G10 Tumor—min: 2505, lower whisker: 2505, 25th percentile: 70,678, median: 174,480, mean: 175,830, 75th percentile: 259,220, upper whisker: 484,617, max: 484,617.G0, n = 32; Non-inject, n = 23; G1, n = 32; Cut, n = 36; G5, n = 12; G6, n = 2; G7, n = 15; G8, n = 10; G9, n = 9; G10, n = 22. (F) Comparison of the lifespan of tumor host flies with increasing tumor passages. G1, n = 43; G10, n = 55; G15, n = 49; G20, n = 55; G29, n = 56. (G) Relative triglyceride levels in control and G1 host whole flies (tumor removed) normalized to protein amounts. Three groups were repeated. ns p = 0.1574. (H) Relative trehalose levels in control and G1 host whole flies (tumor removed) normalized to extracted protein amounts. Three groups were repeated. ns p = 0.6143. (I) Tumor hosts with varying abdomen sizes. Scale bar, 500 µm. Data is presented as mean ± SEM, Student’s t test. Source data are available online for this figure.
Figure EV2
Figure EV2. Both RNA-seq and proteomic analyses show elevated immune response in tumor hosts.
(A) Venn diagram illustrates the overlap between upregulated genes identified through RNA-seq and proteomic analyses in tumor hosts. (B) List of shared upregulated genes from both RNA-seq and proteomic analyses. (C) Heatmap showing Imd pathway gene expression in the flies without injection (No-inject), control hosts injected with SD medium (SD-inject), and tumor hosts (Host).
Figure EV3
Figure EV3. : NICD-TZ tumors cause nephrocyte damage and death in the host.
(A) Pyd staining pattern and aggregate statistical data of SD-injected controls, Normal Tissue injected controls and G1 hosts. Scale bar, 20 µm. SD control, n = 34; Tissue control, n = 37; G1 host, n = 34. ns lower p = 0.9634. ns upper p = 0.0918. (B) TEM images of control and tumor host nephrocytes. “N” indicates nucleus. Scale bar, upper 1 µm, lower 2 µm. (C) Nuclear morphology in control and tumor-host nephrocytes. The white dots outline the nephrocyte shape. Scale bar, 15 µm. Quantification of defective nuclear morphology ratio in control (n = 22) and tumor-host flies (n = 23). ****p = 1.11E-08. (D) Expression of sns-GAL4 > nlsGFP in pericardial nephrocytes in adult flies. (E) Pyd staining pattern and aggregates statistical data of hosts and sns-Gal4 > UAS-P35 hosts. Scale bar, 20 µm. Host, n = 35; sns>P35, n = 47. ns p = 0.6423. Data is presented as mean ± SEM, Student’s t test. Source data are available online for this figure.
Figure EV4
Figure EV4. The nephrocyte immune response leads to mis-localization of Pyd on the cell membrane.
(A) Pyd staining in wild-type flies, PGRP-SCΔ mutations and Myo1A-Gal4; Gal80∧ts > PGRP-SCa1-RNAi nephrocytes. Quantification of Pyd aggregates is shown on the right. wt, n = 32; PGRP-SCΔ, n = 33; Myo1A-Gal4; Gal80∧ts > PGRP-SCa1-RNAi, n = 45. Scale bar, 20 µm. **p = 0.0036, ***p = 0.0001. (B) Pyd staining in Myo1A-Gal4; Gal80∧ts> Tsp2A-RNAi fly in normal food and in DSS added food. Quantification of Pyd aggregates is shown on the right. Myo control, n = 30; Myo DSS, n = 30; Tsp2A-RNAi, n = 38; Tsp2A-RNAi DSS, n = 35. Scale bar, 20 µm. ***p = 0.0002. (C) Pyd staining in Dot-GAL4 and Dot-GAL4 > UAS-PGRP-LC nephrocytes. Quantification of Pyd aggregates is shown on the right. Dot-GAL4, n = 40; Dot-GAL4 > UAS-PGRP-LC, n = 40. Scale bar, 20 µm. ****p = 2.25E-10. (D) Pyd staining in Dot-GAL4 and Dot-GAL4 > UAS-Relish nephrocytes. Quantification of Pyd aggregates is shown on the right. Dot-GAL4, n = 29; Dot-GAL4 > UAS-Relish, n = 37. Scale bar, 20 µm. **p = 0.0044. (E) Pyd staining in Dot-Gal4 Host and Dot-GAL4 > UAS-Relish tumor host nephrocytes. Quantification of Pyd aggregates is shown on the right. Dot-GAL4 host, n = 28; Dot-GAL4 > UAS-Relish Host, n = 18. Scale bar, 20 µm. ****p = 5.96E-10. Data is presented as mean ± SEM, Student’s t test. Source data are available online for this figure.
Figure EV5
Figure EV5. Reducing bacterial load and improving gut health benefit nephrocyte function and extend host survival time.
(A) Intestinal bacterial load of antibiotic treated control and tumor host flies. (B) Lifespan of controls fed with normal food and antibiotic food. Control, n = 22; Control Anti, n = 22. ****p = 4E-05. (C) Lifespan of control and tumor host flies raised in germ-free conditions (GF). GF-Control, n = 28; GF-Host, n = 34. ****p = 2E-15. (D) DAPI staining of midgut in control, Host and esg-Gal4; Gal80∧ts > UAS-P35 host flies. Quantification of nuclei densities is shown on the left. Control, n = 8; Host, n = 8; esg > UAS-P35 Host, n = 11. Pyd staining in control, Host and esg-Gal4; Gal80∧ts > UAS-P35 host nephrocytes. Quantification of Pyd aggregates is shown on the right. Host, n = 34; esg > UAS-P35 Host, n = 33. Scale bar, 20 µm. Gut *p = 0.0361, Nephrocyte *p = 0.0336. Data is presented as mean ± SEM, Student’s t test. Source data are available online for this figure.

Similar articles

Cited by

References

    1. Asai M, Kumakura S, Kikuchi M (2019) Review of the efficacy of AST-120 (KREMEZIN®) on renal function in chronic kidney disease patients. Ren Fail 41:47–56 - PMC - PubMed
    1. Audard V, Larousserie F, Grimbert P, Abtahi M, Sotto J-J, Delmer A, Boue F, Nochy D, Brousse N, Delarue R et al (2006) Minimal change nephrotic syndrome and classical Hodgkin’s lymphoma: report of 21 cases and review of the literature. Kidney Int 69:2251–2260 - PubMed
    1. Azar L, Khasnis A (2013) Paraneoplastic rheumatologic syndromes. Curr Opin Rheumatol 25:44 - PubMed
    1. Balzan S, De Almeida Quadros C, De Cleva R, Zilberstein B, Cecconello I (2007) Bacterial translocation: overview of mechanisms and clinical impact. J Gastroenterol Hepatol 22:464–471 - PubMed
    1. Bangi E, Pitsouli C, Rahme LG, Cagan R, Apidianakis Y (2012) Immune response to bacteria induces dissemination of Ras‐activated Drosophila hindgut cells. EMBO Rep 13:569–576 - PMC - PubMed

LinkOut - more resources