. 2025 Jun;22(6):1331-1342.
doi: 10.1038/s41592-025-02697-0. Epub 2025 May 22.

Cell simulation as cell segmentation

Affiliations

Cell simulation as cell segmentation

Daniel C Jones et al. Nat Methods. 2025 Jun.

Abstract

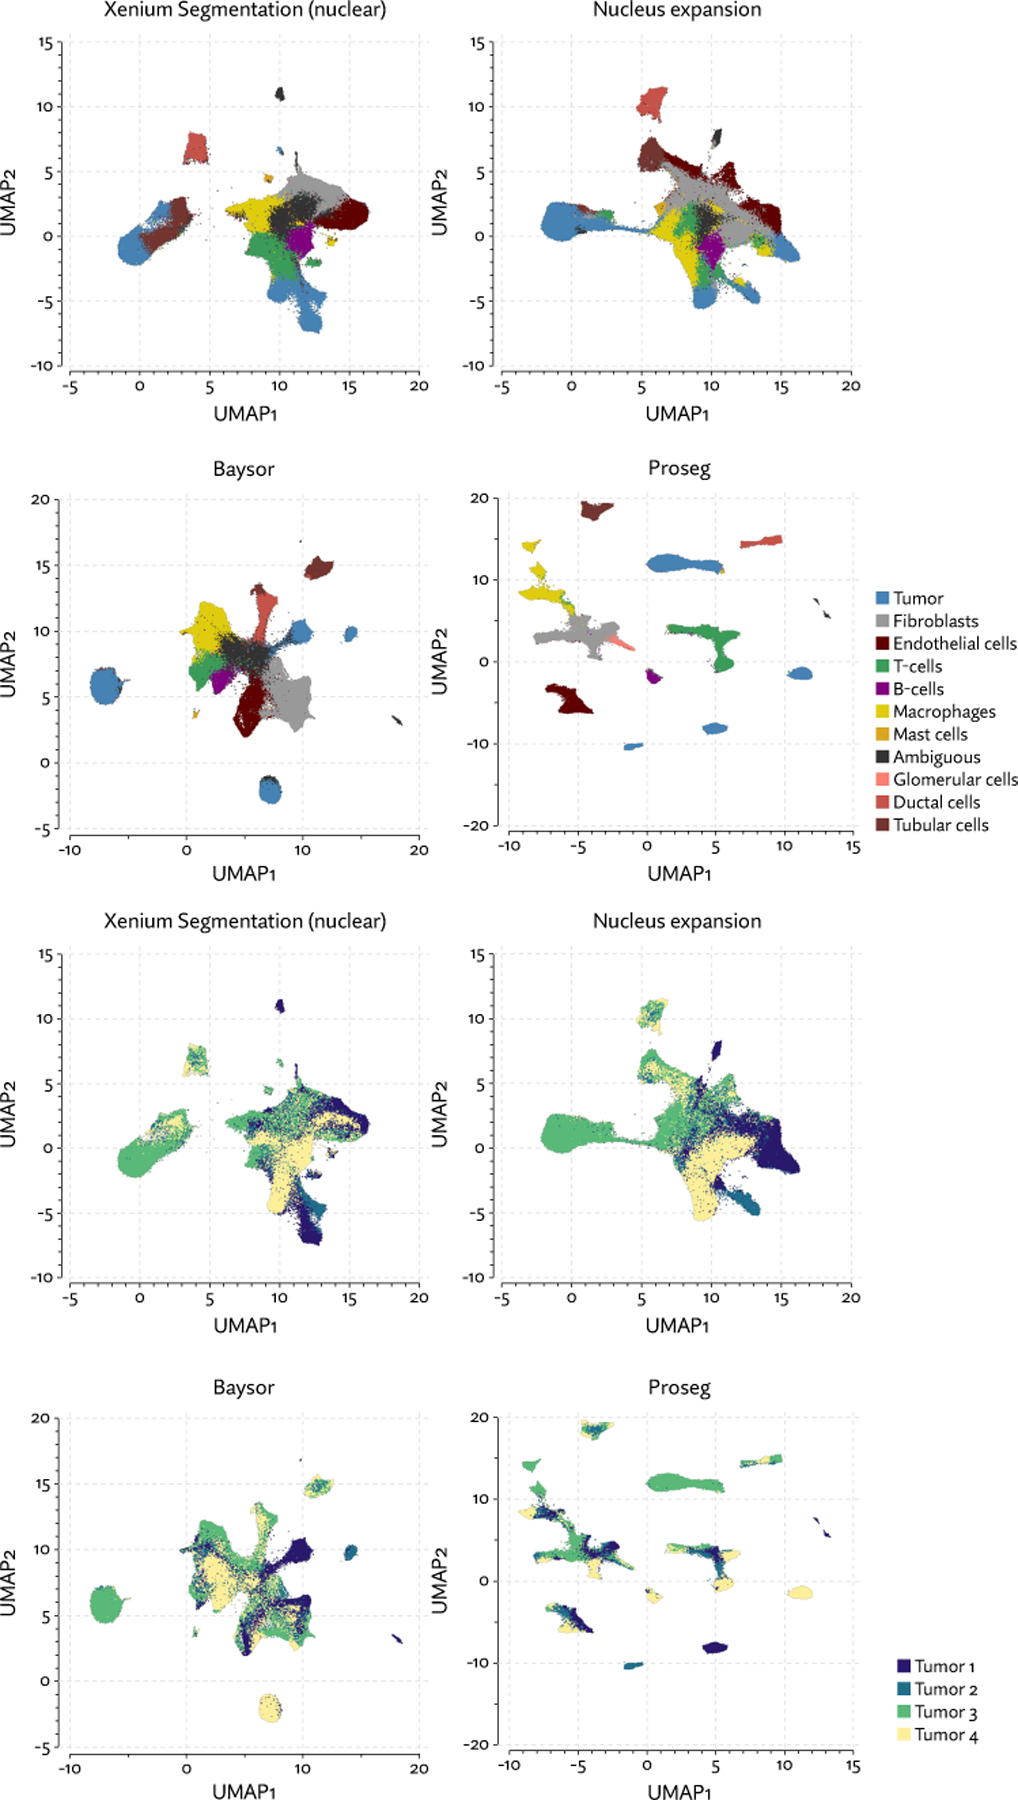
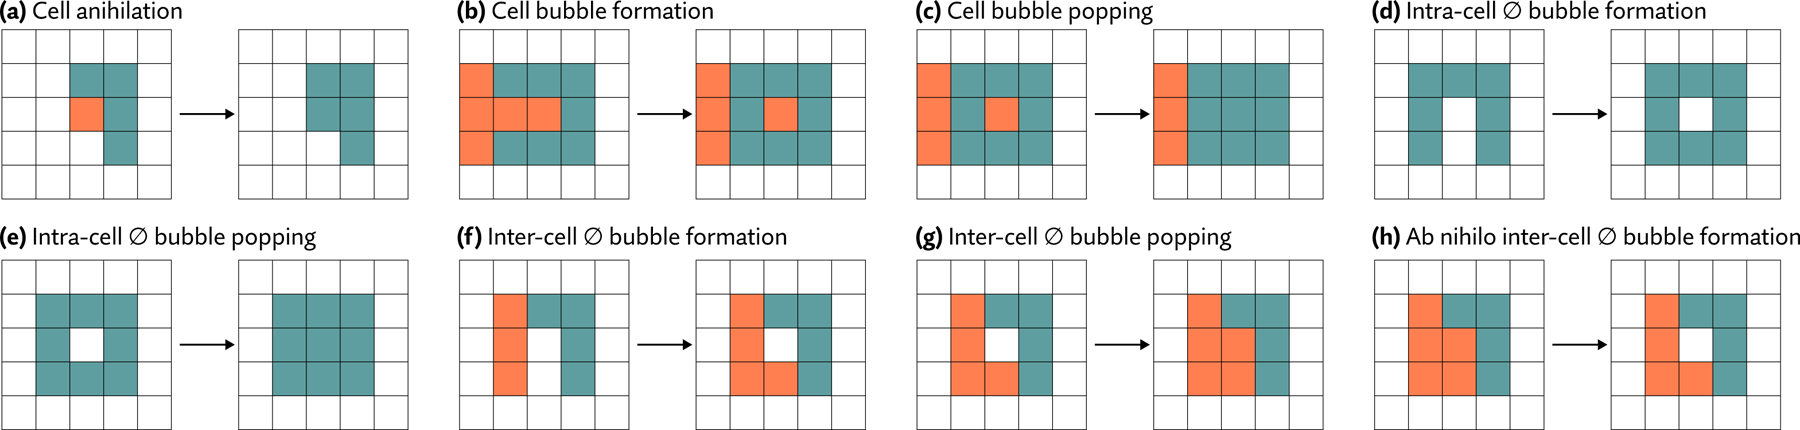
Single-cell spatial transcriptomics promises a highly detailed view of a cell's transcriptional state and microenvironment, yet inaccurate cell segmentation can render these data murky by misattributing large numbers of transcripts to nearby cells or conjuring nonexistent cells. We adopt methods from ab initio cell simulation, in a method called Proseg (probabilistic segmentation), to rapidly infer morphologically plausible cell boundaries. Benchmarking applied to datasets generated by three commercial platforms shows superior performance and computational efficiency of Proseg when compared to existing methods. We show that improved accuracy in cell segmentation aids greatly in detection of difficult-to-segment tumor-infiltrating immune cells such as neutrophils and T cells. Last, through improvements in our ability to delineate subsets of tumor-infiltrating T cells, we show that CXCL13-expressing CD8+ T cells tend to be more closely associated with tumor cells than their CXCL13-negative counterparts in data generated from samples from patients with renal cell carcinoma.


Conflict of interest statement

Competing interests: E.W.N. is a co-founder, advisor and shareholder of ImmunoScape and is an advisor for Neogene Therapuetics and Nanostring Technologies. D.C.J. is listed as the inventor in a patent application for methods implemented in Proseg, submitted by the Fred Hutchinson Cancer Center. The other authors declare no competing interests.

Figures

Figure 1
Figure 1. Illustration of Cellular Potts Models and their adaptation to cell segmentation
(a) Cellular Potts models (CPMs) represent cells on a grid of pixels or voxels and repeatedly perturbs cell boundaries to optimize a contrived objecive function. This function can be designed to induce specific behaviors. In the example shown here, cells have higher affinity to those of the same time, and after many iterations of the simulation, migrate and sort themselves (images generated with Morpheus [15]). (b) Proseg (“probabilistic segmentation”) adapts this simulation framework to instead generate cell boundaries that best explain the observed spatial distribution of transcripts, turning a cell simulation methodology into a cell segmentation methodology. In place of a designed objective function a probabilistic model of gene expression is used. In this example, cell boundaries are gradually optimized to explain the distribution of four highly cell type specific genes. (c) Proseg and CPMs operate under the same basic sampling framework, demonstrated here in a section of the MERSCOPE dataset. Cell boundaries are perturbed by copying the label of an adjacent voxel. The change in the objective function is evaluated, determining whether the perturbation is accepted or rejected. This basic sampling procedure is iterated until convergence.
Figure 2
Figure 2. Benchmarking segmentation methods across platforms
Benchmarking of competing segmentation methods across four spatial transcriptomics datasets. (a) Spuriously co-expressed gene pairs were defined as those with rates of co-expression that increase dramatically when nuclear boundaries are expanded. Relative spurious co-expression rates were computed as the rate of co-expression of these spurious pairs relative to nuclear segmentation, with lower rates suggestive of higher quality segmentation. (b) Image-based segmentation methods fail to assign large portions of the transcripts compared to transcript-driven methods like Bering, Baysor, and Proseg. (c) Compared to Proseg and image-based segmentation, Baysor predicts dramatically more cells, suggesting systemic over-segmentation, while Bering predicted far fewer cells. Comparisons of memory and runtime on (d) MERSCOPE and (e) CosMx datasets show that Proseg is generally an order of magnitude more efficient that Baysor and competitive with Cellpose.
Figure 3
Figure 3. Segmentation results on the MERSCOPE lung cancer dataset
(a) UMAP plots corresponding to each segmentation method. Cell type proportions are shown stacked bar plots on the margins. (b) Cell boundaries in two example regions selected from the full dataset compared across segmentation methods, plotted alongside an image of the DAPI stain in these same regions.
Figure 4
Figure 4. Segmentation results on the CosMx lung cancer dataset
(a) UMAP plots with annotated cell types from each segmentation method. Cell type proportions are indicated in stacked bar plots on the margins. (b) A representative example region showing cells segmented by Proseg, along with a selection of cell type specific transcripts.
Figure 5
Figure 5. A comparison of segmentation results on the Xenium lung cancer data
(a) UMAP plots with annotated cell types from each segmentation method. Cell type composition is shown in stacked bar plots on the margins. (b) A region of the sample depicted with annotated cell types using Proseg segmentation. (c) Comparison of cell segmentation in one region, along with specific sets of highly cell type specific transcripts. (d) Differential expression results comparing tumor-adjacent to non tumor-adjacent macrophages, with p-values computed using a Wald test impplemented in DESeq2. Labeled in red are genes that are highly expressed in tumor, thus likely spuriously called due to transcripts being misattributed to adjacent macrophages.
Figure 6
Figure 6. Analysis of the Xenium renal cell carcinoma dataset
(a) UMAP plots for each segmentation method, with cell type proportions shown in stacked bar plots on the margins. (b) Proseg cell segmentation in a region of one tumor sample, plotted along with subsets of cell type specific transcripts. (c) Proximity between various immune cell types and tumor cells is measured by computing the expected number of steps in a random walk on the neighborhood graph before a tumor cell is encountered, and adjusting for the local cell type composition. Bootstrapping was used to estimate 95% confidence intervals around the median. Numbers of each cell type across tumors are shown in Supplementary Table 15. (d) Numbers of T-cell subtypes and NK-cells in proportion to the number of tumor cells in each tumor. (e) Relative composition of T-cell subtypes and NK-cells.
Extended Figure 1
Extended Figure 1. Inferred cells with annotated types across segmentation methods on CosMx lung dataset.
Segmentation methods differ dramatically on the number of cells and apparent cell types, with Bering predicting far fewer cells and Baysor predicting far more that other methods.
Extended Figure 2
Extended Figure 2. UMAP plots for the CosMx lung cancer dataset across segmentation methods
The same UMAP projections are shown colored by cell type (above) and sample (below). We were unable to confidently assign cell types to cells predicted by GeneSegNet..
Extended Figure 3
Extended Figure 3. Annotated cell types and boundaries in the Xenium lung cancer dataset
Annotated cell type across the sample are shown below, along with cell type a selection of specific transcripts and cell boundaries inferred by Proseg (above).
Extended Figure 4
Extended Figure 4. Inferred cell types in the Xenium renal cell carcinoma dataset
Cell in each tumor are shown colored by their predicted cell type, along with cell boundaries and selected cell type specific transcripts in example regions.
Extended Figure 5
Extended Figure 5. UMAP plots for the Xenium renal cell carcinoma dataset across segmentation methods
The same UMAP projections are shown colored by cell type (above) and sample (below).
Extended Figure 6
Extended Figure 6. Comparison of cell boundaries in Xenium RCC
Inferred cell boundaries in two regions of the Xenium RCC dataset, plotted alongside a selection of cell type specific transcripts and alongside an image of the nuclear stain.
Extended Figure 7
Extended Figure 7. Problematic state changes in CPM-inspired models
Possible state changes that require special consideration to preserve the detailed balance property when sampling. Case (a) is irreversible, so we never propose cell annihilation. Cases (c) and (e) are irreversible, so we prohibit the formation of these bubbles in cases (b) and (d). We allow inter-cell bubble formation (f) and popping (g) by introducing an ab nihilo bubble formation proposal (h), which makes (g) reversible, preserving detailed balance.

Update of

References

    1. Chen Kok Hao, Boettiger Alistair N, Moffitt Jeffrey R, Wang Siyuan, and Zhuang Xiaowei. RNA imaging. spatially resolved, highly multiplexed RNA profiling in single cells. Science, 348(6233):aaa6090, April 2015. - PMC - PubMed
    1. He Shanshan, Bhatt Ruchir, Brown Carl, Brown Emily A, Buhr Derek L, Chantranuvatana Kan, Danaher Patrick, Dunaway Dwayne, Garrison Ryan G, Geiss Gary, Gregory Mark T, Hoang Margaret L, Khafizov Rustem, Killing-beck Emily E, Kim Dae, Kim Tae Kyung, Kim Youngmi, Klock Andrew, Korukonda Mithra, Kutchma Alecksandr, Lee Erica, Lewis Zachary R, Liang Yan, Nelson Jeffrey S, Ong Giang T, Perillo Evan P, Phan Joseph C, Phan-Everson Tien, Piazza Erin, Rane Tushar, Reitz Zachary, Rhodes Michael, Rosenbloom Alyssa, Ross David, Sato Hiromi, Wardhani Aster W, Williams-Wietzikoski Corey A, Wu Lidan, and Beechem Joseph M. High-plex multiomic analysis in FFPE at subcellular level by spatial molecular imaging. bioRxiv, page 2021.11.03.467020, January 2022.
    1. Janesick Amanda, Shelansky Robert, Gottscho Andrew, Wagner Florian, Rouault Morgane, Beliakoff Ghezal, Oliveira Michelli Faria de, Kohlway Andrew, Abousoud Jawad, Morrison Carolyn, Drennon Tingsheng Yu, Mohabbat Syrus, Williams Stephen, and Taylor Sarah. High resolution mapping of the breast cancer tumor microenvironment using integrated single cell, spatial and in situ analysis of FFPE tissue. bioRxiv, page 2022.10.06.510405, October 2022.
    1. Beucher S and Meyer F. The morphological approach to segmentation: The watershed transformation. In Mathematical Morphology in Image Processing, pages 433–481. CRC Press, 1992.
    1. Ronneberger Olaf, Fischer Philipp, and Brox Thomas. U-net: Convolutional networks for biomedical image segmentation. arXiv [cs.CV], May 2015.

Substances

LinkOut - more resources