. 2025 Aug;6(8):1419-1437.
doi: 10.1038/s43018-025-00979-2. Epub 2025 May 22.

Tumor antigens preferentially derive from unmutated genomic sequences in melanoma and non-small cell lung cancer

Affiliations

Tumor antigens preferentially derive from unmutated genomic sequences in melanoma and non-small cell lung cancer

Anca Apavaloaei et al. Nat Cancer. 2025 Aug.

Abstract

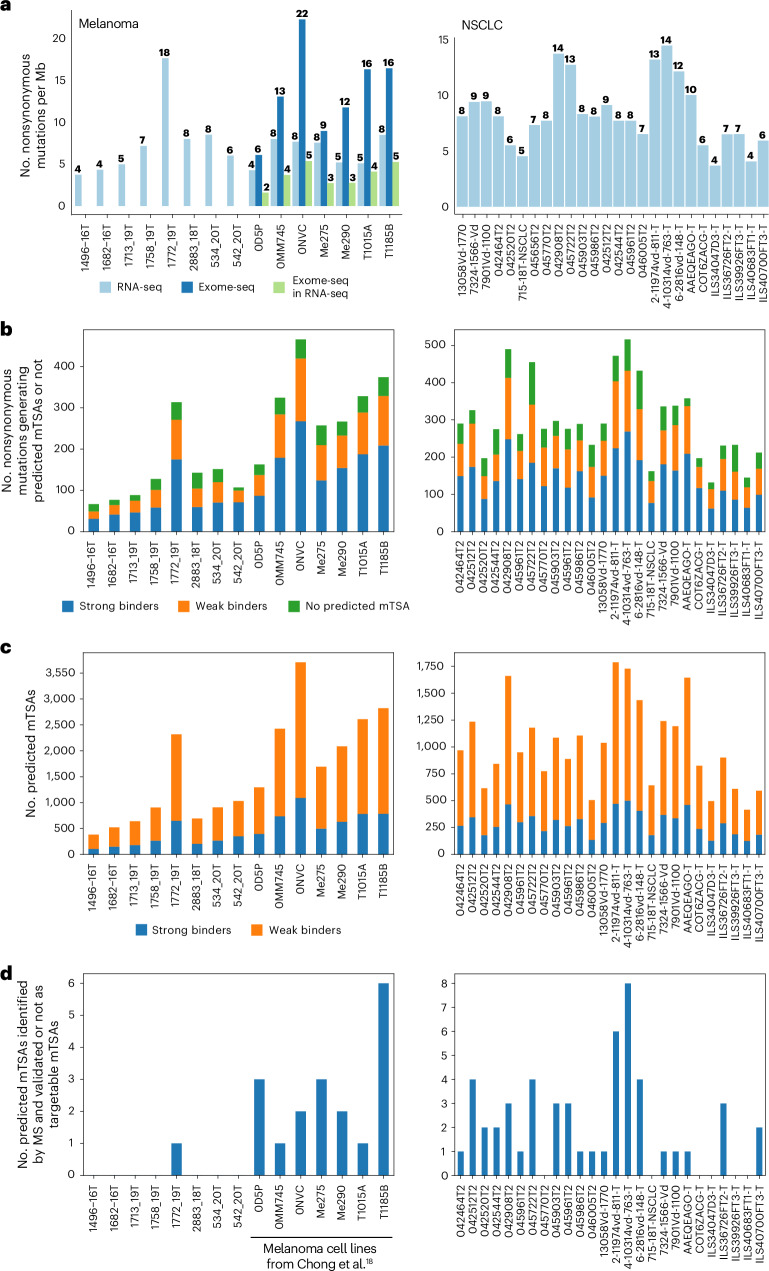
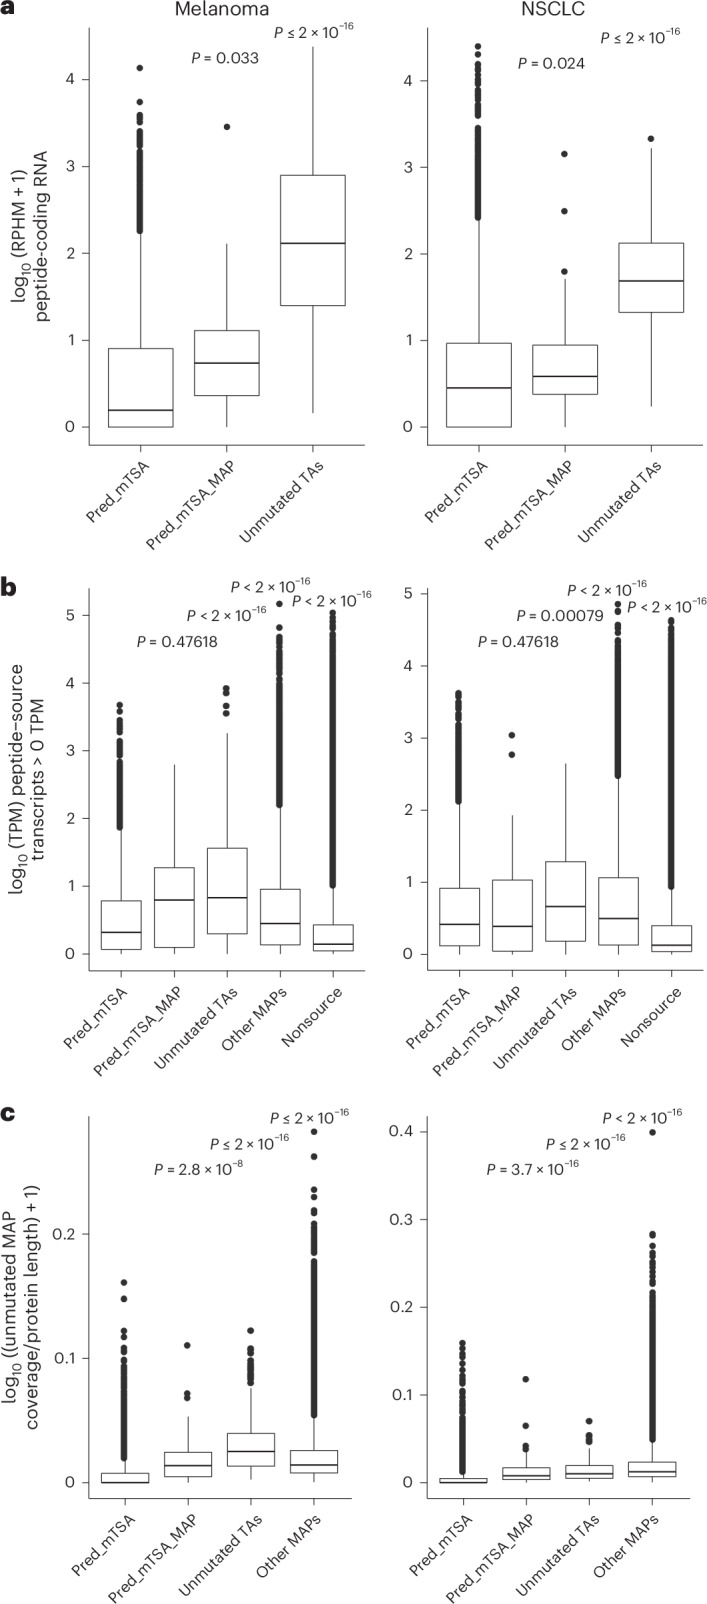
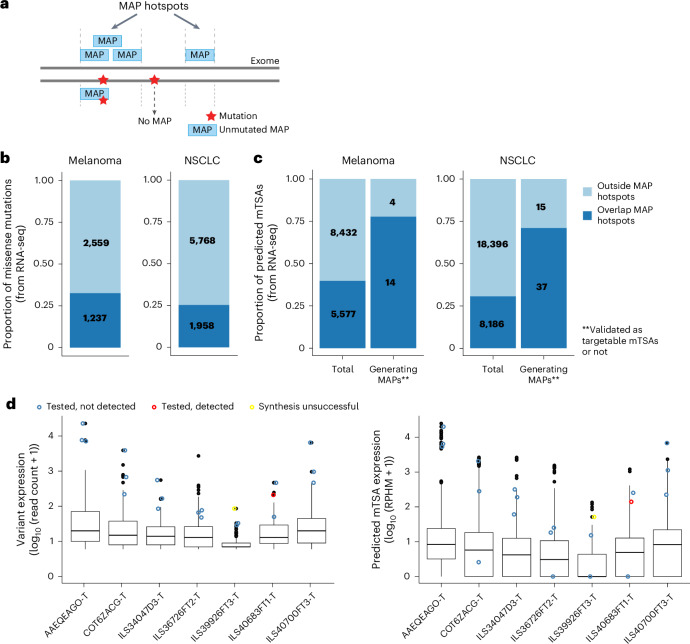
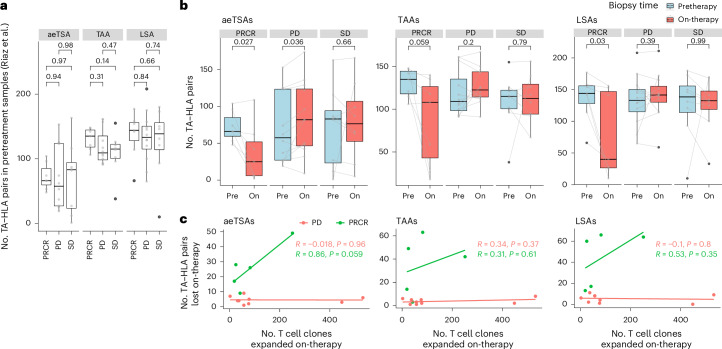
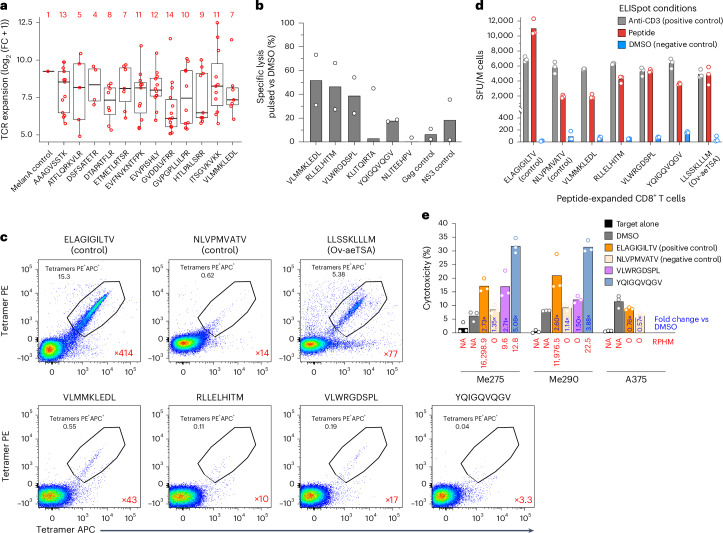
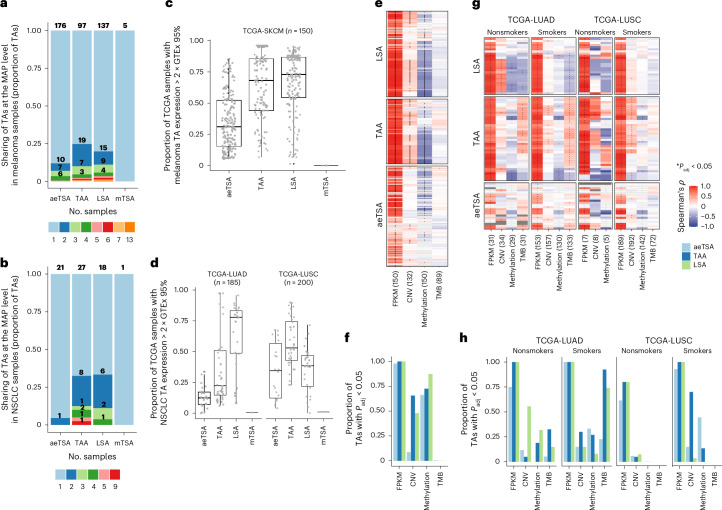
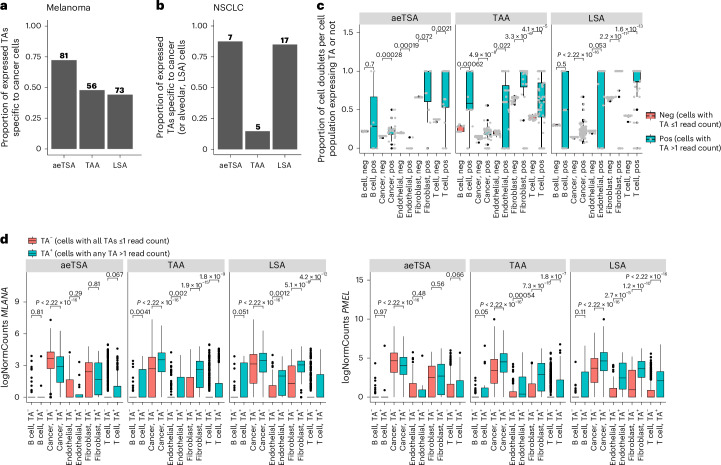
Melanoma and non-small cell lung cancer (NSCLC) display exceptionally high mutational burdens. Hence, immune targeting in these cancers has primarily focused on tumor antigens (TAs) predicted to derive from nonsynonymous mutations. Using comprehensive proteogenomic analyses, we identified 589 TAs in cutaneous melanoma (n = 505) and NSCLC (n = 90). Of these, only 1% were derived from mutated sequences, which was explained by a low RNA expression of most nonsynonymous mutations and their localization outside genomic regions proficient for major histocompatibility complex (MHC) class I-associated peptide generation. By contrast, 99% of TAs originated from unmutated genomic sequences specific to cancer (aberrantly expressed tumor-specific antigens (aeTSAs), n = 220), overexpressed in cancer (tumor-associated antigens (TAAs), n = 165) or specific to the cell lineage of origin (lineage-specific antigens (LSAs), n = 198). Expression of aeTSAs was epigenetically regulated, and most were encoded by noncanonical genomic sequences. aeTSAs were shared among tumor samples, were immunogenic and could contribute to the response to immune checkpoint blockade observed in previous studies, supporting their immune targeting across cancers.


Conflict of interest statement

Competing interests: A.A., K.V., M.-P.H., P.T. and C.P. are named inventors on patent applications filed by the Université de Montréal and covering TAs reported in this article (patent application number WO2024211992, titled Novel tumor antigens for melanoma and uses thereof; patent application number WO2024187278, titled Novel tumor antigens for lung cancer and uses thereof). P.T. and C.P. receive grant support and consultant fees from Epitopea. The other authors declare no competing interests.

Figures

Fig. 1
Fig. 1. Unmutated TAs outnumber mTSAs in melanoma and NSCLC.
a, Number of nonredundant MAPs per TA type identified across primary melanomas and melanoma cell lines from Chong et al. (left) and primary NSCLC (right) samples. b, Scatterplot showing Pearson’s correlation between the total number of MAPs and the number of TAs identified per sample in melanoma (left) and NSCLC (right). c, Tumor purity (left) and immune infiltration (right) scores from ESTIMATE across samples. Box plots show the median (center line) and interquartile range (IQR, box with limits at 25th and 75th percentiles), and whiskers extend to the largest value no further than 1.5 × IQR from the box hinges. P values from two-sided unpaired t-test with NSCLC samples as a reference group; no adjustments were made for multiple testing. Primary melanoma (n = 12 samples), primary NSCLC (n = 26 samples), melanoma cell lines (n = 7 samples) (b,c). d,e, Proportion of TAs corresponding to each biotype for each TA type in melanoma (d) and NSCLC (e). The total number of TAs per cancer type is displayed in a. a,d,e, n = 19 melanoma samples and 26 NSCLC samples. UTR, untranslated region; ncRNA, noncoding RNA. Source data
Fig. 2
Fig. 2. Predicted mTSAs are poor MAP generators.
a, Number of nonsynonymous mutations per Mb per sample in melanoma (left) and NSCLC (right), called from RNA-seq or exome-seq or identified from exome-seq and expressed in the RNA-seq data. b, Stacked bar plot showing the number of nonsynonymous mutations generating at least one predicted mTSA with strong binding affinity to HLA (percent rank elution < 0.5, NetMHCpan-4.1b) or with weak binding affinity to HLA (0.5 < percent rank elution < 2, NetMHCpan-4.1b) or neither. c, Stacked bar plot showing the number of predicted mTSAs per sample in melanoma (left) and NSCLC (right) and binding status according to the strongest binding affinity to the corresponding sample’s HLA alleles. d, Number of predicted mTSAs identified by MS using mTEC k-mer databases in melanoma (left) and NSCLC (right). ad, n = 8 primary melanoma samples, seven melanoma cell lines, 26 NSCLC samples. Source data
Fig. 3
Fig. 3. RNA expression disfavors predicted mTSA presentation.
a, Expression of the peptide-coding RNA sequences for predicted mTSAs generating no MAPs (pred_mTSA), predicted mTSAs generating MAPs (pred_mTSA_MAP) and unmutated TAs, across melanoma (left) and NSCLC (right) samples. RPHM, reads per hundred million reads. Pred_mTSA (melanoma, n = 23,919 peptides; NSCLC, n = 26,271 peptides); pred_mTSA_MAP (melanoma, n = 18 peptides; NSCLC, n = 52 peptides); unmutated TA (melanoma, n = 596 peptides; NSCLC, n = 116 peptides). b, Expression of the transcripts’ (with non-null expression) source of pred_mTSA, pred_mTSA_MAP, unmutated TAs, other MAPs or transcripts generating no MAPs (nonsource), across melanoma (left) and NSCLC (right) samples. TPM, transcripts per million. c, Proportion of amino acids covered by unmutated MAPs per protein corresponding to transcripts with non-null expression source of pred_mTSA, pred_mTSA_MAP, unmutated TAs or other MAPs, across melanoma (left) and NSCLC (right) samples. Pred_mTSA (melanoma, n = 9,133 transcripts; NSCLC, n = 11,999 transcripts); pred_mTSA_MAP (melanoma, n = 24 transcripts; NSCLC, n = 67 transcripts); unmutated TA (melanoma, n = 637 transcripts; NSCLC, n = 183 transcripts); other MAPs (melanoma, n = 187,834 transcripts; NSCLC, n = 270,608 transcripts); nonsource (melanoma, n = 1,085,966 transcripts; NSCLC, n = 2,509,130 transcripts) (b,c). ac, n = 15 melanoma and 26 NSCLC samples. All box plots show the median (center line) and IQR (box with limits at 25th and 75th percentiles), whiskers extend to the largest value no further than 1.5 × IQR from the box hinges, and black dots represent outliers beyond the whiskers. P values from two-sided Wilcoxon’s nonparametric test, with predicted mTSAs’ source RNA or transcripts generating no detectable MAPs as a reference group; no adjustments were made for multiple testing. Source data
Fig. 4
Fig. 4. Predicted mTSAs are preferentially located outside MAP hotspots.
a, Illustration depicting MAP hotspots, defined as the genomic regions generating unmutated canonical MAPs from the IEDB or the HLA Ligand Atlas or identified in this study (n = 506,908 nonredundant MAPs). Somatic mutations within MAP hotspots are expected to have a higher likelihood of MAP generation. b, Proportion (and absolute numbers) of nonsynonymous mutations called from RNA-seq that overlap or not with MAP hotspots across melanoma (left, n = 15) and NSCLC (right, n = 26) samples. c, Proportion (and absolute numbers) of predicted mTSAs called from RNA-seq (total) and of predicted mTSAs called from RNA-seq and detected by MS (generating MAPs) that overlap or not with MAP hotspots across melanoma (left, n = 15) and NSCLC (right, n = 26) samples. d, Box plots showing the expression of nonsynonymous mutations generating predicted mTSAs (in read counts of variant at the location, left) and of predicted mTSA-coding sequences (in RPHM, right) in seven NSCLC samples. Nonsynonymous mutations and the respective predicted mTSAs selected for targeted MS are highlighted in blue (tested, not detected), red (tested and detected) or yellow (synthesis unsuccessful) circles. Number of variants per sample (left): AAEQEAGO-T (n = 327), COT6ZACG-T (n = 166), ILS34047D3-T (n = 109), ILS36726FT2-T (n = 188), ILS39926FT3-T (n = 151), ILS40683FT1-T (n = 112), ILS40700FT3-T (n = 162). Number of predicted mTSAs per sample (right): AAEQEAGO-T (n = 1,644), COT6ZACG-T (n = 825), ILS34047D3-T (n = 495), ILS36726FT2-T (n = 901), ILS39926FT3-T (n = 610), ILS40683FT1-T (n = 414), ILS40700FT3-T (n = 592). Box plots show the median (center line) and IQR (box with limits at 25th and 75th percentiles), whiskers extend to the largest value no further than 1.5 × IQR from the box hinges, and black dots represent outliers beyond the whiskers. Source data
Fig. 5
Fig. 5. aeTSAs may contribute to the response to ICB in melanoma.
a, Box plots showing the number of TA–HLA pairs per pretreatment sample (gray dots) from Riaz et al., according to the response groups from the original study. P values from unpaired two-tailed t-test. PRCR (n = 7 patients), PD (n = 12 patients), SD (n = 8 patients). b, Box plots showing the number of TA–HLA pairs in pretreatment (pre) and on-treatment (on) samples from Riaz et al.. Gray lines connect pretreatment and on-treatment samples per patient; P values from paired two-tailed t-test. PRCR (n = 7 patients), PD (n = 12 patients), SD (n = 8 patients). c, Pearson’s correlation between the number of expanded T cell clones and the number of TA–HLA pairs lost on-therapy per patient (colored dots; PRCR, n = 5 patients; PD, n = 9 patients) from Riaz et al.. Patients with SD were excluded due to the low number of samples with both RNA-seq and TCR-seq data (n = 2 patients). a,b, All box plots show the median (center line) and IQR (box with limits at 25th and 75th percentiles), whiskers extend to the largest value no further than 1.5 × IQR from the box hinges, and black dots represent outliers beyond the whiskers. No adjustments were made for multiple testing. PRCR, PD or SD, as reported by Riaz et al.. Source data
Fig. 6
Fig. 6. aeTSAs are immunogenic.
a, FEST assay showing the expansion of specific CD8+ T cell clonotypes (n indicated in red) following stimulation with the indicated aeTSAs, compared with unpulsed CD8+ T cells (FC, fold change). Box plots show the median (center line) and IQR (box with limits at 25th and 75th percentiles); whiskers extend to the largest value no further than 1.5 × IQR from the box hinges. n = 1 biological sample per peptide. b, Specific lysis (%) of peptide-pulsed B-LCLs after overnight co-incubation with peptide-primed T cells, expressed as percent compared to dimethylsulfoxide (DMSO)-pulsed B-LCLs. Calculated on the mean number of cells from technical triplicates. Bar plot shows the mean of two independent experiments. c, Flow cytometry plots show the percentage of tetramer-positive cells among live CD8+ T cells following expansion with the peptide indicated. The expansion fold of tetramer-positive CD8+ T cells is shown in red compared to the DMSO-expanded CD8+ T cell condition. n = 1 biological sample per peptide. d, Number of spot-forming units (SFU) per 106 (M) CD8+ T cells, measured by an IFN-γ ELISpot assay. Data represent the mean and individual data points for three technical replicates from one independent experiment (n = 1 independent experiment performed). e, Quantification of Incucyte images after 3 h of co-culture. Bar plot represents the percentage of cytotoxicity for each melanoma cell line co-cultured with peptide- or DMSO-primed CD8+ T cells. The MelanA-negative A375 melanoma cell line was used as a negative control for ELAGIGILTV-expanded CD8+ T cells. RNA expression values (RPHM) of each peptide in the respective cell line are displayed in red below each bar. The RPHM value shown for ELAGIGILTV corresponds to the unmodified peptide counterpart, EAAGIGILTV. NA, not applicable. Numbers in blue represent the fold change compared to the DMSO condition. Data represent the mean and individual data points for three technical replicates from one independent experiment (n = 1 independent experiment performed). ae, Anti-aeTSA T cells were generated by priming T cells from healthy donors with autologous peptide-pulsed PBMCs (Methods). Source data
Fig. 7
Fig. 7. TA sharing and expression regulation across cancer samples.
a,b, Stacked bar chart showing the proportion of TA types (and absolute TA numbers) shared between different numbers of melanoma (a, n = 19) and NSCLC (b, n = 26) samples analyzed. c,d, Box plots showing the proportion of TCGA samples expressing each TA (gray dots) at least two times higher than the 95th-percentile value for the respective TA in Genotype–Tissue Expression (GTEx) samples except the testis for melanoma TAs (c) or in normal bronchial brushing samples and GTEx samples except the testis for NSCLC TAs (d). Box plots show the median and IQR, and whiskers extend to the largest value no further than 1.5 × IQR from the box hinges. e,f, Spearman’s correlation between the RPHM expression of each melanoma TA and the corresponding omics value (source gene expression (FPKM, fragments per kilobase of transcript per million mapped reads), copy number variation, methylation βvalue and TMB) across the analyzed SKCM samples from TCGA (e), and the proportion of TAs with a significant correlation (adjusted P value (Padj) < 0.05, heatmap cells with * in e) among TAs with omics data available (non-empty cells in e) (f). g,h, Spearman’s correlation between the RPHM expression of each NSCLC TA and the corresponding omic values (source gene expression (FPKM), copy number variation, methylation β value and TMB) across the analyzed LUSC and LUAD samples from TCGA according to the smoking history status (g) and the proportion of TAs with a significant correlation (Padj < 0.05, cells with * in g) among TAs with omics data available (non-empty cells in g) (h). Numbers in parentheses represent the minimum number of samples analyzed per TA (e,g). Correlation data for TMB in TCGA-LUSC; nonsmokers were excluded due to the low number of samples (n < 5). ae,g, Total TA numbers are per the data in Fig. 1a. Source data
Fig. 8
Fig. 8. TA expression in scRNA-seq data from melanoma and NSCLC.
a, Bar plots showing the proportion (and absolute numbers) of melanoma TAs expressed (read count above 1) in cancer cells only in cutaneous melanoma scRNA-seq data from Zhang et al. (n = 4 samples from three patients). b, Bar plots showing the proportion (and absolute numbers) of NSCLC TAAs and aeTSAs expressed (read count above 1) in cancer cells only and the proportion of NSCLC LSAs expressed in cancer cells and normal alveolar cells only in NSCLC scRNA-seq data from Lambrechts et al. (n = 24 tumor samples from eight patients). c, Proportion of cell doublets among cells expressing a TA (cells expressing TA > 1 read count) versus the TA-negative cell fraction per annotated cell type from cutaneous melanomas (n from Zhang et al. (n = 4 samples from three patients). Each gray dot represents a TA expressed in at least one cell of the respective cell type. TAs analyzed here were those expressed in at least one noncancer cell: aeTSAs (n = 31 TAs), TAAs (n = 61 TAs) and LSAs (n = 92 TAs). Neg, negative; pos, positive. d, Box plots show the normalized expression of MLANA (left) and PMEL (right) in cell types from cutaneous melanoma samples from Zhang et al. (n = 4 samples from three patients), comparing cells expressing at least one TA (TA+) versus cells negative for all TAs (TA). TAs analyzed here were those expressed in at least one noncancer cell: aeTSAs (n = 31 TAs), TAAs (n = 61 TAs) and LSAs (n = 92 TAs). All box plots show the median (center line) and IQR (box with limits at 25th and 75th percentiles), whiskers extend to the largest value no further than 1.5 × IQR from the box hinges, and black dots represent outliers beyond the whiskers. P values from two-sided Wilcoxon’s nonparametric test; no adjustments were made for multiple testing. Source data
Extended Data Fig. 1
Extended Data Fig. 1. Mass spectrometry-based identification of tumor antigens in melanoma and NSCLC.
a, Proteogenomic workflow for TA identification from melanoma and NSCLC samples. Immunopeptidomic and RNA-seq data for melanoma cell lines were obtained from Chong et al.. pMHC-IP, peptide-MHC I immunoprecipitation; MAP, MHC I-associated peptide; LC-MS/MS, liquid chromatography with tandem mass spectrometry; FDR, false discovery rate; RPHM, reads per hundred million. b, Heatmap showing representative expression of the three classes of unmutated TAs identified from melanoma samples across normal tissues [from GTEx, purified melanocytes, purified blood, and bone marrow (BM) cells, mTECs] and melanoma samples (from TCGA, various published datasets,,,, and the present study). Numbers in parentheses show the number of samples. c, The absolute number of non-redundant TAs identified per TA type in primary NSCLC samples, primary melanomas, and melanoma cell lines. Numbers in parentheses indicate the number of samples analyzed. The rate of TA generation expressed as the median number of TAs identified per 1000 total MAPs is also shown per sample group. d, Pearson’s correlation between the tumor purity scores from ESTIMATE and the number of total TAs identified across primary melanoma (melanoma_local, n = 12 samples) and NSCLC samples (lung_local, n = 26 samples). Source data
Extended Data Fig. 2
Extended Data Fig. 2. Quality of TA identifications.
a-b, Identification of Tas using the geometric expression mean across normal versus tumor samples. TA numbers were identified by calculating the fold-change between cancer and normal samples using the arithmetic mean (Tas reported in Supplementary Tables 6 and 7) and with the geometric mean (Tas gained or lost listed in Supplementary Table 25 and 26) for melanoma (a) and NSCLC (b) Tas. aeTSA, aberrantly expressed tumor-specific antige; TAA, tumor-associated antigen; LSA, lineage-specific antigen. c, Violin and box plots showing the proportion of HLA binders (rank elution < 2% in NetMHCpan-4.1b) among 8-11 amino acid peptides across melanoma (left) and NSCLC (right) samples. Each grey dot represents one sample (n = 19 melanoma samples and 26 NSCLC samples studied), and the numbers indicate the median proportion across samples. d, Length distribution of MAPs identified from melanoma (left) and NSCLC (right) samples, compared between canonical MAPs and Tas (p > 0.05; Kolmogorov-Smirnov test). e-f, Spectrum scores I and mass errors (f) of MAPs (n = 119429 canonical and 663 TA MAPs in melanoma, and 108311 canonical and 117 TA MAPs in NSCLCs) identified from melanoma (left) and NSCLC (right) samples, compared between canonical MAPs and Tas (ns, non-significant; two-sided unpaired Wilcoxon’s nonparametric test). g, Pearson’s correlations between observed retention times and predicted retention times (left) or hydrophobicity index (right) for melanoma MAPs according to the TA and canonical MAP status for primary samples analyzed in house or for melanoma cells lines. See Supplementary Table 3 for the sample names analyzed with each mass spectrometer. h, Pearson’s correlations between observed retention times and predicted retention times (left) or hydrophobicity index (right) for NSCLC MAPs according to the TA and canonical MAP status for primary samples analyzed on a Q-Exactive or EXPLORIS mass spectrometer. See Supplementary Table 3 for the sample names analyzed with each mass spectrometer. I, Top: the number of Tas re-identified with group-specific FDR of 5% (calculated separately for canonical and non-canonical peptides) in melanoma (left) and NSCLC (right) samples. Bottom: Dot plot showing the Prosit spectral angle (max value per peptide) and the Prosit Pearson’s r (max value per peptide) across melanoma (left) and NSCLC (right) samples, and color-coded according to their re-identification with the group FDR (see top panel). a-I, n = 19 melanoma samples and 26 NSCLC samples. All box plots show the median (center line) and interquartile range (IQR, box with limits at 25th and 75th percentiles), whiskers extend to the largest value no further than 1.5 * IQR from the box hinges, and black dots represent outliers beyond the whiskers. Source data
Extended Data Fig. 3
Extended Data Fig. 3. MS validation of aeTSAs from NSCLC samples using synthetic peptides.
Mirror plots show the MS spectra, Pearson correlation coefficients for each endogenous peptide, and the corresponding synthetic analog.
Extended Data Fig. 4
Extended Data Fig. 4. MS-based identification of predicted mTSAs.
a, Number of predicted mTSAs identified by mass spectrometry (MS) using mTEC k-mer databases concatenated with all predicted mTSA sequences derived from single- and multi-nucleotide variants and INDELs in melanoma (upper, n = 15 samples) and NSCLC (lower, n = 26 samples). b, Heatmap showing the expression of all RNA sequences with perfect alignment to the reference genome+dbSNP155 coding for 43/48 non-redundant predicted mTSAs identified by mass spectrometry (from panel a and Fig. 2d) across normal tissues [from GTEx, purified melanocytes, bronchial brushing samples (GSE79209), purified blood and bone marrow (BM) cells, mTECs] and the cancer samples analyzed herein. Numbers in parentheses represent the number of samples analyzed. c, Heatmap showing the expression of the mutated RNA sequences corresponding to 5/48 non-redundant predicted mTSAs identified by mass spectrometry (from panel a and Fig. 2d) that had no perfect alignment to the reference genome+dbSNP155 across normal tissues [from GTEx, purified melanocytes, bronchial brushing samples (GSE79209), purified blood and bone marrow (BM) cells, mTECs] and cancer samples (from TCGA, various published datasets,,,,,–, or analyzed herein). Peptide RVWDVSGLRK was a predicted mTSA generated from the Ile164Val variant in COPA at the RNA editing site chr1:160332454110. Numbers in parentheses represent the number of samples analyzed. d, Bar plot shows the read count expression of RNA sequences coding for the predicted mTSAs identified by MS and with perfect alignment to the reference genome+dbSNP155 (peptides from panel b, 10/43 peptides excluded due to respective mutation selected with dbSNP149 matching variant in dbSNP155), for their corresponding mutated sequences (dark blue) and sequences matching the reference genome+dbSNP155 (light blue). *, expression of the non-synonymous mutated sequence is higher than the unmutated sequences coding for the same peptide in the sample of origin. Source data
Extended Data Fig. 5
Extended Data Fig. 5. Selected features of transcripts source of predicted mTSAs and other MAPs.
a, Predicted instability index from protParam for the reference protein sequences corresponding to the transcripts source of predicted mTSAs generating no MAPs (pred_mTSA_source), predicted mTSAs generating MAPs (pred_mTSA_MAP-source), unmutated TAs (unmutated_TA-source), and other MAPs (other MAP-source) across melanoma (left, n = 15 samples) and NSCLC (right, n = 26 samples) samples. The red dotted line corresponds to an instability index of 40, above which proteins are predicted to be unstable. pred_mTSA_source (n = 8764 transcripts, melanoma; n = 11490, NSCLC), pred_mTSA_MAP-source (n = 24 transcripts, melanoma; n = 65, NSCLC), unmutated_TA-source (n = 619, melanoma; n = 179, NSCLC), other MAP-source (n = 178333 transcripts, melanoma; n = 255944, NSCLC). b, Proportion of disordered residues from IUPred per reference protein sequences corresponding to the transcripts source of predicted mTSAs generating no MAPs (pred_mTSA_source), predicted mTSAs generating MAPs (pred_mTSA_MAP-source), unmutated TAs (unmutated_TA-source), and other MAPs (other MAP-source) across melanoma (left, n = 15 samples) and NSCLC (right, n = 26 samples) samples. pred_mTSA_source (n = 9133 transcripts, melanoma; n = 12002, NSCLC), pred_mTSA_MAP-source (n = 24 transcripts, melanoma; n = 67, NSCLC), unmutated_TA-source (n = 637, melanoma; n = 183, NSCLC), other MAP-source (n = 187928, melanoma; n = 268142, NSCLC). c, Proportion of residues prone to ubiquitination from UbPred per reference protein sequences corresponding to the transcripts source of i) predicted mTSAs generating no MAPs (pred_mTSA_source), ii) predicted mTSAs generating MAPs (pred_mTSA_MAP-source), iii) unmutated TAs (unmutated_TA-source), and iv) other MAPs (other MAP-source) across melanoma (left, n = 15 samples) and NSCLC (right, n = 26 samples) samples. The number of transcripts per category were: pred_mTSA_source (n = 8763 in melanoma; n = 11493 in NSCLC), pred_mTSA_MAP-source (n = 24 in melanoma; n = 65 in NSCLC), unmutated_TA-source (n = 619 in melanoma; n = 179 in NSCLC), other MAP-source (n = 178414 in melanoma; n = 256064 in NSCLC). d, Genomic distribution of MAPs defining MAP hotspots. Each black line across the chromosomes represents the genomic start site of a canonical MAP from IEDB, the HLA ligand atlas, or identified in this study (n = 506,908 non-redundant MAPs). e, Proportion (and absolute numbers) of TAAs from melanoma (left) and NSCLC (right) samples (reported in Fig. 1a and Supplementary Tables 6 and 7) that overlap or not with MAP hotspots. n = 19 melanoma and 26 NSCLC samples. f, Proportion (and absolute numbers) of MAPs predicted from normal PBMC-derived non-synonymous germline variants on Chr1 (total) and those predicted and detected by MS in the matched melanoma cell lines (generating MAPs) that overlap or not with MAP hotspots. OR = 0.1824, p < 0.0001, Fisher’s exact test. n = 7 melanoma cell lines. g, Expression of the transcripts (with non-null expression) source of MAPs predicted from non-synonymous germline variants on Chr1 that were not detected by mass spectrometry (pred_germline-source), or were detected by mass spectrometry (pred_germline_MAP-source), unmutated TAs, and other MAPs, across melanoma cell lines. TPM, transcript per million. Pred_germline-source (n = 5027 transcripts); pred_germline_MAP-source (n = 84 transcripts); unmutated_TAs (n = 532 transcripts); other_MAPs (n = 128510 transcripts). n = 7 melanoma cell lines. h, Heatmap showing the expression of the unmutated RNA sequences matching the reference genome+dbSNP and coding for 16/21 predicted mTSAs selected from seven NSCLC samples to be tested using targeted mass spectrometry, across normal tissues [from GTEx, purified melanocytes, bronchial brushing samples (GSE79209), purified blood and bone marrow (BM) cells, mTECs]. 5/21 predicted mTSAs selected for targeted mass spectrometry had no perfect alignment to the reference genome+dbSNP and are not shown. The number of samples analyzed per tissue is noted in parentheses. i, Mirror plot showing the MS spectra and Pearson correlation coefficient (r) for the endogenous predicted mTSA identified (bottom) and its corresponding synthetic analog (top). All box plots show the median (center line) and interquartile range (IQR, box with limits at 25th and 75th percentiles), whiskers extend to the largest value no further than 1.5 * IQR from the box hinges, and black dots represent outliers beyond the whiskers. Significance values from two-sided Wilcoxon test, with predicted mTSAs generating no MAPs as a reference group; no adjustments were made for multiple testing. Source data
Extended Data Fig. 6
Extended Data Fig. 6. The predicted presentation of unmutated TAs in melanoma and NSCLC samples from patients receiving ICB.
a, b, Box plots showing the number of TA-HLA pairs (that is, the sum of the HLA alleles per sample capable of presenting each expressed TA) per pre-treatment sample (grey dots) from various published studies in melanoma,,,, (a) and NSCLC, (b), according to the response groups from the original studies. P-values from unpaired two-tailed T-test; no adjustments were made for multiple testing. Numbers in parentheses represent number of patients per response group. c, d, Box plots showing the number of TA-HLA pairs in pre- and on-treatment samples from Gide et al. (c) and Du et al. (d) according to the response groups from the original studies. Grey lines connect pre- and on-treatment samples per patient; p-values from paired two-tailed T-tests are indicated, with no adjustments made for multiple testing. Numbers in parentheses represent number of patients per response group. e, Box plots showing the difference in purity scores from ESTIMATE between on- and pre-therapy samples, where negative values indicate a decrease in tumor purity on-therapy in samples from Riaz et al. (left). The heatmap on the right shows Pearson’s correlation coefficient between the purity change (from the left panel) and the change in the number of TA-HLA pairs in on- vs. pre-ICB samples from corresponding patients. Numbers in parentheses represent number of patients per response group. f, FEST assay showing the expansion of specific CD8 T cell clonotypes following in vitro stimulation with the indicated aeTSAs selected based on their complete loss of RNA expression on-therapy in at least one responder from Riaz et al.. Number of TCRB clonotypes expanded per condition listed in Supplementary Table 16. g, Flow cytometry gating strategy for cytotoxicity experiments analyzed by flow (plots from experiment 1 and replicate 1 of condition B-LCLs m13 + T m13, Fig. 6b and Source Data Fig.5e). The cell morphology was used to gate on viable cells based on FSC-A (size) and SSC-A (complexity). Then, FSC-A and FSC-H were used to gate on singlet cells. Finally, remaining viable B-LCL target cells were gated and counted based on CFSE+/7-AAD staining. All box plots show the median (center line) and interquartile range (IQR, box with limits at 25th and 75th percentiles), whiskers extend to the largest value no further than 1.5 * IQR from the box hinges, and black dots represent outliers beyond the whiskers. Source data
Extended Data Fig. 7
Extended Data Fig. 7. Immunogenicity assays and sharing of unmutated Tas.
a-b, Flow cytometry plots showing the gating strategy used to quantify the percentage of expanded peptide-positive CD8 T cells shown in Fig. 6c, using the VLWRGDSPL-expanded condition as a representative example (a), and the percentage of peptide-specific CD8 T cells in the DMSO condition for all peptides shown in Fig. 6c (b). n = one biological sample per peptide. c, Representative images of the cytotoxicity assay using CellTracker GFP (green) as a marker for live target cells (Me275, Me290, and A375) and YOYO-3 (red) as a marker of dead cells, captured by Incucyte® S3 live-cell imaging at the 3 h time point. White arrows point to target cells killed by specific T cells (orange/yellow/red with faint green). The scale bar is 100 µm. d, Percentage of cytotoxicity at different time points in the T-cell killing assay imaged over time using an Incucyte for each melanoma cell line indicated. The 3 h time point is presented in Fig. 6e. The dotted line represents the maximum cytotoxicity level across time points in the DMSO condition. Data represent the mean and standard deviation of three technical replicates at each time point per condition. e-f, Stacked bar chart showing the proportion (and absolute numbers) of genes generating TAs across different numbers of melanoma (e, n = 19 samples) and NSCLC (f, n = 26 samples) samples analyzed. Source data
Extended Data Fig. 8
Extended Data Fig. 8. TA expression according to cancer subtype, smoking history and select oncogene status.
a, Box plots showing the stemness scores obtained using ssGSEA in the TCGA samples studied herein across the LUAD, LUSC, and SKCM cohorts. P-values from two-sided Wilcoxon test. Numbers in parentheses indicate the number of samples analyzed per tissue. b, Number of TAs identified in the primary NSCLC samples studied here, based on the NSCLC subtype. P-values for comparing adenocarcinoma (LUAD) and squamous cell carcinoma (LUSC) samples using a two-tailed unpaired T-test. Numbers in parentheses indicate the number of samples. c, Non-synonymous mutation rates (obtained from Firebrowse) in samples analyzed from TCGA, according to their NSCLC subtype and smoking history from cBioPortal. P-values for the comparison between smokers and non-smokers from a two-tailed unpaired T-test. Numbers in parentheses indicate the number of samples. d, RNA expression for unmutated TAs in TCGA samples analyzed according to the NSCLC subtype and smoking history. P-values for the comparison between smokers and non-smokers from a two-tailed Wilcoxon test. Numbers in parentheses indicate the number of samples. aeTSA (n = 22), TAA (n = 40), LSA (n = 27). e, Number of TAs with non-null RNA expression across TCGA samples analyzed according to the NSCLC subtype and smoking history. P-values for the comparison between smokers and non-smokers from a two-tailed unpaired T-test. Numbers in parentheses indicate the number of samples. f, Comparison of TCGA-LUSC and TCGA-LUAD patient numbers expressing ≥ median numbers of TAs with high expression (heTA, for each TA type) versus the others, among patients with (MUT) or without (WT) mutations in indicated genes (P-values from Fisher’s exact test). The number of patients per group is shown above each bar. All box plots show the median (center line) and interquartile range (IQR, box with limits at 25th and 75th percentiles), whiskers extend to the largest value no further than 1.5 * IQR from the box hinges, and black dots represent outliers beyond the whiskers. No p-value adjustments were made for multiple testing. Source data
Extended Data Fig. 9
Extended Data Fig. 9. Annotation of scRNA-seq data from previous studies of melanoma and NSCLC.
a, Balloon plot showing the average expression and proportion of cells expressing the indicated genes used for cluster annotation in each cluster identified across cutaneous melanoma samples from Zhang et al. (n = 4 samples from 3 patients). The genes used for cluster annotation were obtained from the original article. b, UMAPs showing the clusters identified (upper) and their cell type annotation according to the genes in (a) (lower) across cutaneous melanoma samples from Zhang et al.. c, Balloon plot showing the average expression and proportion of cells expressing the indicated genes used for cluster annotation in each cluster identified across NSCLC samples from Lambrechts et al. (n = 24 tumor samples from 8 patients). The genes used for cluster annotation were obtained from the original article. d, UMAPs showing the clusters identified (upper) and their cell type annotation according to the genes in (c) (lower) across NSCLC samples from Lambrechts et al..
Extended Data Fig. 10
Extended Data Fig. 10. Expression of unmutated TAs in scRNA-seq data from melanoma and NSCLC.
a, Box plots showing the read count of cancer-specific melanoma TAs from Fig. 8a across cell types from cutaneous melanoma samples from Zhang et al. (n = 4 samples from 3 patients). Each grey dot represents one TA per cell. aeTSAs (n = 81 TAs), TAAs (n = 56 TAs), LSAs (n = 73 TAs). b, Box plots showing the read count of cancer-specific NSCLC TAs or cancer- and alveolar-specific NSCLC LSAs from Fig. 8b across cell types from NSCLC samples from Lambrechts et al. (n = 24 samples from 8 patients). Each grey dot represents one TA per cell. aeTSAs (n = 7 TAs), TAAs (n = 5 TAs), LSAs (n = 17 TAs). c, Box plots showing the read count of melanoma TAs expressed in non-cancer cell types from cutaneous melanoma samples from Zhang et al. (n = 4 samples from 3 patients). Each grey dot represents one TA per cell. aeTSAs (n = 31 TAs), TAAs (n = 61 TAs), LSAs (n = 92 TAs). d, Box plots showing the read count of NSCLC TAs expressed in non-cancer cell types from NSCLC samples from Lambrechts et al. (n = 24 samples from 8 patients). Each grey dot represents one TA per cell. aeTSAs (n = 1 TA), TAAs (n = 29 TAs), LSAs (n = 3 TAs). All box plots show the median (center line) and interquartile range (IQR, box with limits at 25th and 75th percentiles), whiskers extend to the largest value no further than 1.5 * IQR from the box hinges, and black dots represent outliers beyond the whiskers.

References

    1. Haen, S. P., Löffler, M. W., Rammensee, H. G. & Brossart, P. Towards new horizons: characterization, classification and implications of the tumour antigenic repertoire. Nat. Rev. Clin. Oncol.17, 595–610 (2020). - PMC - PubMed
    1. Capietto, A.-H., Hoshyar, R. & Delamarre, L. Sources of cancer neoantigens beyond single-nucleotide variants. Int. J. Mol. Sci.23, 10131 (2022). - PMC - PubMed
    1. Riaz, N. et al. Tumor and microenvironment evolution during immunotherapy with nivolumab. Cell171, 934–949 (2017). - PMC - PubMed
    1. Kim, J. Y., Choi, J. K. & Jung, H. Genome-wide methylation patterns predict clinical benefit of immunotherapy in lung cancer. Clin. Epigenetics12, 119 (2020). - PMC - PubMed
    1. Van Allen, E. M. et al. Genomic correlates of response to CTLA-4 blockade in metastatic melanoma. Science352, 207–212 (2015). - PMC - PubMed

Substances