. 2025 May 22;44(1):155.
doi: 10.1186/s13046-025-03413-8.

HBV sequence integrated to enhancer acting as oncogenic driver epigenetically promotes hepatocellular carcinoma development

Affiliations

HBV sequence integrated to enhancer acting as oncogenic driver epigenetically promotes hepatocellular carcinoma development

Lu Chen et al. J Exp Clin Cancer Res. .

Abstract

Background: HBV integration is considered as the main contributor to hepatocellular carcinoma (HCC). However, whether HBV integrated sequences determine genotype pathogenicity and how to block their function during HCC progression remains unclear.

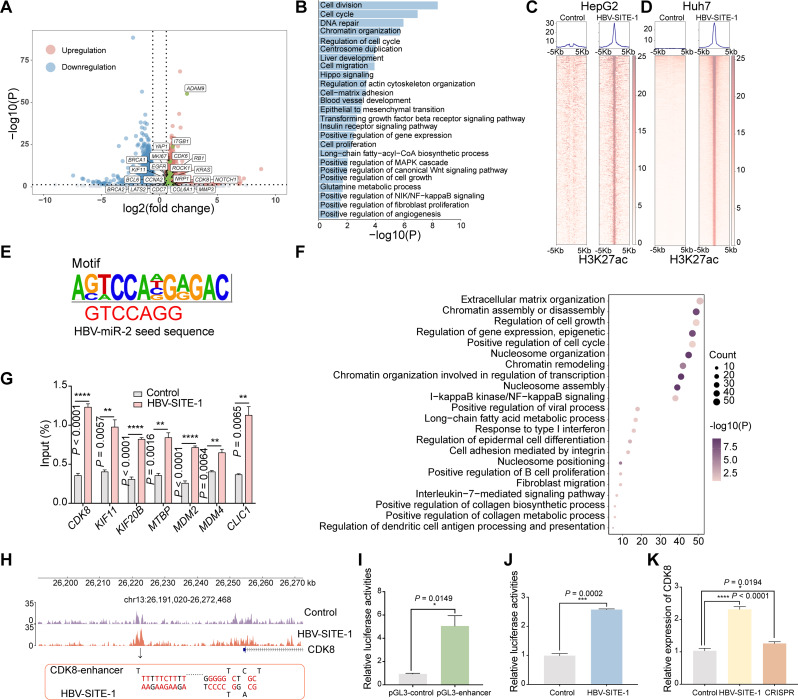
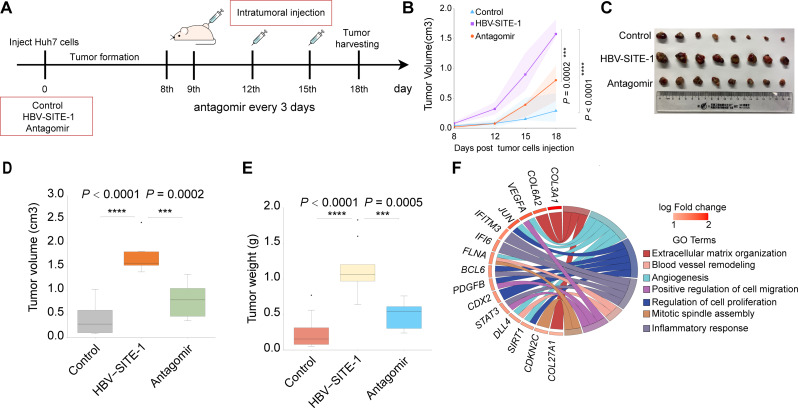
Methods: An in vitro HBV-infected PHH model and liver cancer cell lines were established to confirm the pathogenic potential of HBV-SITEs. The roles of HBV-SITE-1 in HCC development were analyzed using cellular phenotypic assays and molecular biology techniques, including the combined analysis of RNA-seq and ChIP-seq. Animal models were also used to evaluate the therapeutic effect of HBV-miR-2 inhibitors.

Results: We identified nine fragments of HBV Sequences Integrated To Enhancer, termed as "HBV-SITEs". Particularly, a single nucleotide variation (T > G) was embedded at seed sequence of HBV-miR-2 in the highest integrated HBV-SITE-1 between genotypes B and H. Unexpectedly, B-HBV-SITE-1, not H-HBV-SITE-1, could abnormally activate oncogenic genes including TERT and accelerate HCC cell proliferation and migration. Meanwhile, HBV-miR-2 was gradually increased in HBV-infected cells and patient plasma with different HCC stages. Importantly, 227 genes upregulated by HBV, were also activated by HBV-miR-2 through triggering HBV-SITE-1 enhancer. Conversely, enhancer activities were particularly decreased by HBV-miR-2 inhibitors, and further downregulated activated oncogenic genes. Finally, HCC growth was dramatically restrained and HBV-induced transcripts were systematically reduced via injection of HBV-miR-2 inhibitors in animal models.

Conclusion: HBV-SITEs were identified as novel oncogenic elements for HCC, which provides an insightful perspective for the other cancers caused by oncogenic DNA viruses. We demonstrated that the integrated HBV sequence itself acted as oncogenic enhancers and nucleotide variations of HBV genotypes account for particular pathogenic progression, supporting that the viral nucleotide sequences are vital pathogenic substances beyond viral proteins. And modulation of their enhancer activities could be clinically achievable strategy for blocking DNA viruses-related cancer progression in the future.

Keywords: Enhancer; HBV Sequences Integrated To Enhancer (HBV-SITEs); HBV integration; Hepatocellular carcinoma (HCC); Nuclear activating miRNA.


Conflict of interest statement

Declarations. Ethics approval and consent to participate: All animal experiments were approved by the Fudan Committee on Animal Care and in compliance with ethical guidelines. The use of human serums was obtained with the approval of the Committee of Zhongshan Hospital of Fudan University. All patients provided informed consent. Consent for publication: All authors agreed on the manuscript. Competing interests: Shuai Yang is the R&D Director for Shanghai Epicurer Biotechnology Co., Ltd. Wenqiang Yu serves on the Scientific Advisory Board of Epicurer. Epicurer have approved pending patents related to this work. All the other authors declare no competing interests.

Figures

Fig. 1
Fig. 1
HBV-SITEs promote the HCC cell proliferation and migration. A HBV integration events in HBV-infected PHH cells. The junctions between human and HBV sequences were visualized by Circos. The black arrow lines connecting the HBV genome and the human chromosomes at different loci represent the locations of integration. B The integration frequency of HBV DNA sequence segmentally. The gray circle from the inside out represents the integration frequency from low to high, and the innermost circle represents the viral protein encoded by HBV. C The frequency of the integration sites into human enhancers. The height of pink charts represents the probability of integration into the enhancers. D Evaluation of enhancer activities by dual luciferase reporter assays. Transfection of PGL3-HBV-SITEs plasmids in HEK293T cells. E Enrichment analysis of the genes surrounding the integration of HBV-SITEs in HBV-infected PHH. F Enrichment analysis of upregulated genes in HBV-infected PHH coincided with genes surrounding the integration of HBV-SITEs. G Analysis of oncogenic genes near the HBV-SITE-1 with the highest integrated frequency. H Transcripts from HBV-SITEs detected by RT-qPCR in four established HBV cell models. I-J Assessment of cell proliferation by CCK8 (I) and clone formation assay (J) in Huh7 cells transfected with HBV-SITE-1. K Cell proliferation ability evaluated by EdU/Hoechst immunostaining in HepG2 cells after HBV-SITE-1 transfection. L Alteration of cell cycle detected by flow cytometry analysis after HBV-SITE-1 transfection. M Migration ability detected by transwell assays with transfected HBV-SITE-1. N Changed proliferation of liver cancer cells after inhibition of HBV-SITE-1
Fig. 2
Fig. 2
HBV-SITE-1 activates oncogenic gene expression interacting with enhancers. A Differential expressed genes in HepG2 caused by HBV-SITE-1. The regulated genes marked in boxes are known oncogenic genes for HCC development. B Gene ontology (GO) enrichment analysis of upregulated genes by HBV-SITE-1. C Peak enrichment of H3K27ac modification in the HepG2 cells transfected HBV-SITE-1 by HOMER peak calling analysis. Each row represents one peak centered at the midpoint between two 5 kb flanking sequences. D Peak enrichment of H3K27ac modification in the Huh7 cells transfected HBV-SITE-1. Each row represents one peak centered at the midpoint between two 5 kb flanking sequences. E A motif similar to the sequence of HBV-miR-2 seed sequence is identified in enriched H3K27ac regions induced by HBV-SITE-1. The sequence in red font is the seed sequence of HBV-miR-2. F GO enrichment analysis of the genes within upstream and downstream 500 kb centered with the significant enrichment H3K27ac peaks. G Enrichments of H3K27ac in the corresponding enhancers with upregulated genes by ChIP-qPCR. H H3K27ac enrichment in the corresponding enhancer of CDK8 targeted by HBV-SITE-1. I Activity of the potential enhancers of CDK8 assessed by Dual-Luciferase Reporter Assay in HEK293T cells after pGL3-CDK8-enhancer transfection. J CDK8 specific enhancer activity was increased when transfected HBV-SITE-1 detected by Dual-Luciferase Reporter Assay in HEK293T cells. K CDK8 enhancer mediated genes activation confirmed by CRISPR technology. CDK8 was decreased after knocking out corresponding enhancer in HBV-SITE-1 transfected HepG2 cells
Fig. 3
Fig. 3
Nucleotide variation of HBV-SITE-1 (T > G) leads to the minor pathogenicity of HBV genotype H. A Conservation analysis of the seed sequence of HBV-miR-2 embedded in HBV-SITE-1 among HBV genotypes B, C, and H. The dotted box marks the seed sequence of HBV-miR-2 and the single nucleotide variation (T > G) was marked in green box. B-C GO (B) and KEGG (C) analysis of the genes upregulated by HBV-SITE-1 in genotype H compared with genotype B. D Among the 113 genes, 66 oncogenic genes displayed were not upregulated by H-HBV-SITE-1 compared to B-HBV-SITE-1. E Expression levels of genes induced by H-HBV-SITE-1 detected by RT-qPCR compared to the B-HBV-SITE-1. F-H Proliferation and migration ability of HepG2 cells evaluated by CDK8 (F), EdU (G), and transwell (H) assays in H-HBV-SITE-1 compared with B-HBV-SITE-1
Fig. 4
Fig. 4
Long-term HBV infection induces particular oncogenic patterns during HCC progression. A Schematic of the PHH cells infected with HBV. Cells were obtained after HBV infection for 2 days, 7 days, and 28 days. B KEGG Pathway enrichment analysis in HBV infection PHH 2 days, 7 days, and 28 days. C Heatmaps of cell cycle, cell metabolism, and cancer pathway for HBV infection 2 days, 7 days, and 28 days. D Workflow on the selection of both upregulated genes in clinical samples from the GEO database and HBV-infected PHH cells. In the GEO database, 2554 genes are upregulated in HCC (n = 45) compared with CHB (n = 20) and 1926 genes were upregulated in HCC compared with liver cirrhosis (n = 10). 1748 upregulated genes selected from HBV-infected PHH cells for 28 days. 336 genes are both upregulated between 1748 and 2554 genes, while 216 genes are both upregulated between 1748 and 1926 genes. E GO and KEGG analysis on the both upregulated 336 genes selected from HCC clinical databases and HBV-infected PHH cells. F Heatmap of 336 upregulated genes were displayed on the left and the top 54 genes (threshold: > 7 folds) presented on the right. G, Expression of HBV-miR-2 along with HBV infection detected by RT-qPCR. H HBV-miR-2 highly expressed in the tumor tissue compared with the adjacent normal tissues (n = 20). I HBV-miR-2 detected in higher level in the patient plasma of HCC (n = 13) compared with in chronic hepatitis B (n = 12) and HBV-related liver cirrhosis (n = 11). J Gene ontology (GO) analysis of the up-regulated genes in PHH with HBV-miR-2 transfection
Fig. 5
Fig. 5
Targeting HBV-SITE-1 downregulates tumorigenic genes through decreasing enhancer activity. A Profiling of H3K27ac enrichments in HBV infected HepG2-NTCP cells. Total 5271 H3K27ac peaks in HBV-infected HepG2-NTCP were significantly decreased by HBV-miR-2 inhibitors. Each row represents one peak centered at the midpoint between 5 kb flanking sequences. B KEGG analysis of genes surrounding at 3665 enhancers in HBV-infected HepG2-NTCP cells. The 3665 selected enhancers activities were specific targets due to their increases in 5271 H3K27ac peaks induced by HBV infection and simultaneously decreases in 4362 enhancer regions by HBV-miR-2 inhibitor. C GO enrichment analysis of the 369 specific genes targeted by HBV-miR-2. The 1305 upregulated genes are caused by HBV infection and the 650 genes are downregulated by HBV-miR-2 inhibitors in HepG2-NTCP cells. The 369 genes are specifically regulated by HBV-miR-2 due to these genes selected from the upregulated 1305 genes and simultaneously downregulated in 650 genes. D IGV visualization of H3K27ac peaks in HBV-infected HepG2-NTCP cells. Each peak chart shows the H3K27ac enrichments in control HepG2-NTCP cells (upper), HBV-infected HepG2-NTCP cells (medium), and HBV-infected HepG2-NTCP cells with HBV-miR-2 inhibitor transfection (bottom). The regions on the alteration of enhancer activities are marked in light green boxes. E HBV-miR-2 inhibitors specific downregulated genes from HBV infection in HepG2-NTCP cells detected by RT-qPCR
Fig. 6
Fig. 6
Targeting HBV-SITE-1 suppresses gene activation induced by HBV infection. A Schematic of the HBV-miR-2 inhibitor in HBV-infected PHH cells. HBV-miR-2 inhibitor transfected PHH cells at 4th, 11th and 25th, and these cells were collected to conducted RNA-seq at the 7th day, 14th day, and 28th day. B HBV-miR-2 inhibitor sequentially downregulated the inflammatory, metabolism, and cancer development-related genes in HBV infected PHH cells at the 7th day, 14th day, and 28th day. C KEGG analysis of 659 downregulated genes by HBV-miR-2 inhibitor in HBV infected PHH 28 days. D HBV-miR-2 inhibitor particularly decrease expression of genes encoding collagen. E Sankey diagrams displaying the biological function of the specific 276 genes. These 276 selected genes were upregulated by HBV infection and downregulated by HBV-miR-2 inhibitor treatment in HBV infected PHH cells 28 days. F 115 genes downregulated by HBV-miR-2 inhibitor were both upregulated in HBV infected PHH cells and HCC clinical samples. G GO enrichment analysis of these 115 genes. H Survival analysis curve of CCNB2 in HCC
Fig. 7
Fig. 7
Intratumor treatment of HBV-miR-2 antagomirs inhibit tumor growth in vivo. A Schematic of the process of xenograft tumor model experiments. Intra-tumoral injection of HBV-miR-2 antagomir conducted at 9th, 12th and 15th day, and harvested at 18th day. B Growth curve by measuring the volume of tumors in mice by days. C Tumor tissues obtained at 18 days. The tumor sizes decreased by HBV-miR-2 antagomir. D-E Volume (D) and weight (E) of tumors decreased by HBV-miR-2 antagomir. F GO analysis of downregulated genes by HBV-miR-2 antagomir
Fig. 8
Fig. 8
Intravenous treatment of HBV-miR-2 antagomirs prevent HBV-induced disease progression in vivo. A Schematic design in HDI models with systematically HBV-miR-2 antagomir. The liver and plasma samples were obtained to perform ELISA and RT-qPCR after 7 days. B HBV-miR-2 could be specifically downregulated by HBV-miR-2 antagomir in HDI models. C GO analysis of HBV-miR-2 antagomir downregulated genes related to inflammation in mouse liver. D Heatmap showing the inflammatory-related genes by HBV-miR-2 antagomir in HBV-infected mouse livers. E HBV-miR-2 antagomir reduces the accumulation of collagen fibers in mouse liver by Sirius red staining

Similar articles

References

    1. Panduro A, Roman S, Laguna-Meraz S, Jose-Abrego A, Hepatitis B, Virus Genotype H. Epidemiological, molecular, and clinical characteristics in Mexico. Viruses. 2023;15(11). - PMC - PubMed
    1. Bello KE, Mat Jusoh TNA, Irekeola AA, Abu N, Mohd Amin NAZ, Mustaffa N et al. A Recent Prevalence of Hepatitis B Virus (HBV) Genotypes and Subtypes in Asia: A Systematic Review and Meta-Analysis. Healthcare (Basel). 2023;11(7). - PMC - PubMed
    1. Sozzi V, Shen F, Chen J, Colledge D, Jackson K, Locarnini S, et al. In vitro studies identify a low replication phenotype for hepatitis B virus genotype H generally associated with occult HBV and less severe liver disease. Virology. 2018;519:190–6. - PubMed
    1. Kim BK, Revill PA, Ahn SH. HBV genotypes: relevance to natural history, pathogenesis and treatment of chronic hepatitis B. Antivir Ther. 2011;16(8):1169–86. - PubMed
    1. Collaborators GBDHB. Global, regional, and National burden of hepatitis B, 1990–2019: a systematic analysis for the global burden of disease study 2019. Lancet Gastroenterol Hepatol. 2022;7(9):796–829. - PMC - PubMed

LinkOut - more resources