. 2025 May 22;44(1):154.
doi: 10.1186/s13046-025-03392-w.

AP1-mediated reprogramming of EGFR expression triggers resistance to BLU-667 and LOXO-292 in RET-rearranged tumors

Affiliations

AP1-mediated reprogramming of EGFR expression triggers resistance to BLU-667 and LOXO-292 in RET-rearranged tumors

Daniela Esposito et al. J Exp Clin Cancer Res. .

Abstract

Background: Non-small cell lung cancer (NSCLC) is a significant global health challenge, with 2% of cases fuelled by RET rearrangements. RET inhibitors (RETi) have revolutionized treatment for these patients, but resistance remains an important clinical challenge limiting therapy effectiveness. This study investigated the mechanisms underlying resistance to RETi.

Methods: NSCLC cells were exposed to increasing doses of RETi (pralsetinib/BLU-667 and selpercatinib/LOXO-292) to generate resistant cells. RNA-Sequencing analysis identified differentially expressed genes in resistant versus sensitive cells, followed by in vitro and in vivo functional assays to explore novel therapeutic strategies. Additionally, tumor biopsies from RET-rearranged NSCLC patients who exhibited cancer progression on RET inhibitor therapy were analyzed.

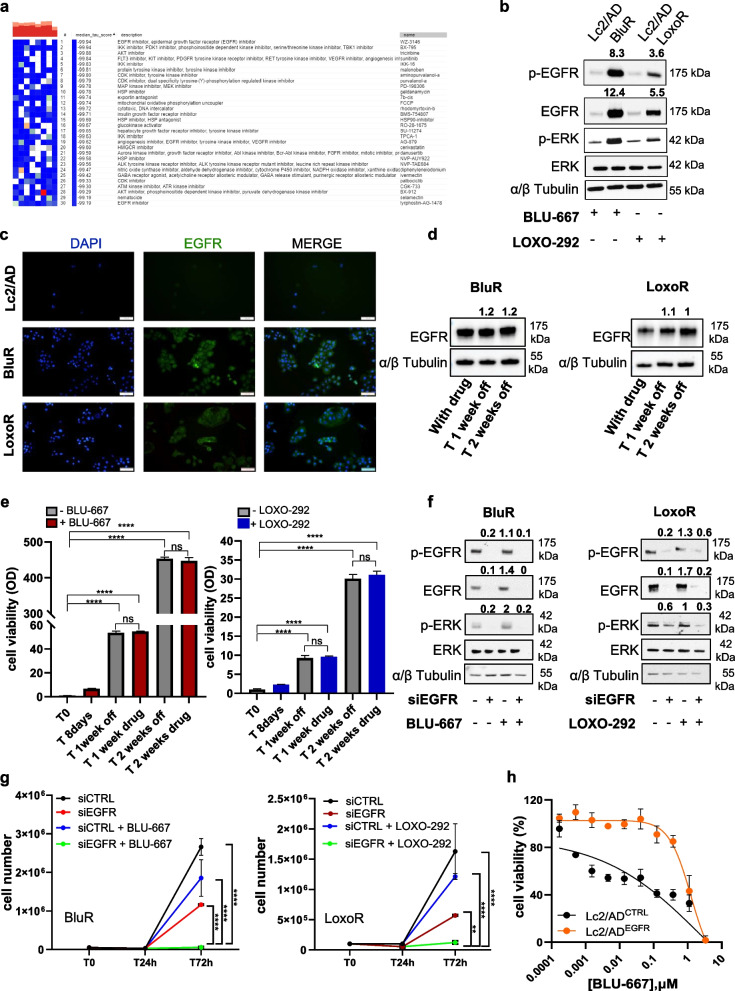
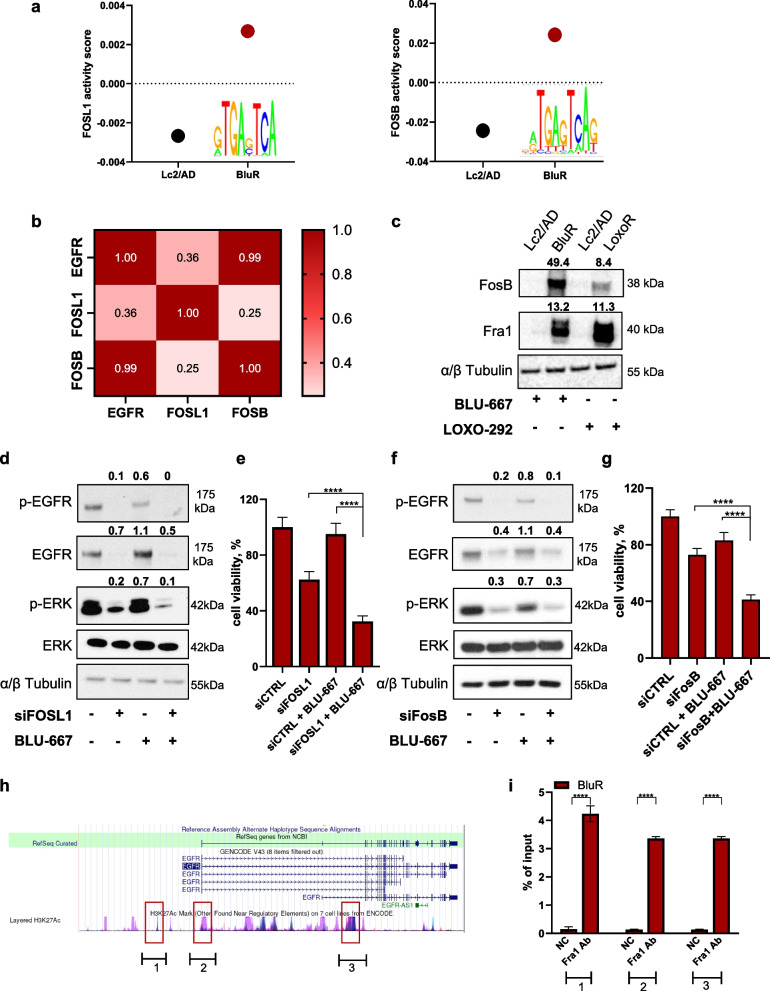
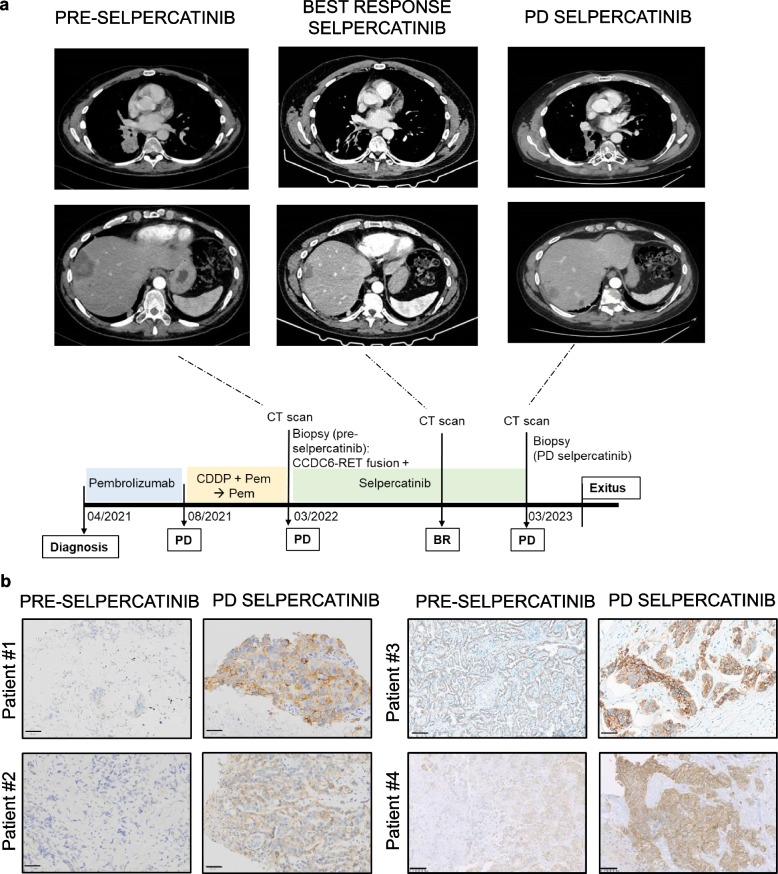
Results: RNA-sequencing analysis revealed the upregulation of the EGFR signaling pathway and hyperactivation of AP1 complex members in resistant cells compared to sensitive cells. Silencing of EGFR and AP1 complex members significantly reversed drug resistance, whereas EGFR overexpression reduced the sensitivity of parental Lc2/AD cells to RET inhibitors. Furthermore, the combination of RET and EGFR inhibitors showed synergistic antitumor activity in vitro and hindered tumor growth in mouse models with resistant cell xenografts. Notably, we observed a significant increase in EGFR expression in tumor biopsies from NSCLC patients treated with RET inhibitors who experienced disease progression, further validating the clinical relevance of our findings.

Conclusions: This study elucidates EGFR's role in mediating resistance to RET inhibitors in NSCLC patients. These findings offer insights into therapeutic adaptation and explore personalized combinations of RET and EGFR inhibitors for improved clinical outcomes.

Keywords: Combination targeted therapy; Drug resistance; EGFR; Non-small cell lung cancer; RET; RET inhibitors.


Conflict of interest statement

Declarations. Ethics approval and consent to participate: This study was reviewed and approved by the Federico II University Ethics Committee (ref n 139/22). Participants gave informed consent to participate in the study before taking part. The animal study was performed in accordance with institutional guidelines of the University of Naples Animal Care Committee and in accordance with the Declaration of Helsinki. Consent for publication: Not Applicable. Competing interests: Formisano declares the following competing interests: Consultant and advisory board for Seagen, Amgen, BMS, MSD, Jansen, and Pierre Fabre Pharma. Bianco declares the following competing interests: consultant and advisory board for BMS, MSD, Pfizer, AstraZeneca, Lilly and Novartis. Servetto reports honoraria from Eli Lilly, MSD, and Janssen and travel support from Bristol-Myers Squibb and AstraZeneca. Giuseppe Lo Russo declares advisory boards, consultancies, travel accommodations, speaker fees, writing fees, pi role in profit trials: MSD, Regeneron, Roche, Lilly, BMS, Amgen, AstraZeneca, Johnson And Johnson, Merck, Novartis, Pierre Fabre, Bayer, Beigene, Pfizer, Takeda, GSK, Daiichi,Sanofi, Gilead. Besse reports sponsored research at Gustave Roussy Cancer Center from AbbVie, Amgen, AstraZeneca, Biogen, Blueprint Medicines, Bristol-Myers Squibb, Celgene, Eli Lilly, GlaxoSmithKline, Ignyta, IPSEN, Merck KGaA, Merck Sharp & Dohme, Nektar, Onxeo, Pfizer, Pharma Mar, Sanofi, Spectrum Pharmaceuticals, Takeda, and Tiziana Pharma and investigators or coinvestigators of trials for Nerviano, GlaxoSmithKline, Pfizer, Roche-Genentech, Eli Lilly, OSE Pharma, Merck Sharp & Dohme, Celgene, Stemcentrx, Ignyta, AbbVie, Loxo Oncology, AstraZeneca, and Blueprint Medicines. Aldea reports receiving expenses and research funding from Sandoz and research funding from Amgen and AstraZeneca. Marinello declares travel/accommodation from Daiichi Sankyo and not financial support from MSD. The remaining authors declare that they have no competing interests.

Figures

Fig. 1
Fig. 1
CCDC6-RET NSCLC cells resistant to BLU-667 and LOXO-292. a Schematic representation illustrating the generation of BLU-667-resistant (BluR) and LOXO-292-resistant (LoxoR) Lc2/AD cells. b Left, images of crystal violet-stained monolayers of Lc2/AD, BluR, and LoxoR cells seeded in 6-well plates and treated with vehicle, BLU-667 (500 nM) or LOXO-292 (500 nM). Right, bar graph showing quantification by spectrophotometric detection of the integrated intensity values as % of vehicle-treated controls in Lc2/AD (black), BluR (red), and LoxoR (blue) cells (ns p > 0.05, ****p < 0.0001; 2way ANOVA Bonferroni’s multiple comparisons). c Twelve-point dose–response curves of parental Lc2/AD (black line) and BluR (red line), and Lc2/AD (black line) and LoxoR (blu line) cells treated with BLU-667 (left) or LOXO-292 (right). After 6 days of treatment, cells were lysed and quantified with ATP cell titer Glo. Each data point represents the percentage of cell viability relative to vehicle-treated controls. d Immunoblots of Lc2/AD parental and BluR cells treated with BLU-667 (500 nM). After treatment for 4 h, whole-cell lysates were prepared and subjected to immunoblot analyses with the indicated antibodies. Numbers above blots indicate FC variations compared to vehicle-treated Lc2/AD cells. Images are representatives from three independent experiments. e Heatmap showing unsupervised hierarchical clustering of differentially expressed genes (FDR < 0.01) in BluR versus Lc2/AD parental cells upon BLU-667 treatment for 24 h. Up- and down-regulated genes are represented in red and green, respectively. f Gene set enrichment analysis (GSEA) of significantly de-regulated pathways in BluR cells versus Lc2/AD cells shown with Normalized Enriched Score (NES) and FDR q-value. For all panels, data are expressed as mean ± standard deviation (SD) of three separate experiments, indicated by error bars
Fig. 2
Fig. 2
EGFR expression and activation regulates sensitivity to RET inhibitors. a. Connectivity map analysis to identify drugs that could potentially reverse the expression of resistance-associated genes. b Immunoblots of Lc2/AD parental, BluR and LoxoR cells treated with BLU-667 (500 nM) or LOXO-292 (500 nM). After treatment for 24 h, whole-cell lysates were prepared and subjected to immunoblot analyses with the indicated antibodies. Numbers above blots indicate FC variations compared to their counterpart Lc2/AD cells, treated with BLU-667 or LOXO-292. Images are representatives from three independent experiments. c Immunofluorescence staining of EGFR (Cy2) in Lc2/AD, BluR, and LoxoR cells. Nuclei were counterstained in blue (DAPI) (magnification 20 ×). d Immunoblots of BluR (left) and LoxoR (right) cells treated with BLU-667 (500 nM) or LOXO-292 (500 nM) for 8 days and then washed out for 1 and 2 weeks. Whole-cell lysates were prepared and subjected to immunoblot analyses with the indicated antibodies. Numbers above blots indicate FC variations compared to cells under treatment for 8 days. Images are representatives from three independent experiments. e Bar graph showing quantification by spectrophotometric detection of the integrated intensity values as % of T0, in BluR (left) and LoxoR (right). Cells were treated with the drugs for 1 week and then allowed to grow in media containing the respective drugs (BLU-667 in red and LOXO- 292 in blu) or without drugs (gray). (**p < 0.01; ****p < 0.0001; 2way ANOVA Bonferroni’s multiple comparisons). f Immunoblots of BluR (left) and LoxoR (right) cells knocked down for scramble or EGFR siRNAs and treated or not with BLU-667 and LOXO-292, respectively. After treatment for 72 h, whole-cell lysates were prepared and subjected to immunoblot analyses with the indicated antibodies. Numbers above blots indicate FC variations compared to cells transfected with scramble siRNAs. Images are representatives from three independent experiments. (**< 0.01; ****< 0.0001; 2way ANOVA Bonferroni's multiple comparison). g Line chart indicating cell number of BluR (left panel) and LoxoR (right panel) cells treated with scramble small interfering RNAs (siCTRL) or siRNAs targeting EGFR (siEGFR) in the presence or not of BLU-667 and LOXO-292, respectively. h Twelve-point dose–response curves of Lc2/AD over-expressing GFP control vector (pLenti-C-mGFP-P2 A-Puro; Lc2/ADCTRL, black line) or EGFR over-expressing cells (Lc2/ADEGFR, orange line) treated with BLU-667. After 6 days of treatment, cells were lysed and quantified with ATP cell titer Glo. Each data point represents the percentage of cell viability relative to vehicle-treated controls. For all panels, each point represents the mean ± SD from three independent experiments
Fig. 3
Fig. 3
The combination of RET and EGFR inhibitors impairs tumor growth in vitro and in vivo. a Images of crystal violet-stained monolayers of BluR and LoxoR cells seeded in 6-well plates and treated with vehicle, BLU-667 (500 nM) or LOXO-292 (500 nM) (RET i), afatinib (50 nM), and the combination (RET i + afatinib). b Bar graph showing quantification by spectrophotometric detection of the integrated intensity values as % of vehicle-treated controls in BluR (red) and LoxoR (blue) cells. (***p < 0.001; ****p < 0.0001; 2way ANOVA Bonferroni’s multiple comparisons). c Immunoblots of BluR (left) and LoxoR (right) cells treated with BLU-667 or LOXO-292 ± afatinib (left and right panels, respectively). Whole-cell lysates were prepared and subjected to immunoblot analysis with the indicated antibodies. Numbers above blots indicate FC variations compared to vehicle-treated cells. Images are representative of three independent experiments. d Viability assay to test the synergy between BLU-667 (left) or LOXO-292 (right) and afatinib in BluR and LoxoR cells, respectively. Cells were treated with increasing concentrations of each drug alone or with both drugs every 72 h until the vehicle-treated controls reached ~ 90% confluency. Cell monolayers were then lysed with ATP cell titer Glo reagent and the number of viable cells was determined based on the quantification of ATP, indicating metabolically active cells. Combination indices were determined using the Chou-Talalay test. Numbers inside each box indicate the ratio of viable cells to untreated cells from three independent experiments. e Line chart indicating the number of Lc2/AD cells treated with vehicle, BLU-667 (500 nM), LOXO-292 (500 nM), afatinib (50 nM), and their combinations for 30 days. (**p < 0.01, ***p < 0.001; 2way ANOVA Bonferroni’s multiple comparisons).Representative images of cells treated with BLU-667 ± afatinib and LOXO-292 ± afatinib for 30 days. f Immunoblots of Lc2/AD cells treated with BLU-667, LOXO-292, afatinib and the combination for 25 days. Whole-cell lysates were prepared and subjected to immunoblot analysis with the indicated antibodies. Numbers above blots indicate FC variations compared to vehicle-treated cells. Images are representative of three independent experiments. g BluR xenografts established in Balb/c mice. Once tumors reached ≥ 200 mm3, the mice were randomized to treatment with vehicle, BLU-667 (10 mg/kg b.i.d.), afatinib (20 mg/kg q.d.), or both drugs. The BluR tumor growth was monitored for 3 months. Each data point represents the mean tumor volume in cm3 ± SEM (n =5 mice per arm). i Whole-cell lysates were prepared from proteins extracted from BluR xenografts after four days of treatment and subjected to immunoblot analyses with the indicated antibodies. Numbers above blots indicate FC variations compared to vehicle-treated tumors. Images are representative of three independent experiments. For all panels, each point represents the mean ± SD from three independent experiments
Fig. 4
Fig. 4
AP1 complex members regulate EGFR expression in cells resistant to RET inhibitors. a Graph showing activity score of transcriptional factor FOSL1 (left) and FOSB (right) in Lc2/AD and BluR cells based on RNA-Sequencing data using Integrated System for Motif Activity Response Analysis (ISMARA). b Schematic representation of Pearson correlation for expression levels of EGFR, FOSL1 and FOSB genes, based on our RNA-Sequencing data. c Immunoblots of Lc2/AD and BluR cells treated with BLU-667 (500 nM) and Lc2/AD and LoxoR cells treated with LOXO-292 (500 nM) for 24 h. Whole-cell lysates were prepared and subjected to immunoblot analyses with the indicated antibodies. Numbers above blots indicate FC variations compared to their counterpart Lc2/AD cells, treated with BLU-667 or LOXO-292. Images are representatives from three independent experiments. d, f Immunoblots of BluR cells knocked down for scramble (siCTRL) or FOSL1 (siFOSL1; d) or FOSB (siFOSB; f) siRNAs and treated or not with BLU-667. After treatment for 72 h, whole-cell lysates were prepared and subjected to immunoblot analyses with the indicated antibodies. Numbers above blots indicate FC variations compared with cells transfected with scramble siRNAs. Images are representatives from three independent experiments. e, g Bar graph showing cell viability of BluR cells transfected with siRNAs against FOSL1 (e) and FOSB (g) and treated with BLU-667 (500 nM). Data are plotted as a percentage of vehicle-treated cells transfected with siRNAs scramble (siCTRL) (****< 0.0001; 2way ANOVA). h Schematic representation of the genomic locus encompassing EGFR gene. In the top part the exon/intron structure. In the bottom part, ENCODE tracks for H3K27Ac mapping across promoter and introns of EGFR are represented as coverage curves (peaks). i ChIP-qPCR with a Fra1 antibody or normal rabbit IgG (control), at the EGFR regulator regions. Enrichment values are expressed as percent (%) of input. (****< 0.0001; Student's t-test). For all panels, each point represents the mean ± SD from three independent experiments
Fig. 5
Fig. 5
Immunohistochemistry analysis reveals increased EGFR expression in disease-progression tumor biopsies. a Contrast-enhanced computed-tomography images of the thorax (upper) and abdomen (bottom) were acquired at baseline (on the left), showing a mass in the inferior lobe of the right lung, and a liver metastasis with central low attenuation (compatible with necrosis) and enhanced margins. These target lesions are shown at best response (central, best response) and at progression after selpercatinib treatment (right), where new liver lesions appeared (bottom panel showing the new lesion). CDDP = Cisplatin, cis-diamminedichloroplatinum; Pem = pemetrexed; PD = progression disease; BR = best response b Representative images of tissue sections subjected to IHC for EGFR. For patient #1, representative images of lung (pre-selpercatinib) and adrenal (Progression disease, PD selpercatinib) sections; for patient #2, representative images of brain metastasis (pre-selpercatinib) and liver (PD selpercatinib); for patient #3, representative images of liver (pre-selpercatinib and PD selpercatinib); for patient #4, representative images of liver (pre-selpercatinib) and pelvis (PD selpercatinib); Scale bar 50 µm

Similar articles

References

    1. Siegel RL, Miller KD, Wagle NS, Jemal A. Cancer statistics, 2023. CA Cancer J Clin. 2023;73:17–48. Available from: https://acsjournals.onlinelibrary.wiley.com/doi/10.3322/caac.21763. - DOI - PubMed
    1. Planchard D, Popat S, Kerr K, Novello S, Smit EF, Faivre-Finn C, et al. Metastatic non-small cell lung cancer: ESMO Clinical Practice Guidelines for diagnosis, treatment and follow-up. Ann Oncol. 2018;29:iv192–237. Available from: https://linkinghub.elsevier.com/retrieve/pii/S0923753419317107. - PubMed
    1. Comprehensive molecular profiling of lung adenocarcinoma. Nature. 2014;511:543–50. Available from: https://www.nature.com/articles/nature13385. - PMC - PubMed
    1. Servetto A, Esposito D, Ferrara R, Signorelli D, Belli S, Napolitano F, et al. RET rearrangements in non-small cell lung cancer: Evolving treatment landscape and future challenges. Biochim Biophys Acta - Rev Cancer. 2022;1877:188810. Available from: https://linkinghub.elsevier.com/retrieve/pii/S0304419X22001354. - PubMed
    1. Ju YS, Lee W-C, Shin JY, Lee S, Bleazard T, Won JK, et al. A transforming KIF5B and RET gene fusion in lung adenocarcinoma revealed from whole-genome and transcriptome sequencing. Genome Res. 2012;22:436–45. Available from: http://genome.cshlp.org/lookup/doi/10.1101/gr.133645.111. - DOI - PMC - PubMed

MeSH terms