. 2025 May 22;27(1):90.
doi: 10.1186/s13058-025-02029-2.

miRNA panel from HER2+ and CD24+ plasma extracellular vesicle subpopulations as biomarkers of early-stage breast cancer

Affiliations

miRNA panel from HER2+ and CD24+ plasma extracellular vesicle subpopulations as biomarkers of early-stage breast cancer

Griffin B Spychalski et al. Breast Cancer Res. .

Abstract

Background: Mammography screening has improved early breast cancer detection, leading to reduced mortality and lower rates of advanced breast cancer. However, mammography has a high false positive rate that results in over a million invasive breast biopsies of benign lesions in the US each year. Therefore, there is a need for noninvasive, blood-based diagnostics that can accurately assess risk of malignancy for women with indeterminate lesions identified by mammography, such as BI-RADS category 4 breast lesions. The aim of this study is to identify biomarkers from multiplexed extracellular vesicle liquid biopsy that can accurately classify mammographically detected BI-RADS 4 lesions.

Methods: We analyzed plasma from 113 prospectively enrolled subjects with BI-RADS 4 breast lesions, including 86 women with benign lesions and 27 women with malignant lesions (including 12 with stage I invasive carcinoma and 14 with ductal carcinoma in situ). None of the invasive carcinomas were metastatic. From each plasma sample, we used track etched magnetic nanopore technology to separately isolate HER2 and CD24 expressing extracellular vesicles (EVs) and measured their miRNA cargo using next-generation sequencing. We evaluated the performance of EV-miRNA biomarkers for classifying malignancy and applied LASSO classification to identify a panel of four complementary EV miRNA biomarkers that we validated by qPCR.

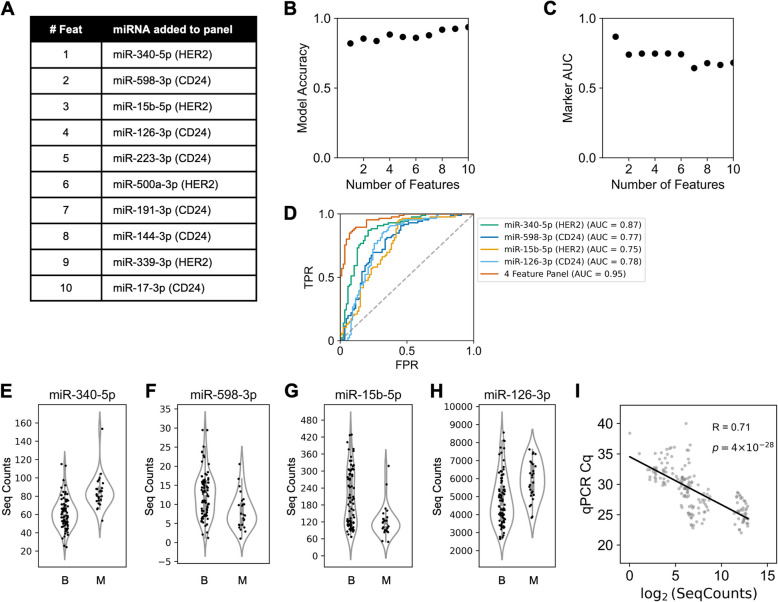
Results: We identified 19 differentially enriched miRNA from HER2+ EVs and 11 differentially enriched miRNA from CD24+ EVs of women with malignant lesions compared to benign lesions. We observed individual miRNA with an AUC of up to 0.87 for miR-340-5p from HER2+ EVs and 0.75 for miR-223-3p from CD24+ EVs. LASSO classification selected a panel of four complementary EV miRNA for classifying breast cancer: miR-340-5p (HER2+ EVs), miR-598-3p (CD24+), miR-15b-5p (HER2+), and miR-126-3p (CD24+).

Conclusions: HER2+ and CD24+ EV subpopulations contain complementary biomarkers suitable for validation in larger studies that can accurately detect early-stage breast cancer among women with BI-RADS category 4 breast lesions.

Keywords: BI-RADS 4 breast lesions; Early detection biomarkers; Extracellular vesicles; Liquid biopsy; MiRNA sequencing.


Conflict of interest statement

Declarations. Ethics approval and consent to participate: All participants included in this study signed informed consent at the Hospital of the University of Pennsylvania (Philadelphia, PA) under IRB Protocol #833588. Consent for publication: Not applicable. Competing interests: DI holds ownership interest, including patents, in Chip Diagnostics. The other authors declare no competing interests.

Figures

Fig. 1
Fig. 1
Combining miRNA biomarkers from HER2+ and CD24+ EV subpopulations for diagnosis of early-stage breast cancer. A The study population consists of 113 women with BI-RADS category 4 breast lesions, including 27 women with malignant breast lesions and 86 women with benign breast lesions. We immunomagnetically label EVs targeting HER2 or CD24 and then isolate the EV subpopulations using TENPO devices. By sequencing the EVs’ miRNA cargo, we identify biomarkers to accurately classify malignancy. B The TENPO device. C Scanning electron micrograph of HER2+ EVs isolated on TENPO surface. D CD24+ EVs isolated on TENPO surface. Scale bars are 3 μm
Fig. 2
Fig. 2
Identification of HER2+ and CD24+ EV-miRNA biomarkers. A Heatmap shows Z-score of differentially enriched miRNA biomarkers from HER2+ or CD24+ EVs isolated from each of the benign (n = 86) and malignant (n = 27) plasma samples (FDR-corrected Wald test p < 0.05). B Volcano plot of miRNA from HER2+ EVs. C Volcano plot of miRNA from CD24+ EVs. D Area under the receiver-operator characteristic curve (AUC) for the classification of malignancy by HER2+ EV-miRNA. E AUC for the classification of malignancy by CD24+ EV-miRNA (* denotes FDR-corrected Mann-Whitney U-test p < 0.05). Error bars represent the 95% confidence interval generated using DeLong’s method
Fig. 3
Fig. 3
Comparison of EV-miRNA biomarkers from HER2+ and CD24+ EV subpopulations. A AUC of differentially enriched EV-miRNA from HER2+ EVs compared to those from CD24+ EVs. B Venn diagram of shared and distinct miRNA biomarkers from HER2+ EVs and CD24+ EVs; area is scaled to size of each group. C Correlogram of Kendall tau correlation coefficient between differentially enriched EV-miRNA. D Relative frequency histogram of Kendall tau correlation coefficient between HER2+ EV miRNAs compared to HER2+ EV miRNAs. E Relative frequency histogram of Kendall tau correlation coefficient between CD24+ EV miRNAs compared to CD24+ EV miRNAs. F Relative frequency histogram of Kendall tau correlation coefficient between HER2+ EV miRNAs compared to CD24+ EV miRNAs. G Enriched pathways associated with differentially enriched HER2+ EV-miRNAs identified by KEGG pathway analysis (FDR-corrected Fisher’s exact test p). H Enriched pathways associated with differentially enriched CD24+ EV-miRNAs identified by KEGG pathway analysis
Fig. 4
Fig. 4
Selection of EV-miRNA biomarker panel. A Features selected by LASSO algorithm from either HER2+ or CD24+ EVs, noted in parentheses. As the hyperparameter regulating the cost function is reduced, the panel is expanded to include more features. B Learning curve plotting the accuracy of classifying malignancy for an ensemble machine learning algorithm trained using an incremental panel of LASSO-selected features. C AUC of individual markers selected by LASSO. D AUC ROC curve of true positive rate (TPR) against false positive rate (FPR) for individual miRNA and combined panel. E-H Sequencing counts of LASSO-selected features for benign (B) and malignant (M) samples. I Correlation of sequencing counts and qPCR values. R denotes Pearson’s R correlation coefficient (two-sided Student’s t-test p-value)

References

    1. Siegel RL, Miller KD, Wagle NS, Jemal A. Cancer statistics, 2023. CA: A Cancer Journal for Clinicians. 2023;73(1):17-48. - PubMed
    1. Duffy SW, Tabár L, Yen AMF, Dean PB, Smith RA, Jonsson H, et al. Mammography screening reduces rates of advanced and fatal breast cancers: Results in 549,091 women. Cancer. 2020;126(13):2971–9. - PMC - PubMed
    1. D'Orsi C, Sickles E, Mendelson E, Morris E. American College of Radiology Breast Imaging Reporting and Data System BI-RADS. Reston, VA2013.
    1. Hubbard RA, Kerlikowske K, Flowers CI, Yankaskas BC, Zhu W, Miglioretti DL. Cumulative Probability of False-Positive Recall or Biopsy Recommendation After 10 Years of Screening Mammography: A Cohort Study. Annals of Internal Medicine. 2011;155(8):481–92. - PMC - PubMed
    1. Revenfeld ALS, Bæk R, Nielsen MH, Stensballe A, Varming K, Jørgensen M. Diagnostic and Prognostic Potential of Extracellular Vesicles in Peripheral Blood. Clinical Therapeutics. 2014;36(6):830–46. - PubMed

MeSH terms