Meta-Analysis
. 2025 Dec;22(1):2507949.
doi: 10.1080/15502783.2025.2507949. Epub 2025 May 22.

Comparison of concurrent, resistance, or aerobic training on body fat loss: a systematic review and meta-analysis

Affiliations
Meta-Analysis

Comparison of concurrent, resistance, or aerobic training on body fat loss: a systematic review and meta-analysis

Kworweinski Lafontant et al. J Int Soc Sports Nutr. 2025 Dec.

Abstract

Background: This systematic review and meta-analysis compared the differential effects of resistance training (RT), aerobic training (AT), and concurrent training (CT) on body mass and body fat loss in metabolically healthy individuals.

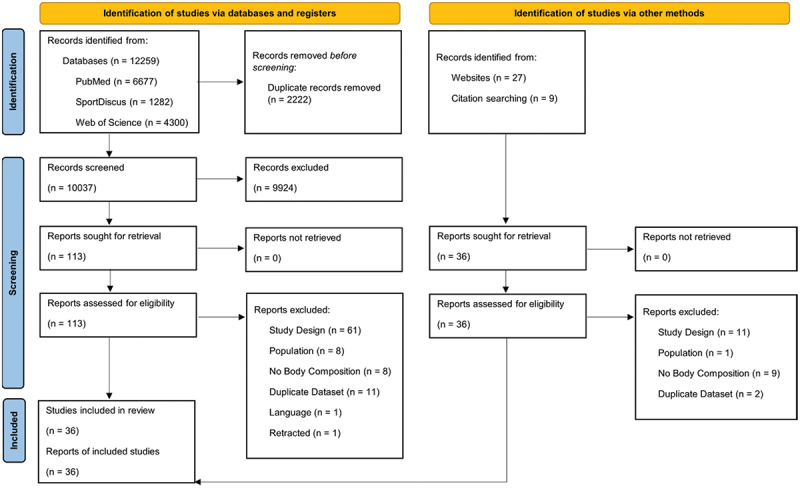
Methods: A systematic search of PubMed, SportDiscus, and Web of Science databases for randomized controlled trials published between January 1980 and January 2023, comparing RT, AT, and CT in healthy adults was conducted. Primary outcomes of interest included changes in fat mass and body fat percentage; secondary outcomes were body mass and fat-free mass (FFM). Sub-analyses on intervention duration (< or ≥ 10 weeks), CT timing (aerobic and resistance exercises done on the same day versus different days within a week), and workload matching (equating workloads between AT, RT, and CT), were conducted. Study protocols followed PRISMA 2020 guidelines and were pre-registered on PROSPERO (CRD42023396530).

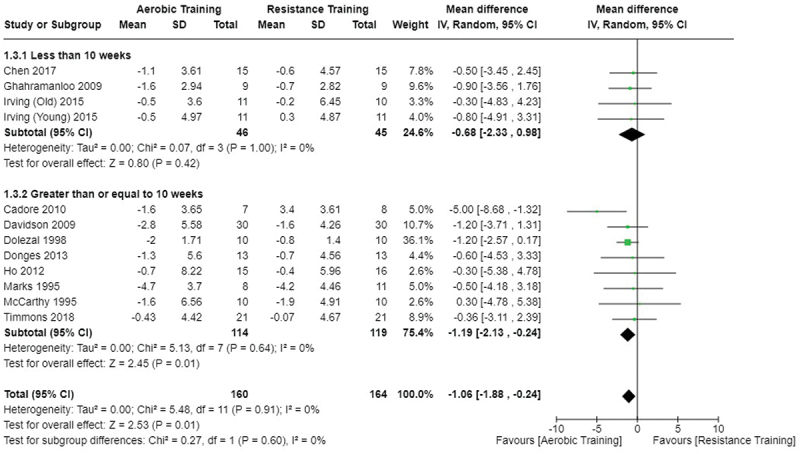
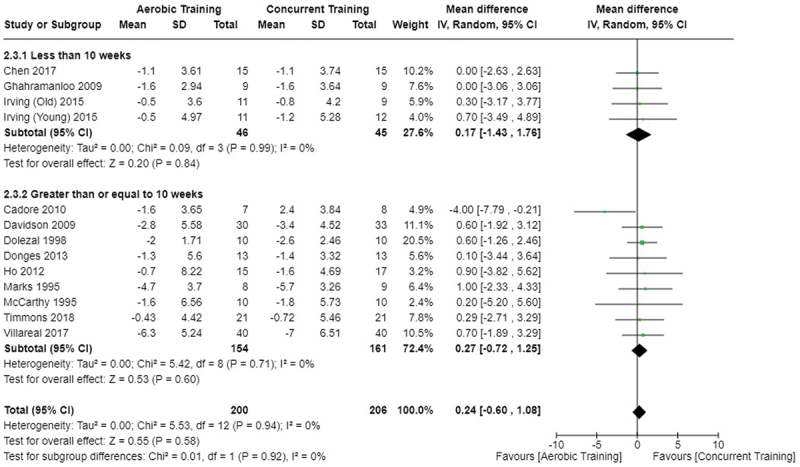
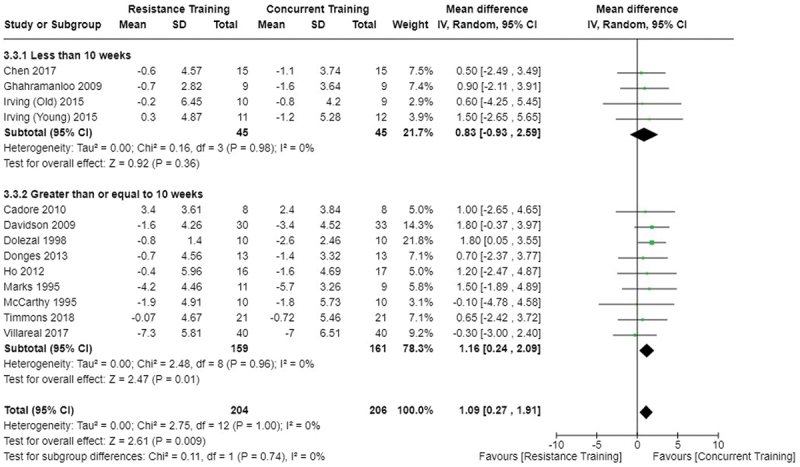
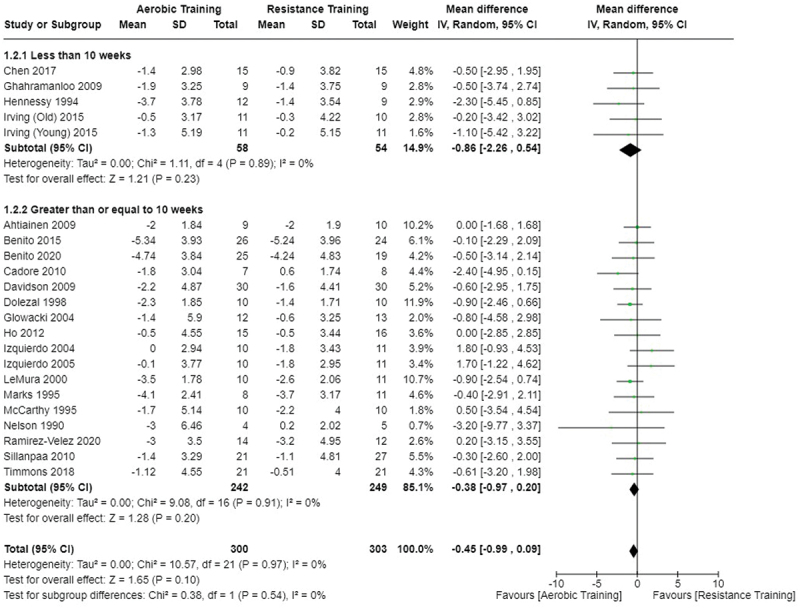
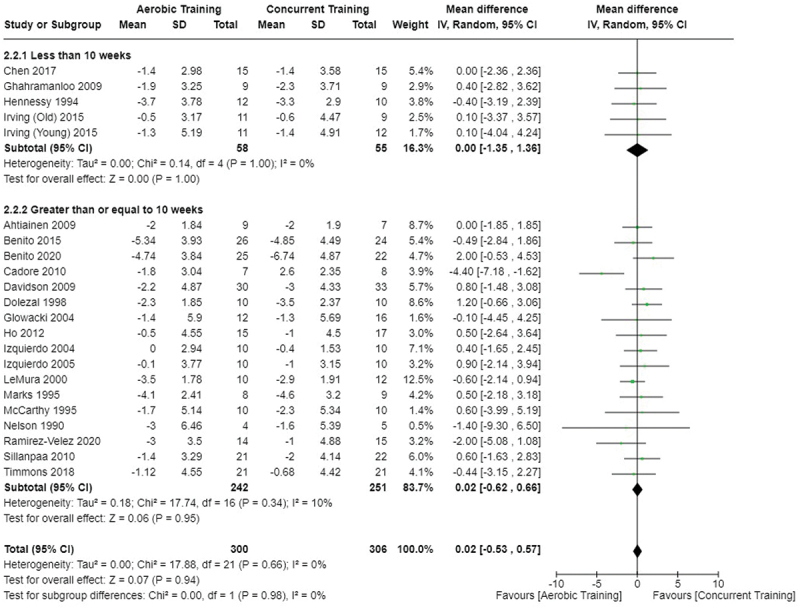
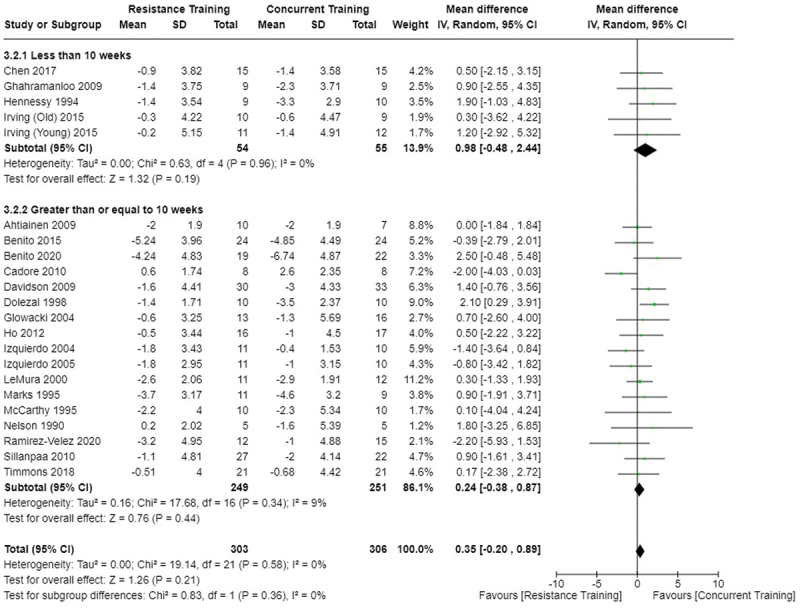
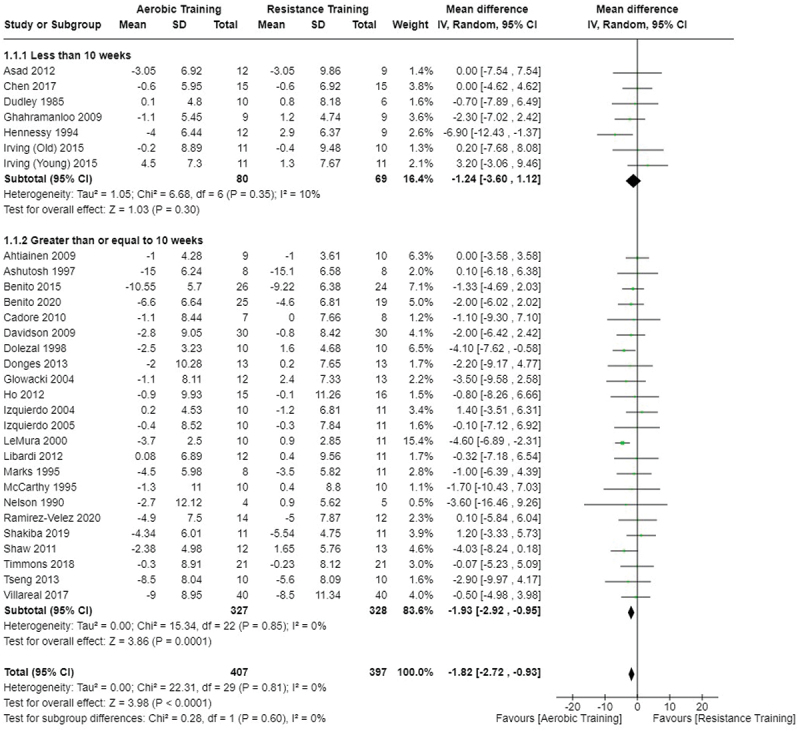
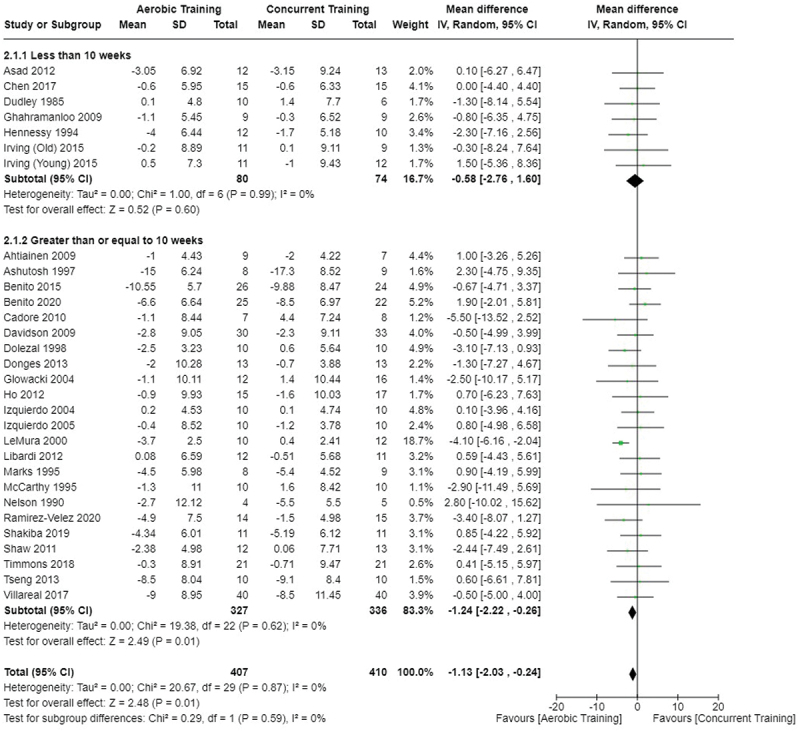
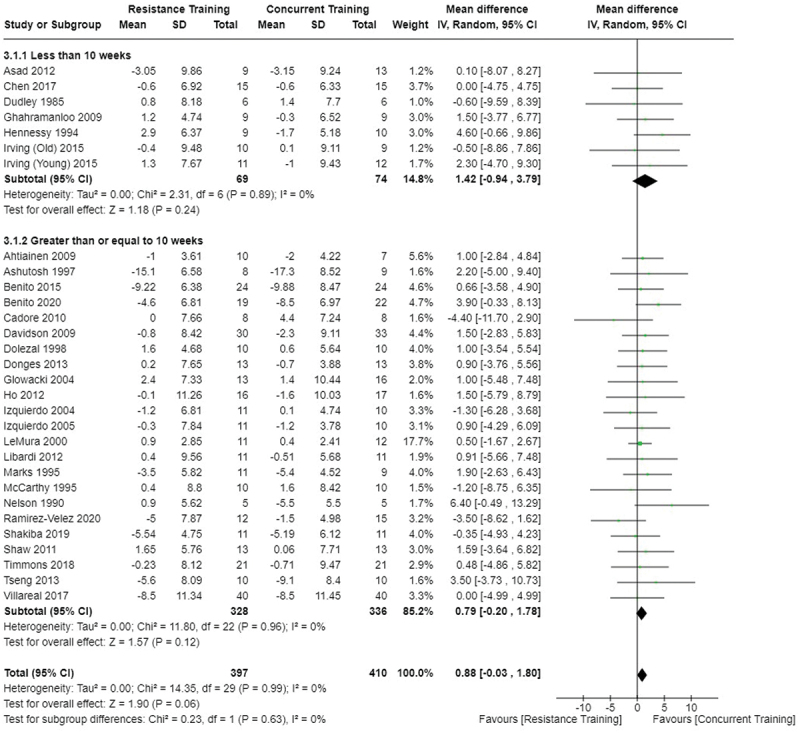
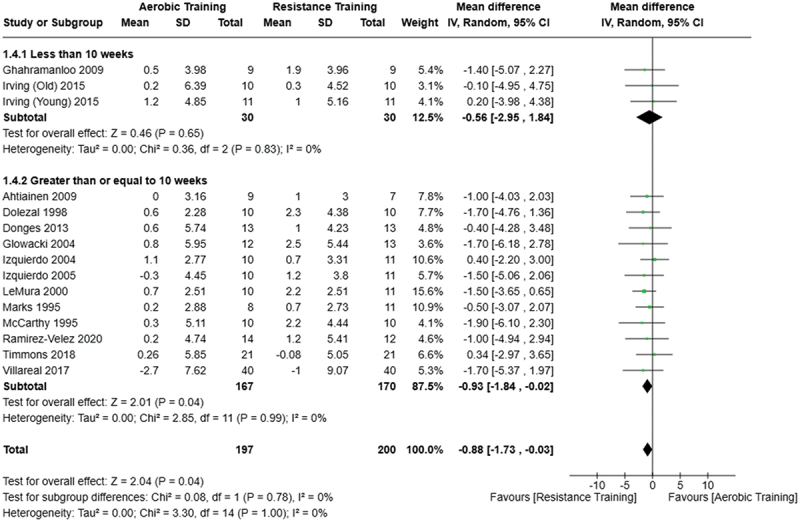
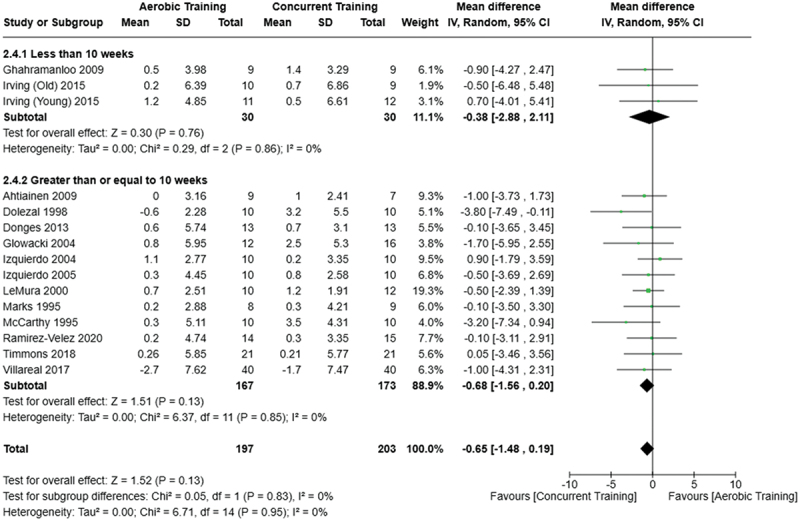
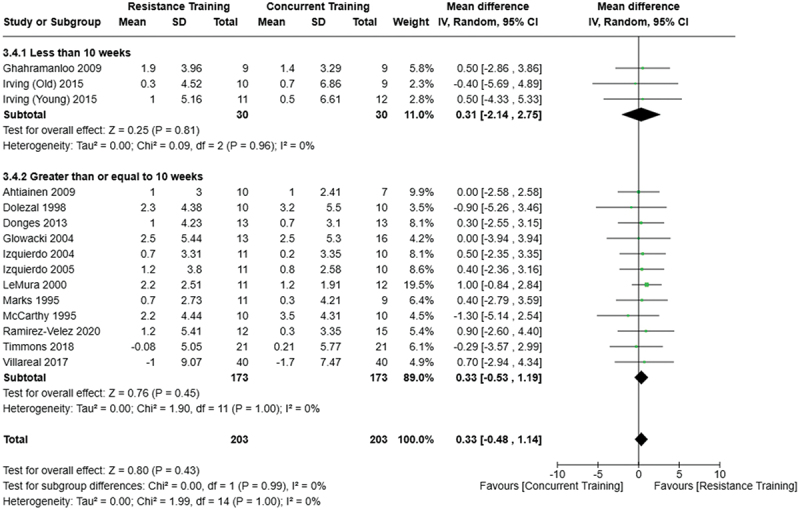
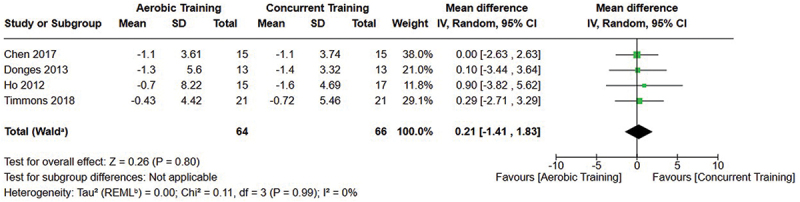
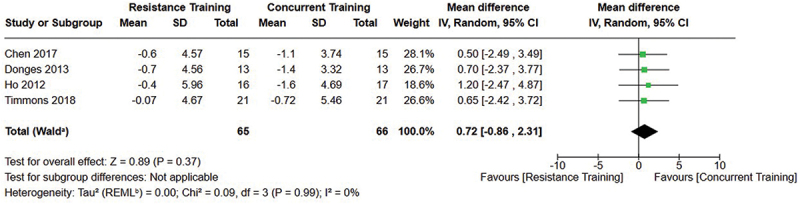
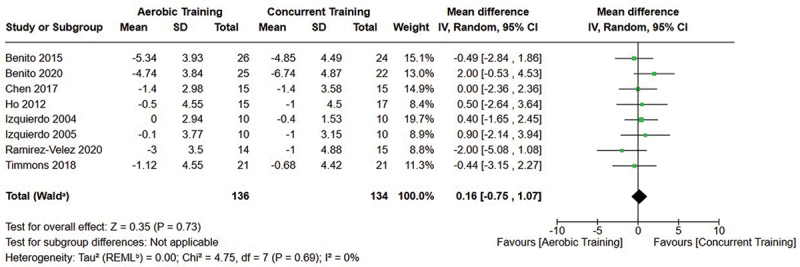
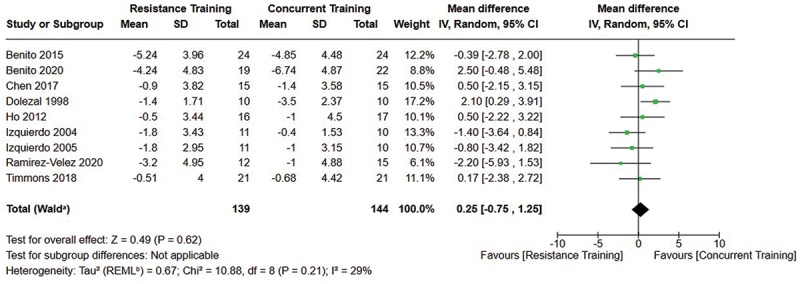
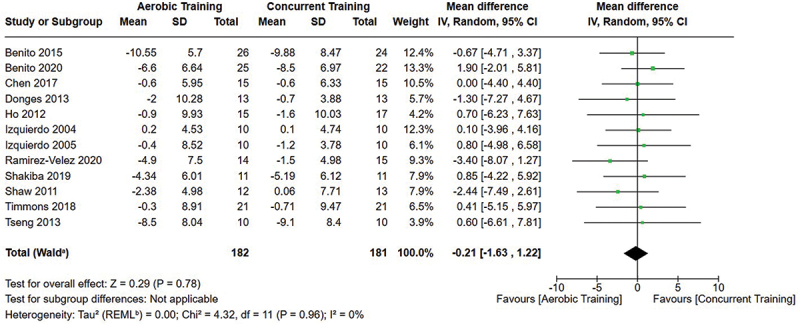
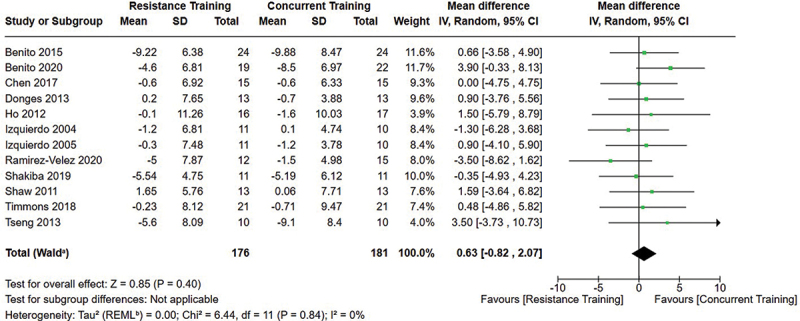
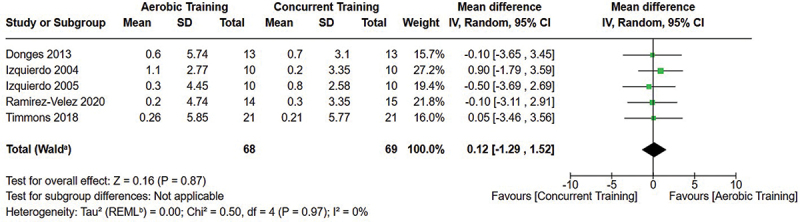
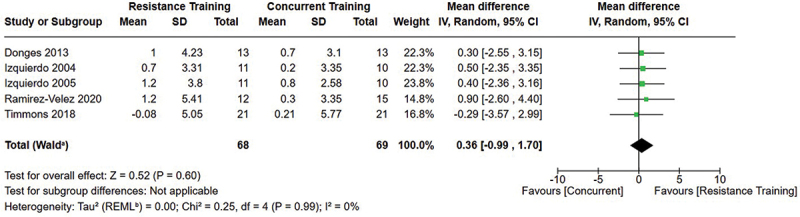
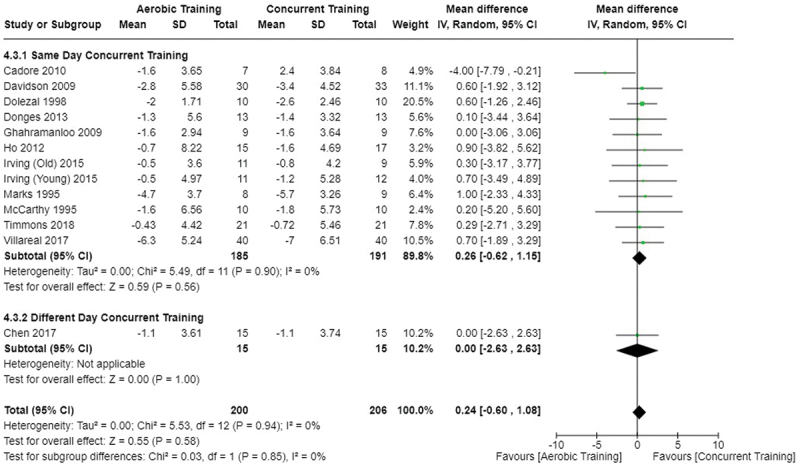
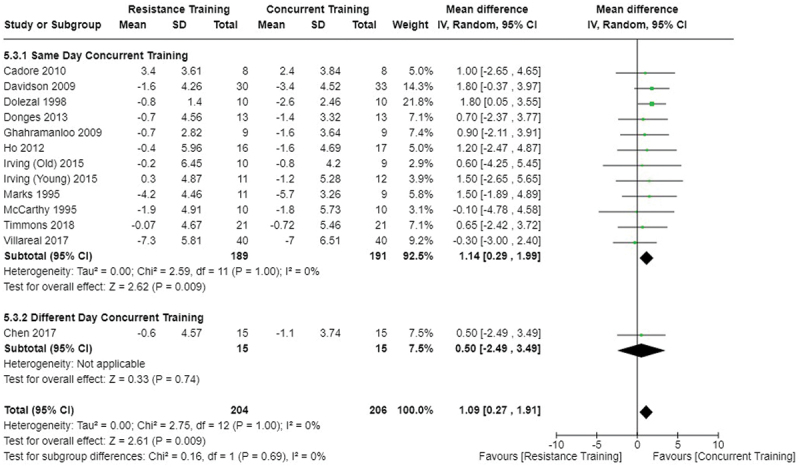
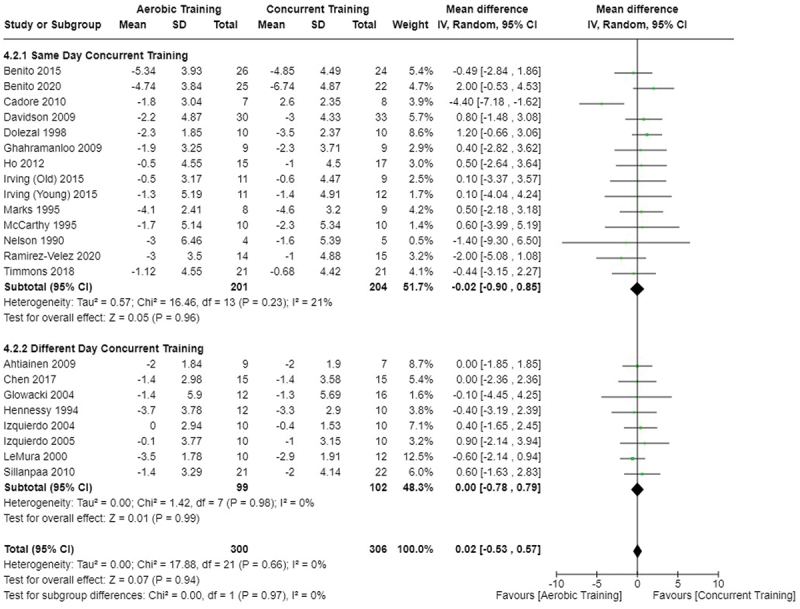
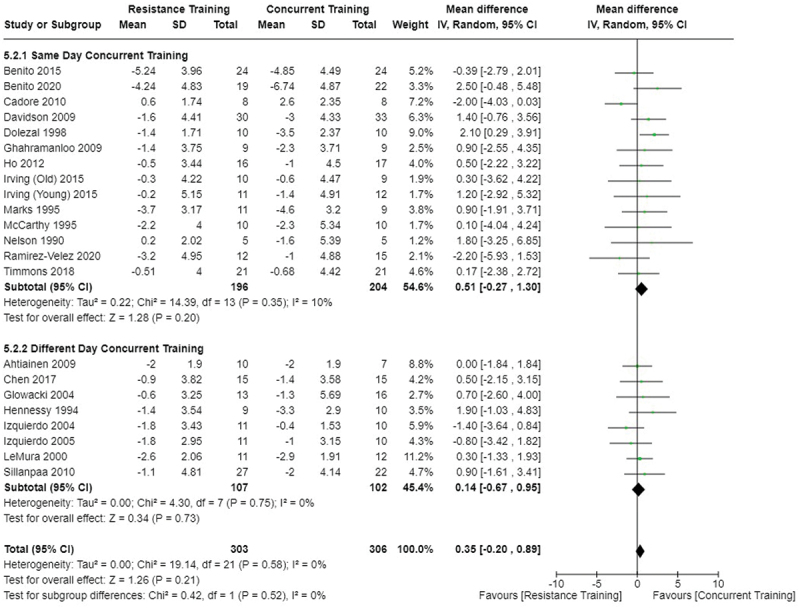
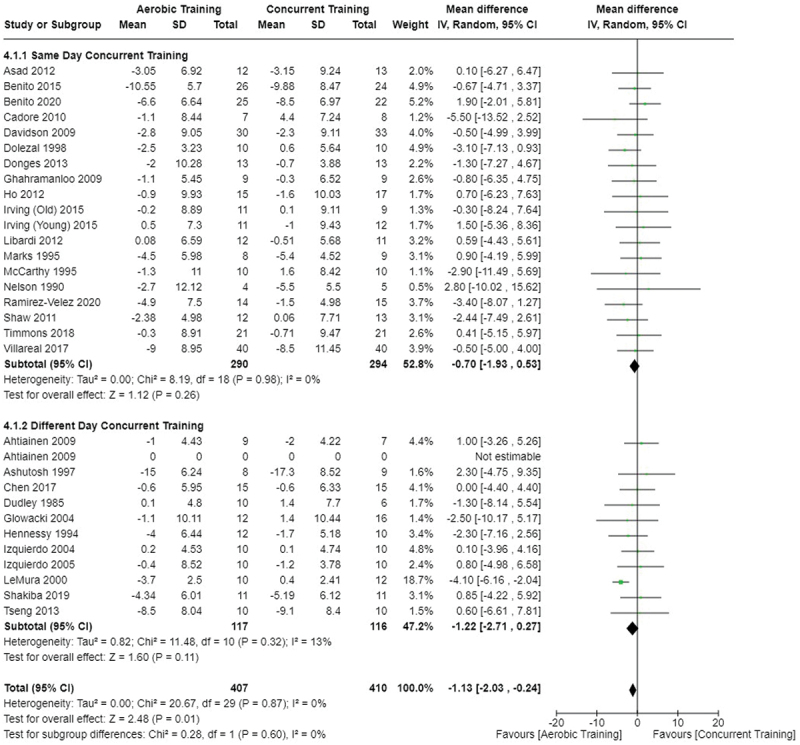
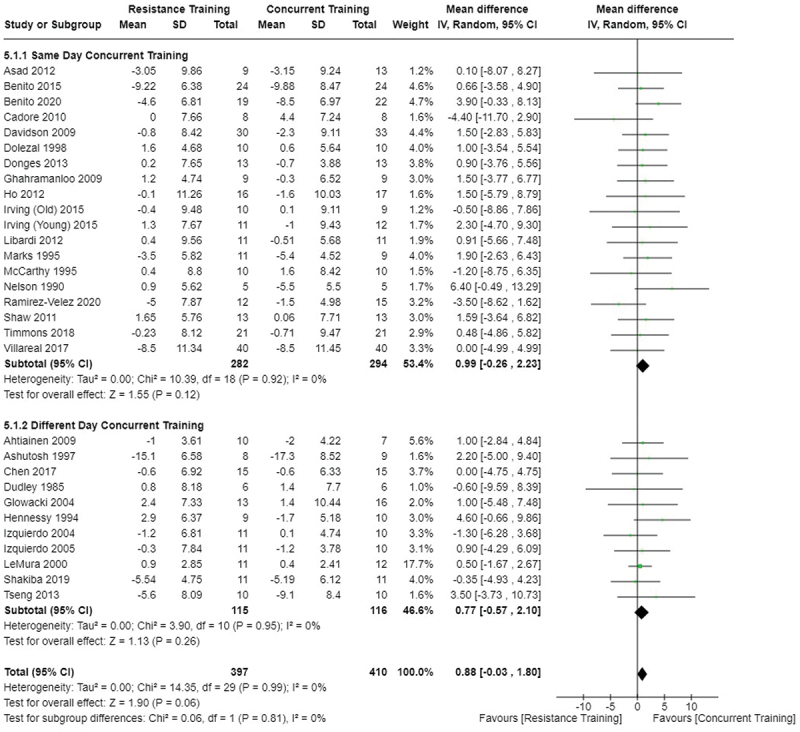
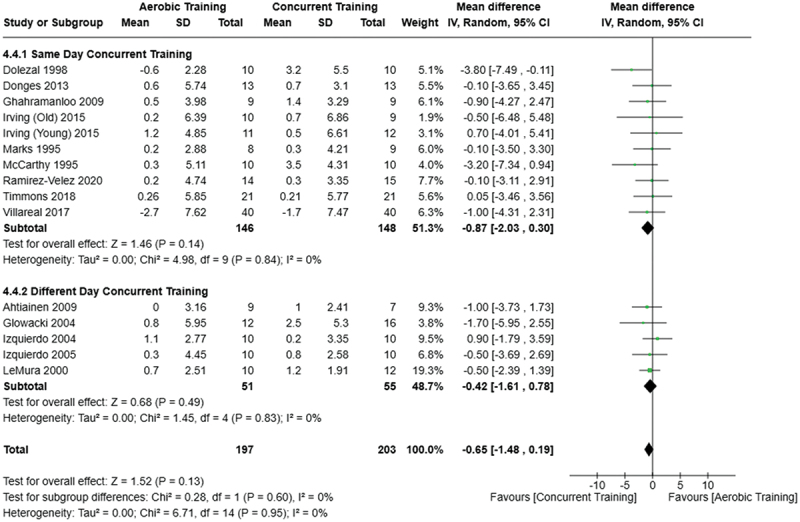
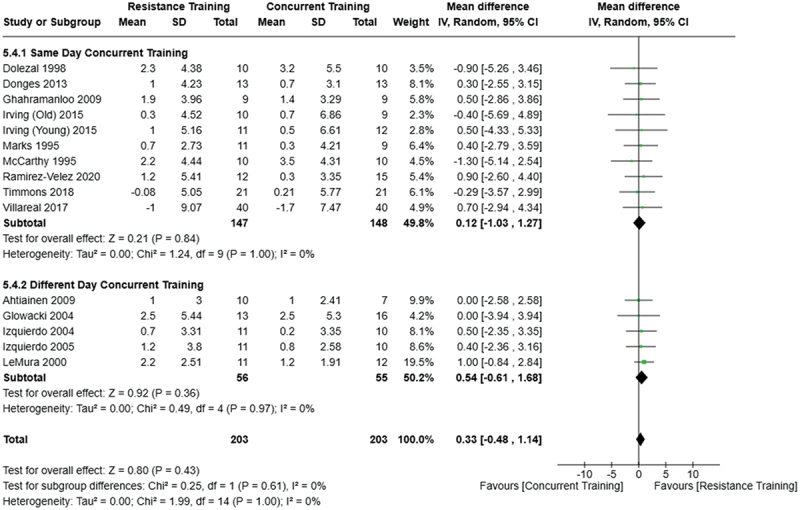
Results: In total, 36 studies with 1564 participants were included in the systematic review, with only 31 studies included in the meta-analysis due to missing data. For studies lasting at least 10 weeks, AT outperformed RT in reducing body mass (mean difference (MD) = -1.82 kg [95% CI = -2.72 to -0.93]; p < 0.001) and fat mass (MD = -1.06 kg [95% CI = -1.88 to -0.24]; p = 0.01) but led to less FFM retention (MD = - 0.88 kg [95% CI = -1.73 to -0.03], p = 0.04). CT reduced significantly more fat mass compared to RT (MD: -1.09 kg [95% CI = -0.27 to -1.91]; p = 0.009). No significant differences were found between CT, AT, and RT in altering body fat percentage (p > 0.05). For studies shorter than 10 weeks, no significant differences were noted across exercise modalities (p > 0.05). Under conditions where AT, RT, and CT workloads were matched, similar fat mass, body mass, body fat percentage, and FFM changes were observed between exercise modalities (p > 0.05). Similar body mass and body fat percentage loss was observed between same-day and different-day CT (p > 0.05); body fat mass loss only differed in a single study (n = 1) when comparing RT to different-day CT (aerobic and resistance exercises done on different days within a week).

Conclusions: While there are no differences in percent body fat loss between exercise modes, AT and CT are more effective than RT alone in reducing absolute fat mass; however, RT neither improved nor impeded fat mass loss when incorporated into CT. Combining aerobic and resistance exercises on the same-day or different-day does not appear to influence the effectiveness of CT. When exercise interventions are short in duration (<10 weeks), there does not appear to be a difference in fat loss between exercise modalities. These results support the concurrent use of aerobic and resistance exercises for fat mass reduction, as well as an emphasis on workload and duration when programming exercise for fat loss.

Keywords: Interference effect; body composition; bodyfat; exercise selection; lean body mass.


Conflict of interest statement

No potential conflict of interest was reported by the author(s).

Figures

Figure 1.
Figure 1.
PRISMA flowchart of search results and screening [9].
Figure 2.
Figure 2.
Comparison of aerobic and resistance training for fat mass loss. Means, standard deviations (SD), and 95% confidence intervals (CI) are presented in kg.
Figure 3.
Figure 3.
Comparison of aerobic and concurrent training for fat mass loss. Means, standard deviations (SD), and 95% confidence intervals (CI) are presented in kg.
Figure 4.
Figure 4.
Comparison of resistance and concurrent training for fat mass loss. Means, standard deviations (SD), and 95% confidence intervals (CI) are presented in kg.
Figure 5.
Figure 5.
Comparison of aerobic and resistance training for body fat percentage loss. Means, standard deviations (SD), and 95% confidence intervals (CI) are presented in kg.
Figure 6.
Figure 6.
Comparison of aerobic and concurrent training for body fat percentage loss. Means, standard deviations (SD), and 95% confidence intervals (CI) are presented in kg.
Figure 7.
Figure 7.
Comparison of resistance and concurrent training for body fat percentage loss. Means, standard deviations (SD), and 95% confidence intervals (CI) are presented in kg.
Figure 8.
Figure 8.
Comparison of aerobic and resistance training for body mass loss. Means, standard deviations (SD), and 95% confidence intervals (CI) are presented in kg.
Figure 9.
Figure 9.
Comparison of aerobic and concurrent training for body mass loss. Means, standard deviations (SD), and 95% confidence intervals (CI) are presented in kg.
Figure 10.
Figure 10.
Comparison of resistance and concurrent training for body mass loss. Means, standard deviations (SD), and 95% confidence intervals (CI) are presented in kg.
Figure 11.
Figure 11.
Comparison of aerobic and resistance training for fat-free mass changes. Means, standard deviations (SD), and 95% confidence intervals (CI) are presented in kg.
Figure 12.
Figure 12.
Comparison of aerobic and concurrent training for fat-free mass changes. Means, standard deviations (SD), and 95% confidence intervals (CI) are presented in kg.
Figure 13.
Figure 13.
Comparison of resistance and concurrent training for fat-free mass changes. Means, standard deviations (SD), and 95% confidence intervals (CI) are presented in kg.
Figure 14.
Figure 14.
Comparison of aerobic and work-matched concurrent training for fat mass loss. Means, standard deviations (SD), and 95% confidence intervals (CI) are presented in kg.
Figure 15.
Figure 15.
Comparison of resistance and work-matched concurrent training for fat mass loss. Means, standard deviations (SD), and 95% confidence intervals (CI) are presented in kg.
Figure 16.
Figure 16.
Comparison of aerobic and work-matched concurrent training for body fat percentage loss. Means, standard deviations (SD), and 95% confidence intervals (CI) are presented in %.
Figure 17.
Figure 17.
Comparison of resistance and work-matched concurrent training for body fat percentage loss. Means, standard deviations (SD), and 95% confidence intervals (CI) are presented in %.
Figure 18.
Figure 18.
Comparison of aerobic and work-matched concurrent training for body mass loss. Means, standard deviations (SD), and 95% confidence intervals (CI) are presented in kg.
Figure 19.
Figure 19.
Comparison of resistance and work-matched concurrent training for body mass loss. Means, standard deviations (SD), and 95% confidence intervals (CI) are presented in kg.
Figure 20.
Figure 20.
Comparison of aerobic and work-matched concurrent training for fat-free mass changes. Means, standard deviations (SD), and 95% confidence intervals (CI) are presented in kg.
Figure 21.
Figure 21.
Comparison of resistance and work-matched concurrent training for fat-free mass changes. Means, standard deviations (SD), and 95% confidence intervals (CI) are presented in kg.
Figure 22.
Figure 22.
Comparison of aerobic and same/different day concurrent training for fat mass loss. Means, standard deviations (SD), and 95% confidence intervals (CI) are presented in kg.
Figure 23.
Figure 23.
Comparison of resistance and same/different day concurrent training for fat mass loss. Means, standard deviations (SD), and 95% confidence intervals (CI) are presented in kg.
Figure 24.
Figure 24.
Comparison of aerobic and same/different day concurrent training for body fat percentage loss. Means, standard deviations (SD), and 95% confidence intervals (CI) are presented in %.
Figure 25.
Figure 25.
Comparison of resistance and same/different day concurrent training for body fat percentage loss. Means, standard deviations (SD), and 95% confidence intervals (CI) are presented in %.
Figure 26.
Figure 26.
Comparison of aerobic and same/different day concurrent training for body mass loss. Means, standard deviations (SD), and 95% confidence intervals (CI) are presented in kg.
Figure 27.
Figure 27.
Comparison of resistance and same/different day concurrent training for body mass loss. Means, standard deviations (SD), and 95% confidence intervals (CI) are presented in kg.
Figure 28.
Figure 28.
Comparison of aerobic and same/different day concurrent training for fat-free mass changes. Means, standard deviations (SD), and 95% confidence intervals (CI) are presented in kg.
Figure 29.
Figure 29.
Comparison of resistance and same/different day concurrent training for fat-free mass changes. Means, standard deviations (SD), and 95% confidence intervals (CI) are presented in kg.

References

    1. Donnelly JE, Blair SN, Jakicic JM, et al. American college of sports medicine position stand. Appropriate physical activity intervention strategies for weight loss and prevention of weight regain for adults. Med Sci Sports Exerc. 2009. Feb;41(2):459–31. doi: 10.1249/MSS.0b013e3181949333 - DOI - PubMed
    1. Lundberg TR, Feuerbacher JF, Sunkeler M, et al. The effects of concurrent aerobic and strength training on muscle fiber hypertrophy: a systematic review and meta-analysis. Sports Med. 2022. Oct;52(10):2391–2403. doi: 10.1007/s40279-022-01688-x - DOI - PMC - PubMed
    1. Schumann M, Feuerbacher JF, Sunkeler M, et al. Compatibility of concurrent aerobic and strength training for skeletal muscle size and function: an updated systematic review and meta-analysis. Sports Med. 2022. Mar;52(3):601–612. doi: 10.1007/s40279-021-01587-7 - DOI - PMC - PubMed
    1. Liguori G. American college of sports medicine. ACSM’s guidelines for exercise testing and prescription. 11th ed. Philadelphia: Lippincott Williams & Wilkins; 2021.
    1. Petre H, Hemmingsson E, Rosdahl H, et al. Development of maximal dynamic strength during concurrent resistance and endurance training in untrained, moderately trained, and trained individuals: a systematic review and meta-analysis. Sports Med. 2021. May;51(5):991–1010. doi: 10.1007/s40279-021-01426-9 - DOI - PMC - PubMed