Dynamics and immunological signature of γδ T cells following antiretroviral therapy initiation in acute HIV-1 Infection
- PMID: 40406103
- PMCID: PMC12095004
- DOI: 10.3389/fimmu.2025.1554916
Dynamics and immunological signature of γδ T cells following antiretroviral therapy initiation in acute HIV-1 Infection
Abstract
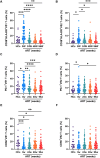
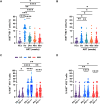
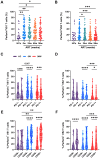
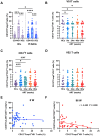
Early antiretroviral therapy (ART) is essential for controlling HIV-1 replication and boosting immune function. γδ T cells, as a vital component of the innate immune system, are implicated in the antiviral response. However, their immunological profile during acute HIV-1 infection and the early stages of ART remains unclear. This study aimed to delineate the immunological landscape of γδ T cells in individuals with acute HIV-1 infection undergoing early ART. We enrolled 65 participants who initiated ART immediately post-diagnosis and assessed the phenotypes and functions of γδ T cells using flow cytometry. We demonstrated that early ART significantly increased the frequency of Vδ2 T cells, while the Vδ1 T cell frequency remained stable and showed an inverse relationship with CD4+ T cell counts after ART. Early ART normalized the activation and PD-1 expression in Vδ1 and Vδ2 T cells, aligning with healthy controls (HCs) levels. Nevertheless, the proliferation of these cells, particularly within the PD-1+ subset, remains elevated post-ART. We also noted a reduction in perforin secretion in PD-1+ Vδ1 and Vδ2 T cells of people living with HIV (PLWH). Furthermore, Vδ1 T cells were identified as the predominant regulatory T cells, with TGF-β production and co-expression of CD127 and CXCR4, negatively correlated with CD8+ T cell activation. Our study elucidates the dynamic immunological characteristics of γδ T cells in acute HIV-1 infection and early ART, contributing to the understanding of their role in HIV-1 pathogenesis and the potential for γδ T cell-based immunotherapeutic strategies.
Keywords: antiretroviral therapy (ART); early/acute HIV-1 infection; immune activation; regulatory T cells; γδ T cells.
Copyright © 2025 Wang, Li, Wang, Wang, Zhang, Lu, Sun, Zhang, Huang, Su, Wu and Li.
Conflict of interest statement
The authors declare that the research was conducted in the absence of any commercial or financial relationships that could be construed as a potential conflict of interest.
Figures


Similar articles
-
Vδ1 Effector and Vδ2 γδ T-Cell Subsets Shift in Frequency and Are Linked to Plasma Inflammatory Markers During Antiretroviral Therapy-Suppressed HIV Infection.J Infect Dis. 2024 May 15;229(5):1317-1327. doi: 10.1093/infdis/jiae091. J Infect Dis. 2024. PMID: 38390982 Free PMC article.
-
Association between peripheral γδ T-cell profile and disease progression in individuals infected with HIV-1 or HIV-2 in West Africa.J Acquir Immune Defic Syndr. 2011 Jun 1;57(2):92-100. doi: 10.1097/QAI.0b013e318215a877. J Acquir Immune Defic Syndr. 2011. PMID: 21423026 Free PMC article.
-
In Human Immunodeficiency Virus primary infection, early combined antiretroviral therapy reduced γδ T-cell activation but failed to restore their polyfunctionality.Immunology. 2019 Aug;157(4):322-330. doi: 10.1111/imm.13089. Epub 2019 Jul 8. Immunology. 2019. PMID: 31206171 Free PMC article. Clinical Trial.
-
The Unknown Unknowns: Recovering Gamma-Delta T Cells for Control of Human Immunodeficiency Virus (HIV).Viruses. 2020 Dec 17;12(12):1455. doi: 10.3390/v12121455. Viruses. 2020. PMID: 33348583 Free PMC article. Review.
-
Human Peripheral Blood Gamma Delta T Cells: Report on a Series of Healthy Caucasian Portuguese Adults and Comprehensive Review of the Literature.Cells. 2020 Mar 16;9(3):729. doi: 10.3390/cells9030729. Cells. 2020. PMID: 32188103 Free PMC article. Review.
References
-
- Hellmuth J, Slike BM, Sacdalan C, Best J, Kroon E, Phanuphak N, et al. . Very early initiation of antiretroviral therapy during acute hiv infection is associated with normalized levels of immune activation markers in cerebrospinal fluid but not in plasma. J Infect Dis. (2019) 220:1885–91. doi: 10.1093/infdis/jiz030 - DOI - PMC - PubMed
MeSH terms
Substances
LinkOut - more resources
Full Text Sources
Medical
Research Materials

