. 2025 May 8:16:1584350.
doi: 10.3389/fimmu.2025.1584350. eCollection 2025.

Decoding multiple myeloma: single-cell insights into tumor heterogeneity, immune dynamics, and disease progression

Affiliations

Decoding multiple myeloma: single-cell insights into tumor heterogeneity, immune dynamics, and disease progression

Zhenzhen Zhao et al. Front Immunol. .

Abstract

Background: Multiple myeloma (MM) is a biologically heterogeneous malignancy of clonal plasma cells, often progressing from MGUS or smoldering MM. It causes anemia, bone lesions, and immune dysfunction due to abnormal plasma cell expansion in the bone marrow. Neuroinflammatory and neurotrophic factors may influence MM progression by affecting immune cells and the bone marrow niche. Growing evidence points to a role for neuroimmune regulation in tumor immunity. Despite therapeutic progress, disease heterogeneity and resistance highlight the need for new strategies targeting the tumor microenvironment and neuroimmune axis.

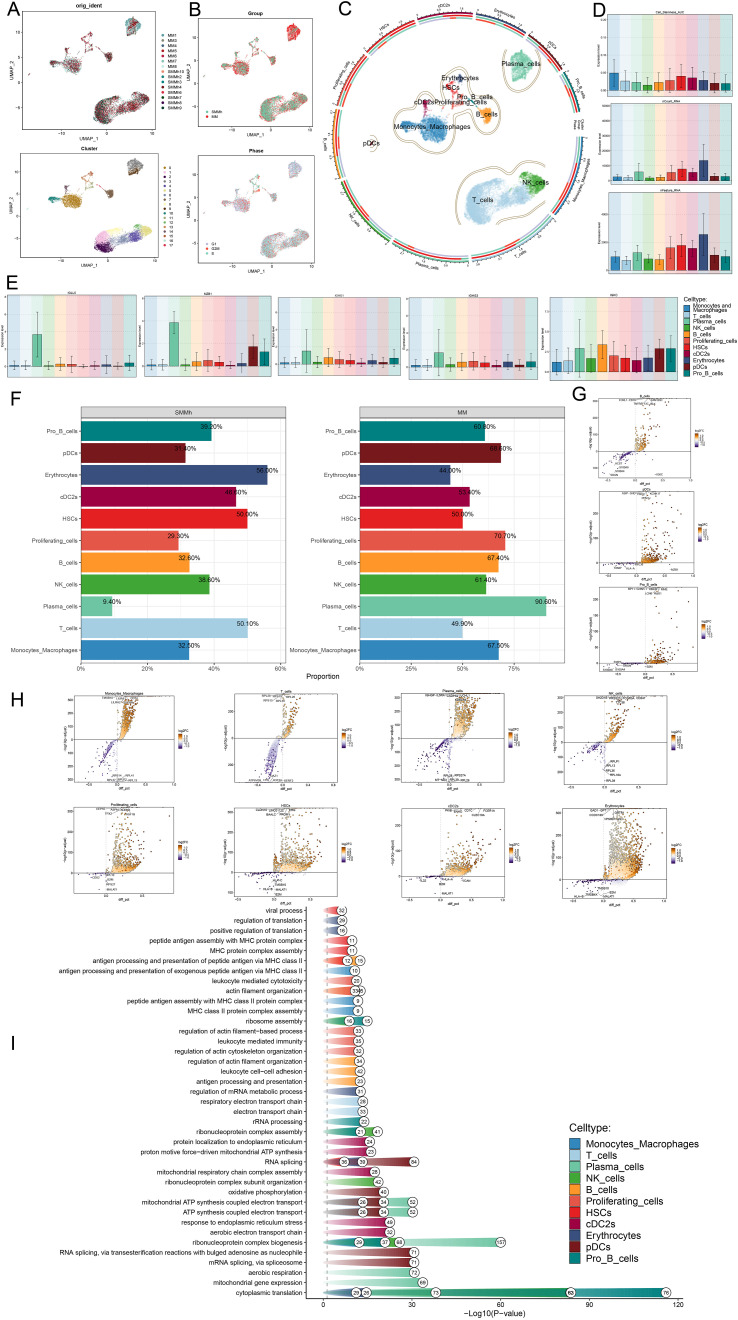
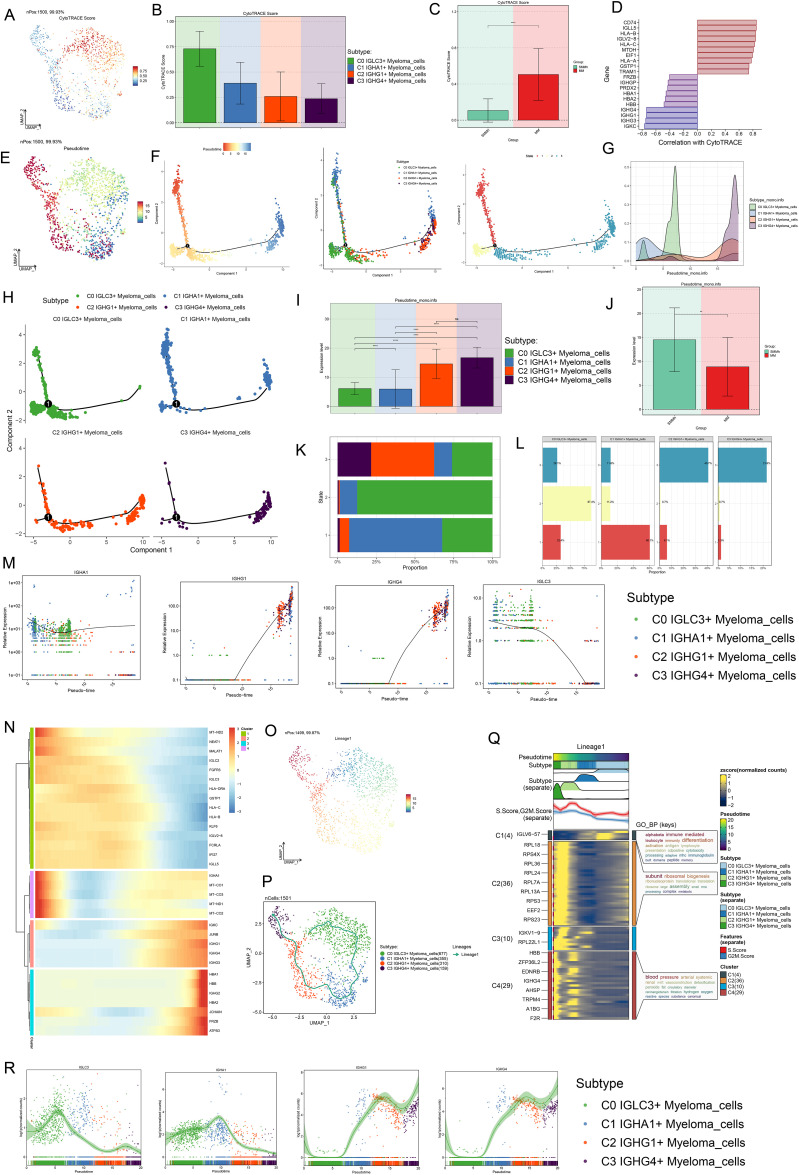
Methods: This investigation exploited single-cell RNA sequencing (scRNA-seq) to analyze MM and high-risk smoldering multiple myeloma (SMMh) samples, identifying 11 distinct cell types. We examined their transcriptional signatures, stemness, proliferative properties, and metabolic pathways, with particular attention to neuroimmune interactions in the tumor microenvironment. Using trajectory inference tools such as CytoTRACE, Monocle2, and Slingshot, we traced the differentiation paths of MM cell subpopulations and identified key signaling pathways that may influence immune responses and tumor progression.

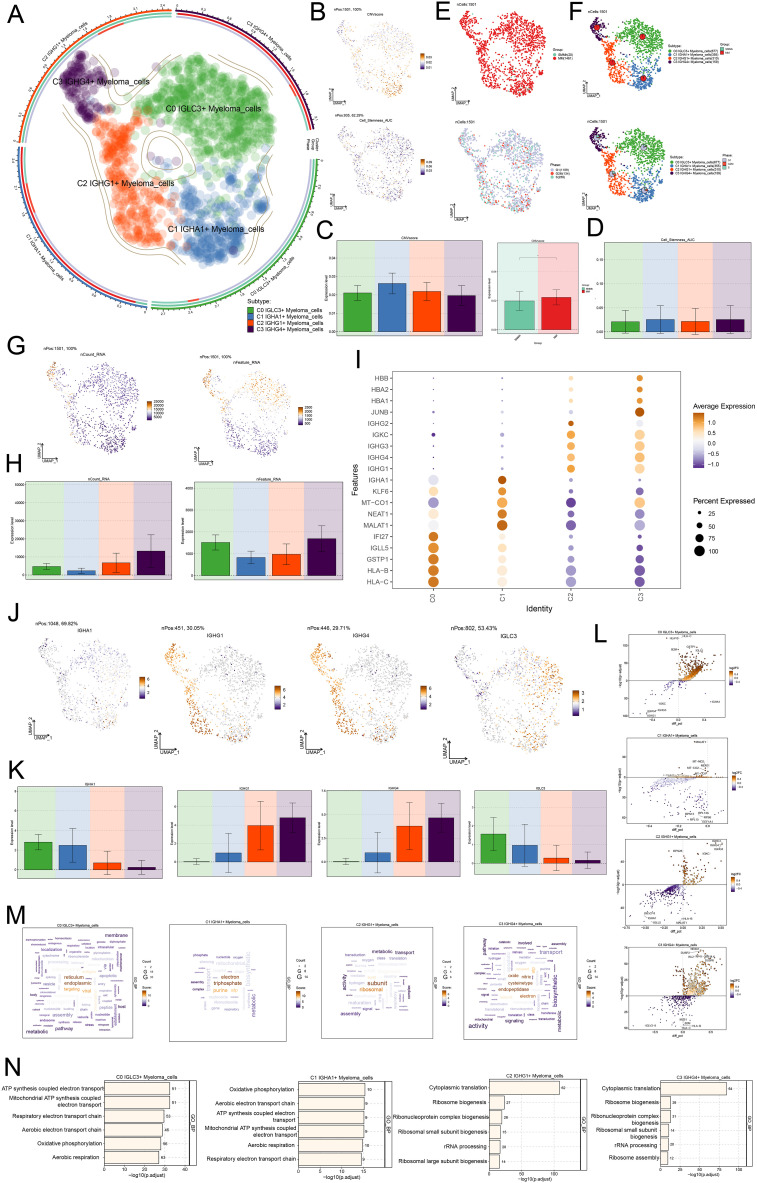
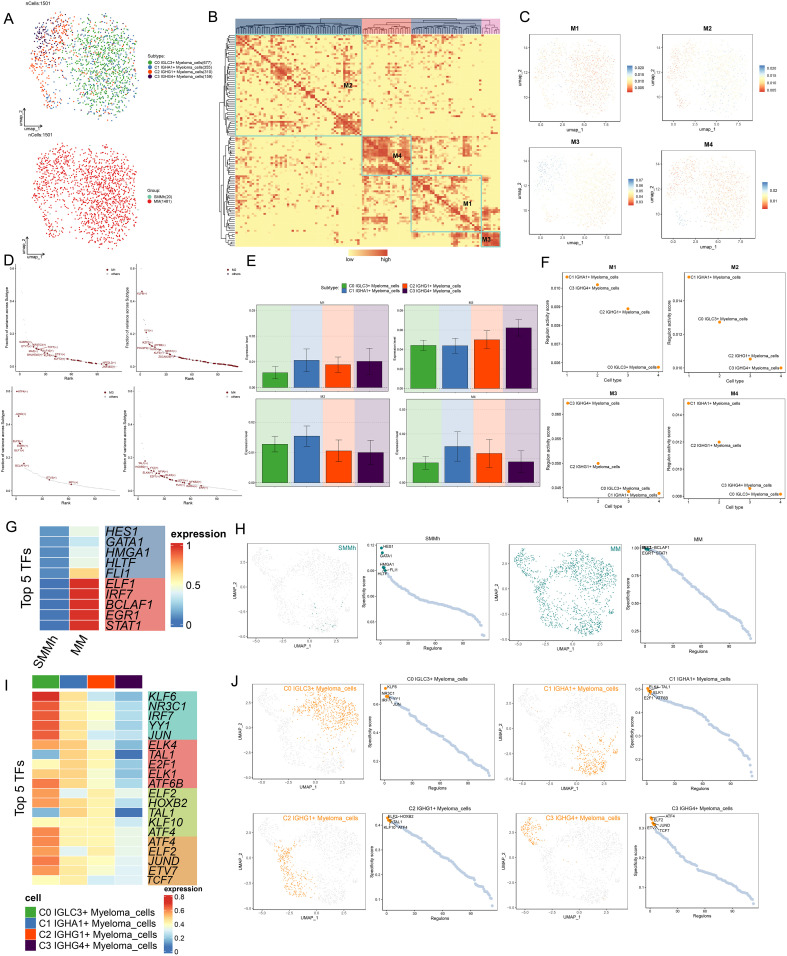
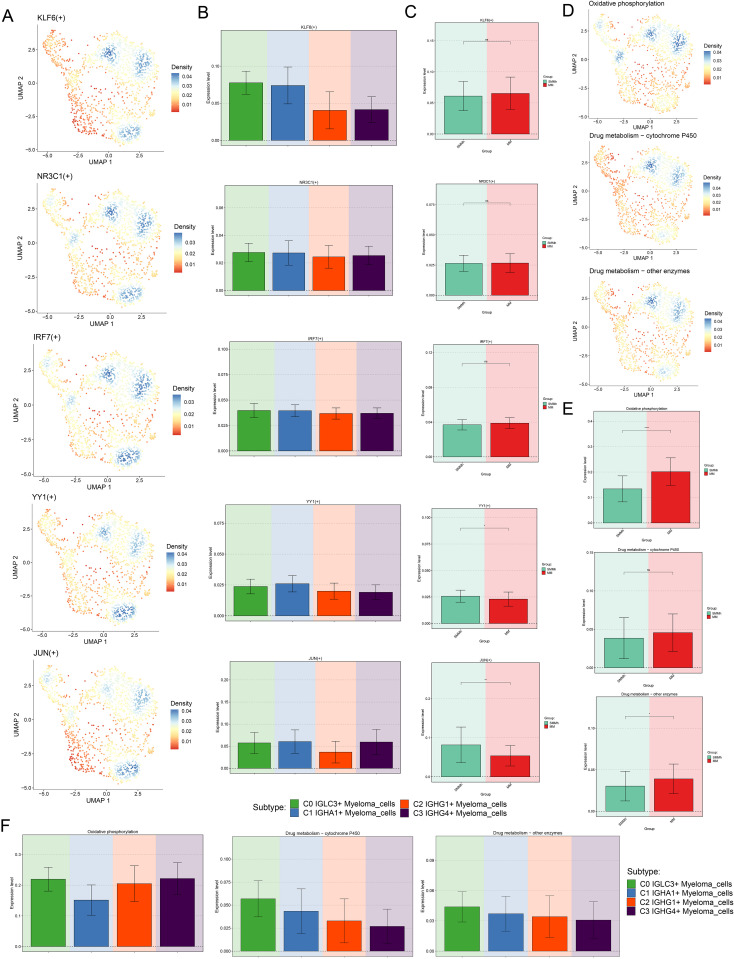
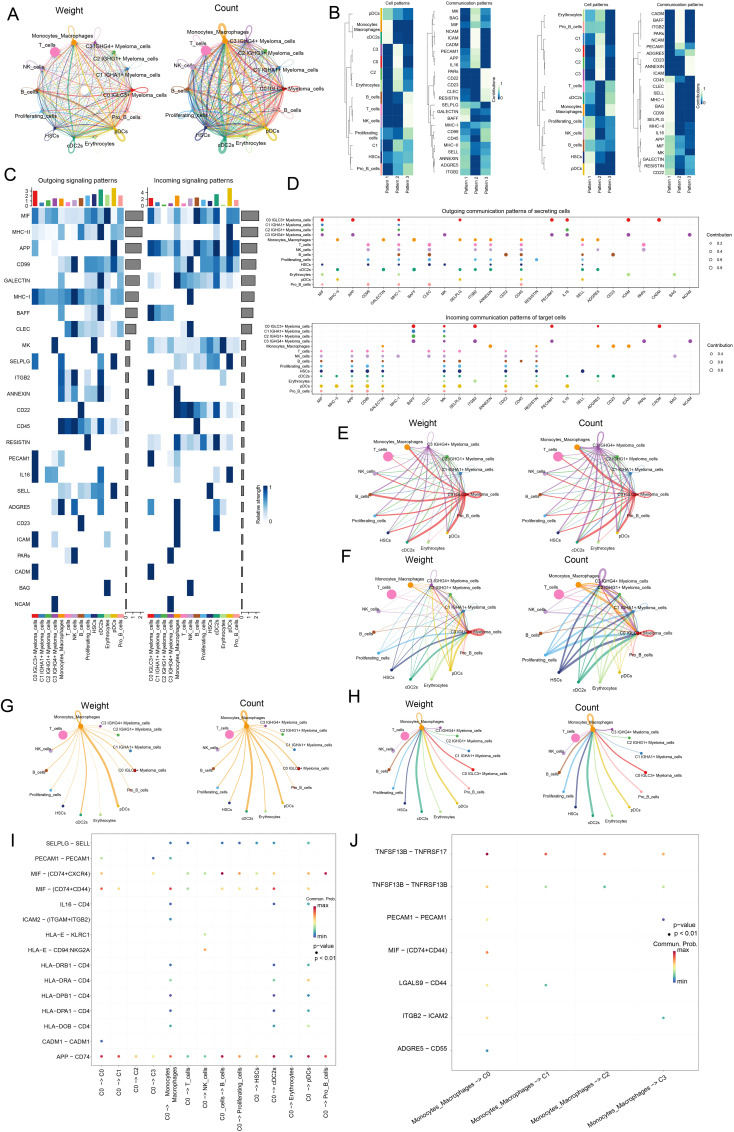
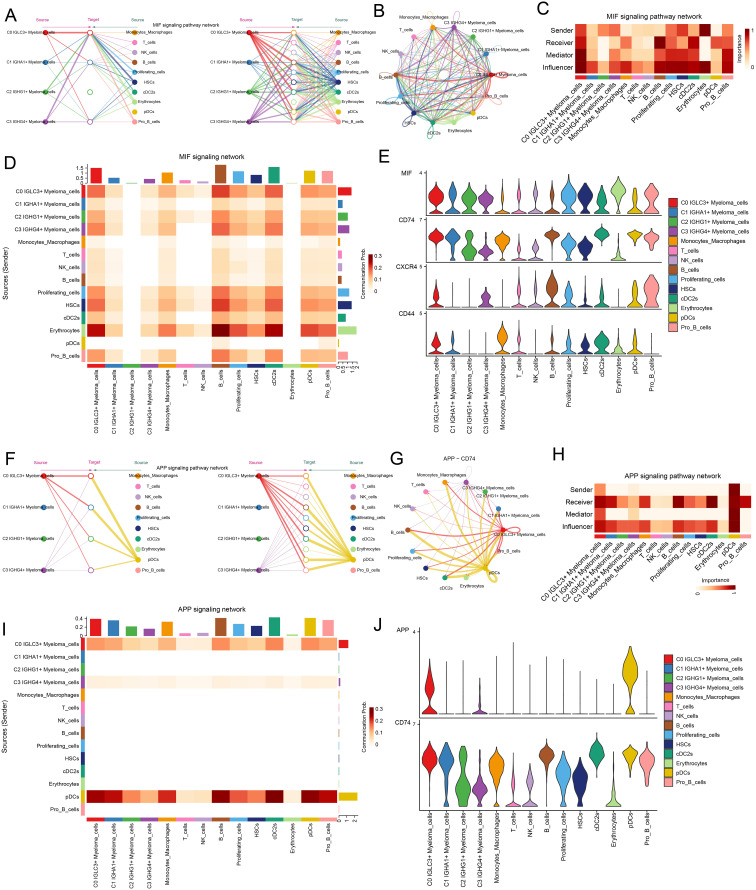
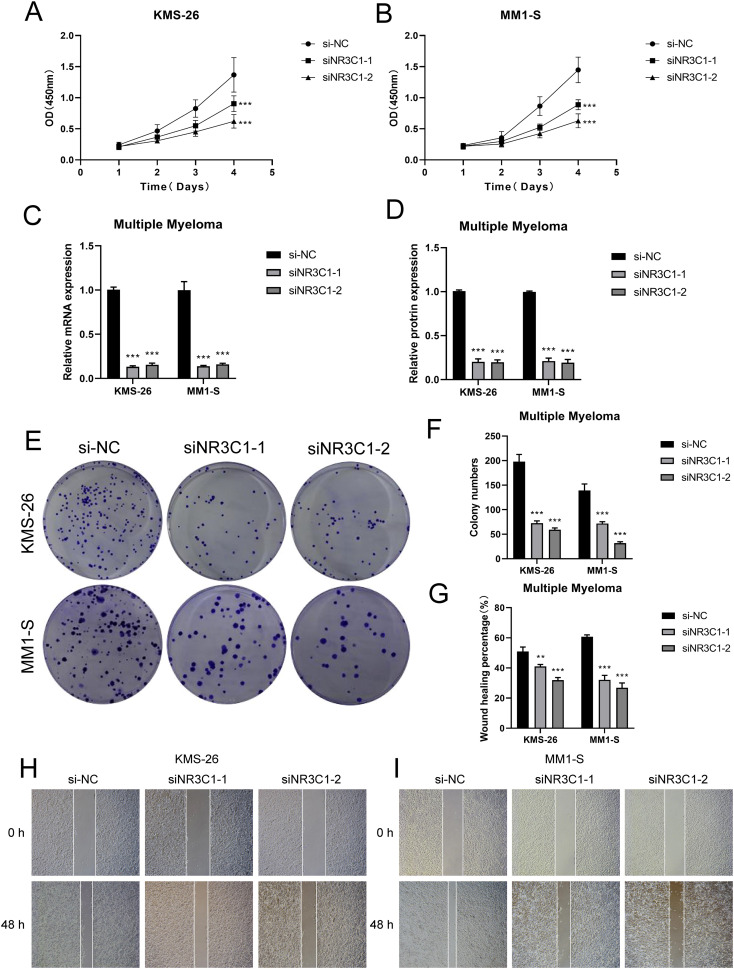
Results: The analysis identified four distinct subpopulations of myeloma cells, with the C0 IGLC3+ myeloma cells representing the least differentiated and most proliferative subset. These cells played a critical role in MM progression and may contribute to immune evasion mechanisms. Additionally, receptor-ligand interactions within the tumor microenvironment were identified, which may be influenced by neuroinflammatory and neurotrophic factors. These findings suggest that the nervous system and immune modulation significantly affect tumor biology, highlighting potential therapeutic targets that could be exploited to overcome resistance to conventional therapies.

Conclusion: This single-cell analysis provided new insights into the cellular diversity and differentiation trajectories in MM, offering a deeper understanding of the complex neuroimmune interactions that drive tumor progression and resistance. By incorporating the role of neuroinflammation and immune modulation, our study suggested novel therapeutic strategies targeting the neuroimmune axis in oncology, ultimately contributing to the development of more effective, personalized treatment approaches for MM.

Keywords: APP; IGLC3; MIF; NR3C1; ScRNA-seq; multiple myeloma; neuroimmunity.


Conflict of interest statement

The authors declare that the research was conducted in the absence of any commercial or financial relationships that could be construed as a potential conflict of interest.

Figures

Figure 1
Figure 1
Flow chart of this study. In this study, cellular heterogeneity in MM and SMMh samples was analyzed by single-cell RNA sequencing, identifying 11 cell types. Significant differences in transcriptional profiles were found between MM and SMMh cells, and different cell subpopulations had different regulatory activities in cellular value-addition, differentiation and metabolic pathways. The differentiation process of myeloma cells was speculated using trajectory analysis methods such as CytoTRACE and Monocle2, revealing that C0 IGLC3+ Myeloma cells are the most naïve tumor cells and that they have a key role in myeloma development and progression. The molecular characterization of myeloma cells during malignant transformation was further elucidated by the analysis of TFs and metabolic pathways.
Figure 2
Figure 2
Heterogeneity of cells in MM as well as high-risk smoldering myeloma. (A) UMAP plots showed the analysis of all cells from 15 MM and SMMh samples using the scRNA-seq method (upper panel) as well as these samples after dimensionality reduction clustering into 17 cell clusters. (B) UMAP plots showed the tissue type of all cells (MM,SMMh) and the cell cycle stage they are in (G1, G2M, S). (C) UMAP plot showed 11 different cell types (Monocytes and Macrophages, T cells, Plasma cells, NK cells, B cells, Proliferating cells, HSCs, cDC2s, Erythrocytes, pDCs, Pro B cells). (D) Bar plots showed the Cell Stemness AUC (the AUC score of Cell Stemness), nCount RNA, and nFeature RNA scores for 11 cells. (E) Bar plots showed the expression of TOP5 marker gene in Plasma cells in all cell types separately. (F) Bar plots demonstrated the percentage of SMMh and MM tissue types in each cell type. (G-H) Volcano plots demonstrated the expression of up- and down-regulated differential genes in all cell types. (I) Enrichment analysis of differential genes in 11 cell types.
Figure 3
Figure 3
Single cell characteristics of myeloma cell subsets. (A) UMAP plot showed the distribution of four myeloma cell subsets. (B) UMAP plots showed the difference of CNVscore and Cell Stemness AUC scores of all myeloma cells. (C) The bar plots showed the difference of CNVscore of four myeloma cell subsets and different tissue types. (D) The bar plot showed the difference of Cell Stemness AUC scores among four myeloma cell subsets. (E) The tissue types (SMMh, MM) and the distribution of cell cycle stages (G1, G2M, S) of all myeloma cells. (F) UMAP plots showed the distribution of four myeloma cells and pie chart shows the tissue type and the proportion of cell cycle stages of each myeloma cell subpopulation. (G, H) UMAP plots and Bar plots showed the differences of nCount RNA and nFeature RNA scores of all myeloma cells. (I) Bubble plot showed the expression of TOP5marker gene in four myeloma cell subsets. (J, K) UMAP and bar plots showed the expression of IGLC3, IGHA1, IGHG1, IGHG4 in all myeloma cells. (L) Volcano plots showed up-regulated and down-regulated differential genes in four myeloma cell subsets. (M) The word cloud plots showed the results of path enrichment. (N) The bar plots showed the enrichment analysis results of GO-BP of myeloma cell subsets.
Figure 4
Figure 4
Proposed time-series analysis of myeloma cell subpopulations. (A, B) The UMAP and Bar plots showed the results of the stemness ability of four subtypes of myeloma cells calculated based on CytoTRACE. (C) Bar plot showed the different levels of differentiation in SMMh and MM. (D) Correlation of stemness-related genes in with CytoTRACE. (E) UMAP plot demonstrated the order of cell differentiation inferred by Monocle2. (F) Two-dimensional trajectory plots demonstrated the differentiation trajectories of myeloma cells labeled with putative chronological order, cellular subpopulations, and putative temporal stages, respectively. (G) Ridge plot demonstrated the difference in distribution of the 4 myeloma cell subpopulations across the proposed temporal trajectory. (H) 2D trajectory faceted plots demonstrated the distribution of each of the 4 myeloma cell subpopulations across the pseudotime trajectories. (I, J) Bar plots demonstrated the differences in the proposed temporal order of the 4 myeloma cell subpopulations as well as different tissue types. (K, L) Stacked bar plots demonstrated the distribution of the 4 myeloma cell subpopulations as a percentage of the distribution in the three proposed temporal order trajectory phases. (M) Scatter plots demonstrated the distribution of IGLC3, IGHA1, IGHG1, IGHG4 along with Monocle2 simulated mimetic timing trajectories in different myeloma cell subpopulations. (N) Heatmap demonstrated the expression of differential genes along with the pseudotime trajectories. (O, P) UMAP plots depicted the temporal dynamics of cell differentiation profiles of four myeloma cell subtypes: C0-C1-C2-C3. (Q) Heatmap showed GO-BP pathway enrichment during myeloma cell differentiation. (R) Scatter plots showed the distribution of IGLC3, IGHA1, IGHG1, IGHG4 along with Slingshot-simulated pseudotime trajectories in different myeloma cell subpopulations.
Figure 5
Figure 5
Analysis of TF regulatory activity in myeloma cells. (A) UMAP plots showed the distribution of cell subpopulations as well as tissue origin after reclustering analysis based on regulatory activity of myeloma cell TFs. (B) Heatmap demonstrated the categorization of endothelial cell TFs into four regulatory modules (M1, M2, M3, and M4) based on the CSl matrix. (C) UMAP plots demonstrated the distribution of TFs in the four regulatory modules. (D) The TFs in the four regulatory modules were ranked according to fraction of variance across subtype, and their rankings are shown separately. (E, F) Bar plots and scatter plots showed the expression levels of TFs and Regulon activity score based on the four myeloma cell subpopulations in the four regulatory modules, respectively. (G) Heatmap showed the expression of TOP5 TFs in SMMh as well as MM. (H) UMAP plots and scatter plots showed the distribution of TFs in SMMh and MM and Specificity score of Regulon. (I) Heatmap demonstrated the expression of TOP5 TFs in four myeloma cell subpopulations. (J) UMAP plots and scatter plots demonstrated the distribution of TFs in four myeloma cell subpopulations and specificity score of Regulon.
Figure 6
Figure 6
Visualization of TOP5 TFs of C0 IGLC3+ Myeloma Cells. (A) UMAP plots demonstrated the distribution density of TOP5 TFs (KLF6, NR3C1, IRF7, YY1, JUN) of C0 IGLC3+ Myeloma Cells. (B) Bar plots demonstrated the expression levels of KLF6(+), NR3C1(+), IRF7(+), YY1(+), JUN (+) in four myeloma cell subpopulations. (C) Bar plots showed the expression levels of KLF6(+), NR3C1(+), IRF7(+), YY1(+), JUN (+) in SMMh as well as MM. (D) Levels of regulatory activity of myeloma cell subpopulations under different metabolic pathways. (Oxidative phosphorylation, Drug metabolism-cytochrome P450 and Drug metabolism-other enzymes) (E) Differential expression levels of different tissue types under different metabolic pathways. (F) Bar plots further demonstrated the regulatory activity of myeloma cell subpopulations under different metabolic pathways.
Figure 7
Figure 7
Analysis of the Interaction between Various Cell Types in Myeloma. (A) Circle plots showed the weight and quantity of receptor ligand pair interactions between four myeloma cell subsets and all other cells (Monocytes and Macrophages, T cells, NK cells, B cells, Proliferating cells, HSCs, cDC2s, Erythrocytes, pDCs, Pro B cells). (B) Heatmaps showed the communication Pattern of outgoing signal (left) and incoming signal (right) between various cells in myeloma. (C) Heatmaps showed the communication probability of each communication in Outgoing signaling patterns and Incoming signaling patterns of all cell types. (D) Bubble plots showed Outgoing communication patterns of secreting cells and Incoming communication patterns of target cells. (E) Screening of four myeloma cell subpopulations for source, circle plots showed the weight (left) and number (right) of cell-cell interactions contributing. (F) Screening of four myeloma cell subpopulations for Target, with weight (left) and number (right) contributions of interactions between cells. (G) Screening of Monocytes Macrophages for source, where we used circle plots to show the weight (left) and number (right) contributions of interactions between cells. (H) Screening of Monocytes Macrophages for Target, with weight (left) and number (right) contributions of interactions between cells. (I) Bubble plot demonstrated the interaction of receptor-ligand pairs between C0 IGLC3+ Myeloma Cells as source and other cells as target. (J) Bubble plot demonstrated Monocytes Macrophages as source and four myeloma cell subpopulations as the role of receptor-ligand pairs between targets.
Figure 8
Figure 8
C0 IGLC3+ Myeloma Cells played important roles through APP signaling pathway and MIF signaling pathway. (A, B) Hierarchical plot and circled plot demonstrated autocrine and paracrine interactions of the four myeloma cell clusters with other cells in the MIF signaling pathway. (C) Heatmap demonstrated the network centrality scores of different cell clusters in the MIF signaling pathway. (D) Heatmap demonstrated the communication probability of different cell clusters in the MIF signaling communication network. (E) Violin plot demonstrated the proteins involved in cell-to-cell interactions in the MIF signaling pathway network. (F) Hierarchical plot demonstrated cell-to-cell interaction patterns in the APP signaling pathway network. (G) Circle plot demonstrated cellular communication patterns of interactions through APP-CD74 protein pairs. (H) Heatmap demonstrated network centrality scores of different cell clusters in the APP signaling pathway. (I) Heatmap demonstrated the communication probability of different cells under the APP signaling pathway network. (J) Violin plot visualized the interacting proteins in the APP signaling pathway.
Figure 9
Figure 9
Observe and analyze the changes of cell proliferation ability after NR3C1 knockdown. (A, B) CCK-8 was used to detect the changes of cell viability of KMS26 cell line and MM1-S cell line NR3C1 after knockdown. (C, D) qRT-PCR was used to detect the mRNA and protein expression levels in KMS26 cell line and MM1-S cell line before and after NR3C1 knockdown. (E, F) Colony formation assay was carried out on KMS26 cell line and MM1-S cell line before and after NR3C1 knockdown. (G–I) Scratch assay was performed on KMS26 cell line and MM1-S cell line before and after NR3C1 knockdown, **p<0.01, ***p<0.001.
Figure 10
Figure 10
Effect of NR3C1 on proliferation, invasion and metastasis of myeloma cells. (A–D) Transwell assay showed that the migration and invasion of KMS26 cell line and MM1-S cell line were significantly reduced after NR3C1 knockdown. (E–G) EdU staining showed that the cell proliferation of KMS26 cell line and MM1-S cell line was inhibited after NR3C1 knockdown, **p<0.01, ***p<0.001.

Similar articles

Cited by

References

    1. Khanmammadova N, Islam S, Sharma P, Amit M. Neuro-immune interactions and immuno-oncology. Trends Cancer. (2023) 9:636–49. doi: 10.1016/j.trecan.2023.05.002 - DOI - PMC - PubMed
    1. Shurin MR, Shurin GV, Zlotnikov SB, Bunimovich YL. The neuroimmune axis in the tumor microenvironment. J Immunol. (2020) 204:280–85. doi: 10.4049/jimmunol.1900828 - DOI - PubMed
    1. Kyle RA, Rajkumar SV. Multiple myeloma. N Engl J Med. (2004) 351:1860–73. doi: 10.1056/NEJMra041875 - DOI - PubMed
    1. Boiarsky R, Haradhvala NJ, Alberge JB, Sklavenitis-Pistofidis R, Mouhieddine TH, Zavidij O, et al. . Single cell characterization of myeloma and its precursor conditions reveals transcriptional signatures of early tumorigenesis. Nat Commun. (2022) 13:7040. doi: 10.1038/s41467-022-33944-z - DOI - PMC - PubMed
    1. Kyle RA, Rajkumar SV. Multiple myeloma. Blood. (2008) 111:2962–72. doi: 10.1182/blood-2007-10-078022 - DOI - PMC - PubMed

LinkOut - more resources