. 2025 Aug;12(30):e02146.
doi: 10.1002/advs.202502146. Epub 2025 May 23.

Inhibiting FAT1 Blocks Metabolic Bypass to Enhance Antitumor Efficacy of TCA Cycle Inhibition through Suppressing CPT1A-Dependent Fatty Acid Oxidation

Affiliations

Inhibiting FAT1 Blocks Metabolic Bypass to Enhance Antitumor Efficacy of TCA Cycle Inhibition through Suppressing CPT1A-Dependent Fatty Acid Oxidation

Fanghui Chen et al. Adv Sci (Weinh). 2025 Aug.

Abstract

FAT atypical cadherin 1 (FAT1) is one of the most frequently mutated genes in head and neck squamous cell carcinoma (HNSCC), exhibiting the highest mutation rate across different tumor types. Although FAT1's role has attracted considerable attention, its impact on cancer metabolism and treatment resistance remains poorly understood. In this study, it is demonstrated that knockout of mutant FAT1 in HNSCC cells attenuates CPT1A-driven fatty acid oxidation (FAO) through downregulation of the transcription factor ASCL2, leading to marked suppression of tumor growth. Notably, FAT1-mutant HNSCC cells exhibit resistance to the TCA cycle inhibitor CPI-613 through activation of CPT1A-mediated FAO, whereas genetic ablation of mutant FAT1 restores sensitivity to CPI-613. To achieve in vivo depletion of FAT1, LNP-sgFAT1 is developed, a novel lipid nanoparticle (LNP) system encapsulating Cas9 mRNA and FAT1-targeting sgRNA. In murine models bearing FAT1-mutant head and neck tumors, LNP-sgFAT1 demonstrated enhanced antitumor activity when combined with CPI-613. Collectively, these findings establish that mutant FAT1 drives CPT1A-dependent FAO, facilitating a metabolic bypass that confers resistance to TCA cycle inhibition in HNSCC. This mechanistic insight highlights promising opportunities for combinatorial therapeutic strategies co-targeting genetic and metabolic vulnerabilities in cancer.

Keywords: CPI‐613 sensitivity; CPT1A; FAT1; fatty acid oxidation; head and neck cancer; metabolic bypass.


Conflict of interest statement

YT has previously received funds for research contracts from Cornerstone Pharmaceuticals. NFS reports compensated and uncompensated advisory roles with: Astra Zeneca, Eisai Medical, Exelixis, Merck, Merck EMD Serono, Pfizer, Kura, Vaccinex, CUE, BionTech, GSK, TOSK, Seagen, Flamingo, Infinity, Inovio, Aveo, Medscape, Onclive, Uptodate, BMS, Cornerstone, Celldex, Surface Oncology, Astex, Imugene, Faron Pharmaceutical, Coherus, Adagene, Fulgent Springer, Nanobiotix, and Taiho; funding from: Exelixis, BMS. The other authors declare no conflict of interest.

Figures
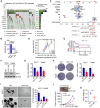
Figure 1
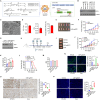
Figure 1
Mutant FAT1 functions as a tumor promoter in HNSCC. A) Top 10 most frequently mutated genes in TCGA HNSCC cohort (n = 523). B) Frequency of FAT1 mutation in HPV‐ and HPV+ tumor subtypes in TCGA HNSCC cohort. The number and percentage of cases with mutations are displayed. NA, not annotated. C) Clinical evaluation of FAT1 mutations in HPV‐ tumors in TCGA HNSCC cohort. Points represent the individual score of each variable at different values, and total points represent the total score of the corresponding individual scores for all variables. Pr (prediction) represents the predicted overall survival (OS) at indicated years. D) Calibration curve assessing the reliability of nomogram model for OS in HPV‐ HNSCC patients with FAT1 mutations. Calibration curve values greater than 0.75 suggest the credibility of the nomogram model. E) High TMB associated with FAT1 mutations as a potential risk factor for OS in HPV‐ HNSCC patients with FAT1 mutations in TCGA cohort. F) FAT1 KO efficiency in SCC1 and Tu686 cells determined by Western blot. G–I) Effect of FAT1 KO on cell proliferation (for 3 days), colony formation (for 14 days), and tumorsphere formation (for 14 days) in SCC1 and Tu686 cells. In (H) and (I), the experiments were performed in triplicate and quantitative data are shown in the right panel. (J, K) Representative flank tumors and tumor growth curve J), and tumor weight K) in the indicated treatment groups. FAT1 KO or parental SCC1 cells were implanted to the right flank of 6‐week‐old NSG mice (n = 5/group), and tumor size was measured by a digital caliper weekly for 35 days. Bars express mean ± SD. Statistical analyses were conducted using unpaired two‐tailed Student's t‐test. *p < 0.05; **p < 0.01.
Figure 2
Figure 2
Depletion of mutant FAT1 downregulates FAM‐associated signaling in HNSCC cells. A–D) Gene expression profile and pathways analysis based on RNA‐seq data from FAT1 KO and parental SCC1cells. A) A dot plot of enriched KEGG pathways based on DEGs identified in FAT1 KO SCC1 cells vs. parental cells. The signaling pathways associated with FAM are outlined in red. B) An upset plot of enriched GO terms based on downregulated genes in FAT1 KO SCC1cells vs. parental cells. Each point represents the log2 FC of each gene in a gene set. The greatest valued points are the most downregulated genes enriched in the given biological processes. The signaling pathways associated with FAM are outlined in red. C) Heatmap analysis of DEGs identified in FAT1 KO SCC1 cells vs. parental cells. D) DEGs in FAM signaling were tested for enrichment via Gene Set Enrichment Analysis (GSEA). The panel to the right of GSEA plot shows the corresponding heatmap of DEGs in FAM signaling. E,F) Decreased CPT1A expression confirmed by qRT‐PCR and Western blot in FAT1 KO and parental SCC1 and Tu686 cells. G) A positive correlation between the expression of mutant FAT1 and CPT1A illustrated in scatter plot using the RNA‐seq data from TCGA HNSCC cohort. H) Relative quantification of FAO in SCC1 and Tu686 cells with or without FAT1 KO determined by FAO activity assay. I) Representative fluorescence confocal microscopy images of BODIPY 493/503 staining (green) in FAT1 KO and parental SCC1 and Tu686 cells. J) Representative images and quantitative data of flow cytometry analysis using Nile Red staining in FAT1 KO and parental SCC1 and Tu686 cells. K) CPT1A overexpression (CPT1A O/E) in FAT1 KO SCC1 and Tu686 cells. L,M) Effect of restoring CPT1A expression on FAO levels in FAT1 KO SCC1 and Tu686 cells. The results from FAO activity assay and flow cytometry analysis using Nile Red staining are shown in (L) and (M), respectively. O) Effect of wtFAT1 overexpression on CPT1A levels in FAT1 KO and parental SCC1 and Tu686 cells. P,Q) Effect of wtFAT1 overexpression on LD formation in FAT1 KO and parental SCC1 and Tu686 cells. Representative images of BODIPY 493/503 staining and quantitative data of flow cytometry analysis using Nile Red staining are shown in (P) and (Q), respectively. Bars express mean ± SD. Statistical analyses were conducted using unpaired two‐tailed Student's t‐test. **p < 0.01.
Figure 3
Figure 3
Loss of mutant FAT1 downregulates CPT1A gene expression in HNSCC cells through suppressing ASCL2. A) Fold changes of the downregulated transcription factor genes in FAT1 KO vs. parental SCC1 cells determined by RNA‐seq data. B) Alterations in ASCL2 protein levels between FAT1 KO and parental SCC1 and Tu686 cells determined by Western blot. C) Effect of FAT1 KO on the tyrosine phosphorylation levels of RTKs determined by Human Phospho‐RTK array in SCC1 cells. D) Effect of FAT1 KO on the p‐AKT levels in SCC1 and Tu686 cells. E) Effect of AKT activator SC79 on FAT1 KO‐mediated reduction of ASCL2 expression in SCC1 and Tu686 cells. F) Effect of restoring ASCL2 expression on FAT1 KO‐mediated reduction of CPT1A expression in SCC1 and Tu686 cells. G) Schematic of the DNA binding site of ASCL2 on the upstream promoter of the CPT1A gene. H) Binding of ASCL2 to the CPT1A gene promoter in SCC1 cells determined by ChIP assay. I) Changes in the binding amount of ASCL2 to the CPT1A gene promoter in FAT1 KO and parental SCC1 and Tu686 cells determined by ChIP‐qPCR analysis. J) Schematic showing the sgTarget that specifically targets ASCL2 binding site at the CPT1A gene promoter. K,L) Effect of the sgTarget on CPT1A expression (K) and protein (L) levels in in FAT1 KO and parental SCC1 and Tu686 cells. FAT1 KO and parental SCC1 and Tu686 cells were co‐transfected with dCas9 and sgTarget or sgGFP, and the CPT1A expression and protein levels were determined by qRT‐PCR and Western blot. Bars express mean ± SD. Statistical analyses were conducted using unpaired two‐tailed Student's t‐test. *p < 0.05; **p < 0.01.
Figure 4
Figure 4
FAT1 mutations reduce the sensitivity of HPV‐negative HNSCC to CPI‐613. A) Pearson correlation analysis between the expression of the mutant FAT1 gene in HPV‐ tumor cases and the IC50 values of drugs available in GDSCs led to the identification of 28 drugs meeting our screening criteria (Spearman correlation value≤‐0.4, P< 0.05). B) Top 10 drugs showing significantly differential sensitivity in HPV‐ HNSCC cases carrying mutant FAT1 compared to those carrying wild‐type FAT1. C,D) Effect of FAT1 KO on sensitivity to CPI‐613 in SCC1 and Tu686 cells determined by cell viability (C) and colony formation (D). E,F) Effect of FAT1 KO on the antitumor activity of CPI‐613 in orthotopic tongue tumor mice. Representative tongue tumors (E) and tumor growth curve (F) in the indicated treatment groups. FAT1 KO or parental SCC1 cells were implanted to the tongue of 6‐week‐old NSG mice (n = 5/group), and 50 mg kg−1 CPI‐613 was administered by i.p. injection on day 10 and was given once daily for 10 days. Tumor size was measured by a digital caliper twice per week for 21 days. G) IHC with anti‐Ki67 antibody in FAT1 KO and parental SCC1 tumors with or without CPI‐613 treatment. Representative IHC imaging and quantitative data are shown in the left and right panels. Bars express mean ± SD. Statistical analyses were conducted using unpaired two‐tailed Student's t‐test. *p < 0.05; **p < 0.01; and ***p < 0.001.
Figure 5
Figure 5
Mutant FAT1 contributes to reduced sensitivity of HNSCC cells to CPI‐613 via CPT1A‐dependent FAO. A) CPT1A levels in SCC1 and Tu686 cells treated with 50 µm CPI‐613 for 24 and 48 h. B) FAO levels in SCC1 and Tu686 cells with or without 50 µm CPI‐613 for 24 h determined by FAO activity assay. C) Effect of FAT1 KO on CPT1A expression in SCC1 and Tu686 cells treated with or without 50µM CPI‐613 for 24 h. D) IF with anti‐CPT1A antibody in FAT1 KO and parental SCC1 tumors with or without CPI‐613 treatment. Representative IF imaging and quantitative data are shown in the left and right panels. Scale bar = 50 µm. E) Effect of CPI‐613 on FAO levels in FAT1 KO and parental SCC1 and Tu686 cells. F) Representative images and quantitative data of flow cytometry analysis (n = 3) using Nile Red staining in FAT1 KO and parental SCC1 and Tu686 cells, in the presence or absence of 50 µm CPI‐613 for 24 h. G) Representative images and quantitative data of flow cytometry analysis (n = 3) using DCF staining in FAT1 KO and parental SCC1 and Tu686 cells, in the presence or absence of 50µM CPI‐613 for 24 h. H) Apoptosis determined by flow cytometry analysis (n = 3) after Annexin V/7‐AAD double staining in FAT1 KO and parental SCC1 and Tu686 cells, in the presence or absence of 50 µm CPI‐613 for 48 h. I–K) Effect of the CPI‐613/ST1326 combination on FAO activity (I), cell viability (J) and colony formation (K) of SCC1 and Tu686 cells. Cells were treated with DMSO, 50 µm CPI‐613 and 5 µm ST1326, alone or in combination. Bars express mean ± SD. Statistical analyses were conducted using two‐tailed unpaired Student's t‐test. *p < 0.05; **p < 0.01; and ***p < 0.001.
Figure 6
Figure 6
The combination of LNP‐sgFAT1 and CPI‐613 exhibits greater antitumor activity than either agent alone in orthotopic mice bearing head and neck tumors with FAT1 mutation. A) Schematic representation of the (left) chemical structures of active lipids (113‐O14O, 306‐O10S, and 113‐O12O), cholesterol, DOPC, and DMG‐PEG2k, and (right) structure of spCas9 mRNA and sequences of sgRNA targeting exon 2 (sgFAT1‐1) and exon 8 (sgFAT1‐2) in the human FAT1 gene. B) KO efficiency of sgFAT1 co‐delivered with Cas9 mRNA by different LNP(s) (113‐O14O, 306‐O10S, and 113‐O12O) in SCC1 cells. Western blot analysis was performed after 72 h of exposure to different LNP formulations. C) Representative cryoEM image of Cas9 mRNA‐sgRNA‐LNP. D) Hydrodynamic size, polydispersity index (PDI) and encapsulation efficacy of LNP‐sgFAT1. E) Tongues with SCC1 tumors extracted from NSG mice treated with control LNP or LNP‐sgFAT1. F) Tumor growth curve in SCC1 tongue tumor‐bearing mice treated with control LNP or LNP‐sgFAT1. G) KO efficiency of LNP‐sgFAT1 in SCC1 tumors determined by Western blot. H) Experimental procedure for in vivo studies. SCC1 tumor‐bearing NSG mice were treated with CPI‐613 and LNP‐sgFAT1, alone or in combination. In this study, 50 mg kg−1 CPI‐613 was administered by i.p. injection every day for 10 days, and 5 mg kg−1 LNP‐sgFAT1 was administered by intratumoral injection every three days for three doses. Tumor size was measured two or three times per week for 21 days (n = 5 mice per group). I–K) Representative tumors (I), tumor growth curve (J), and body weight (K) in each treatment group. L) Kaplan‐Meier plot with log‐rank test for survival for mice treated with or without CPI‐613 and/or LNP‐sgFAT1 (n = 5 mice per group). M) The body mass index (BMI) of mice treated with or without CPI‐613 and/or LNP‐sgFAT1 (n = 5 mice pergroup). N) IF with anti‐CPT1A antibody in SCC1 tumors following single or combination treatment, as indicated. Representative IF imaging and quantitative data are shown in the left and right panels. Scale bar = 50 µm. O,P) IHC of Ki67 and TUNEL assays using the tumor tissues collected from each treatment group. Representative results and quantitative data are shown in the left and right panels. Bars express mean ± SD. Statistical analyses were conducted using unpaired two‐tailed Student's t‐test. *p < 0.05; **p < 0.01.
Figure 7
Figure 7
The schematic illustrates the underlying mechanism by which mutant FAT1 influences treatment efficacy of TCA cycle inhibition in HNSCC cells. CPI‐613 treatment inhibits the TCA cycle while increases CPT1A levels in HNSCC cells harboring mutant FAT1. Inhibiting FAT1 using LNP‐sgFAT1 decreases CPT1A expression by suppressing ASCL2, leading to reduced fatty acid oxidation (FAO). This reduction in FAO subsequently results in an increase in lipid droplets and reactive oxygen species (ROS), thereby potentiating the antitumor effects of CPI‐613. Figure created using Biorender (https://biorender.com/).

References

    1. Saba N. F., Steuer C. E., Ekpenyong A., McCook‐Veal A., Magliocca K., Patel M., Schmitt N. C., Stokes W., Bates J. E., Rudra S., Remick J., McDonald M., Abousaud M., Tan A. C., Fadlullah M. Z. H., Chaudhary R., Muzaffar J., Kirtane K., Liu Y., Chen G. Z., Shin D. M., Teng Y., Chung C. H., Nat. Med. 2023, 29, 880. - PMC - PubMed
    1. Siegel R. L., Miller K. D., Jemal A., CA Cancer J. Clin. 2020, 70, 7. - PubMed
    1. Shin D. M., Khuri F. R., Head Neck 2013, 35, 443. - PubMed
    1. Carlisle J. W., Steuer C. E., Owonikoko T. K., Saba N. F., CA: Cancer J. Clin. 2020, 70, 505. - PubMed
    1. Johnson D. E., Burtness B., Leemans C. R., Lui V. W. Y., Bauman J. E., Grandis J. R., Nat. Rev. Dis. Primers 2020, 6, 92. - PMC - PubMed

MeSH terms

LinkOut - more resources