

Apigenin attenuates the atherosclerotic lesions through enhancing selective autophagy/lipophagy and promoting RCT process
- PMID: 40407263
- PMCID: PMC12107649
- DOI: 10.1080/13880209.2025.2509020
Apigenin attenuates the atherosclerotic lesions through enhancing selective autophagy/lipophagy and promoting RCT process
Abstract
Context: Apigenin, a naturally flavonoid, is reported to have protective effects in chronic and metabolic diseases. But the therapeutic or ameliorative effects of apigenin on atherosclerosis are not known.
Objective: Our study aimed to elucidate the underlying mechanism of apigenin on preventing atherosclerosis by enhancing selective autophagy/lipophagy and promoting RCT process.
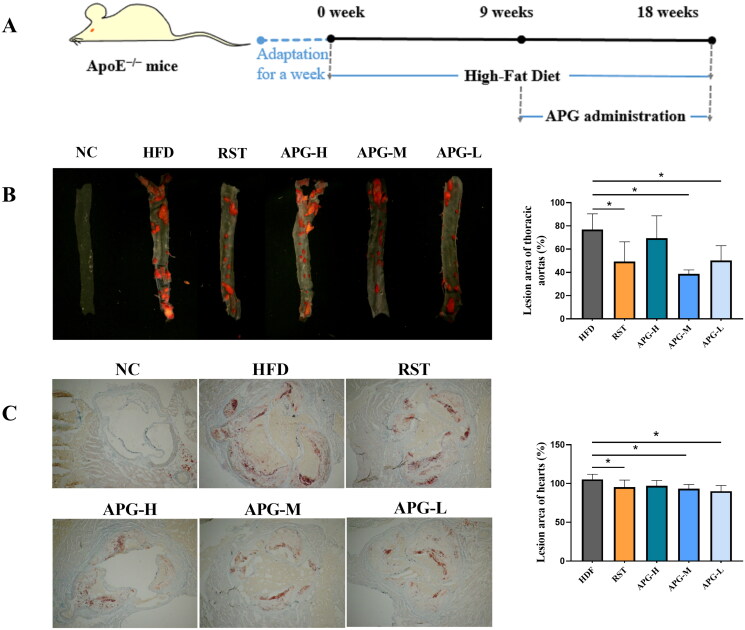
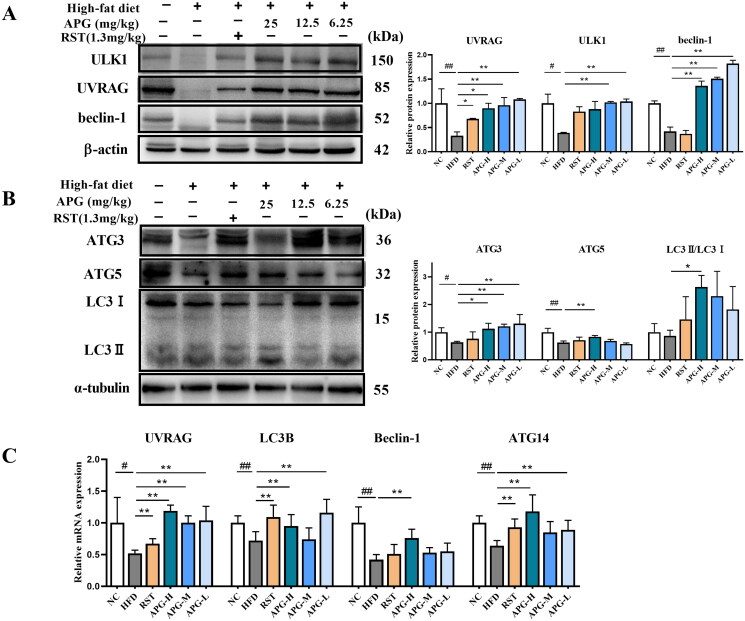
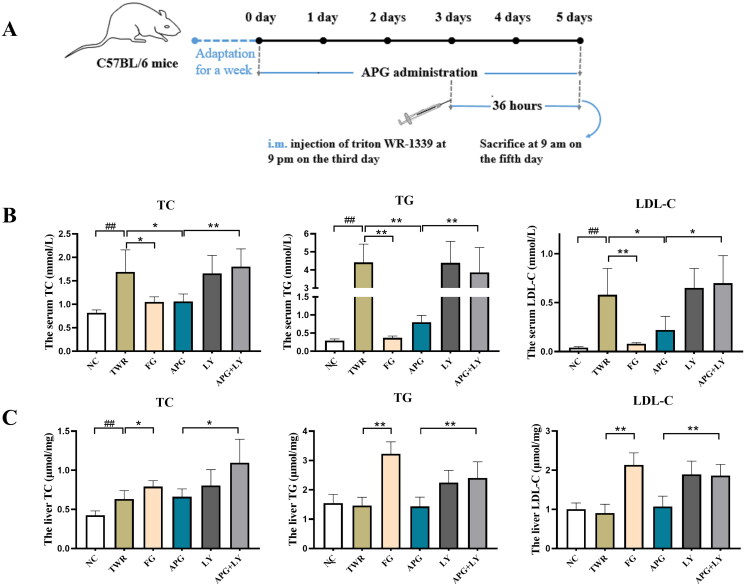
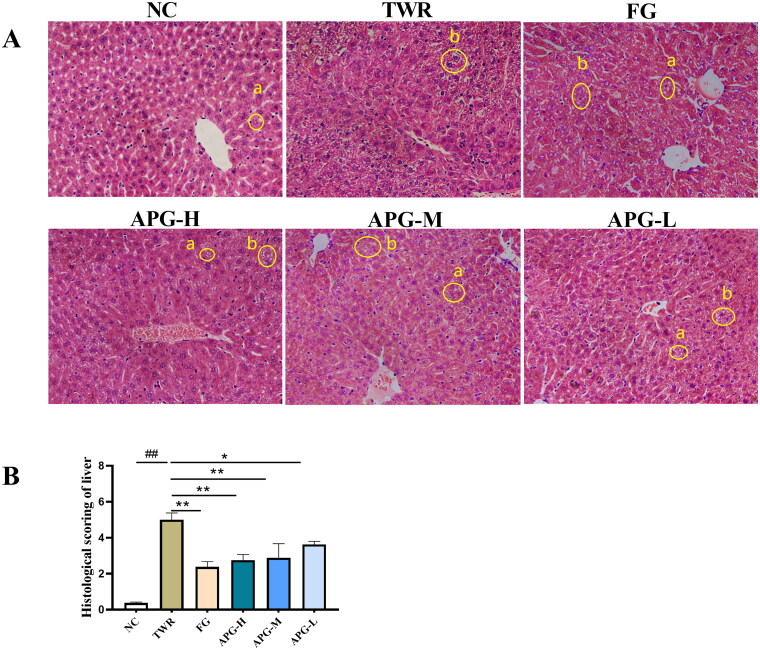
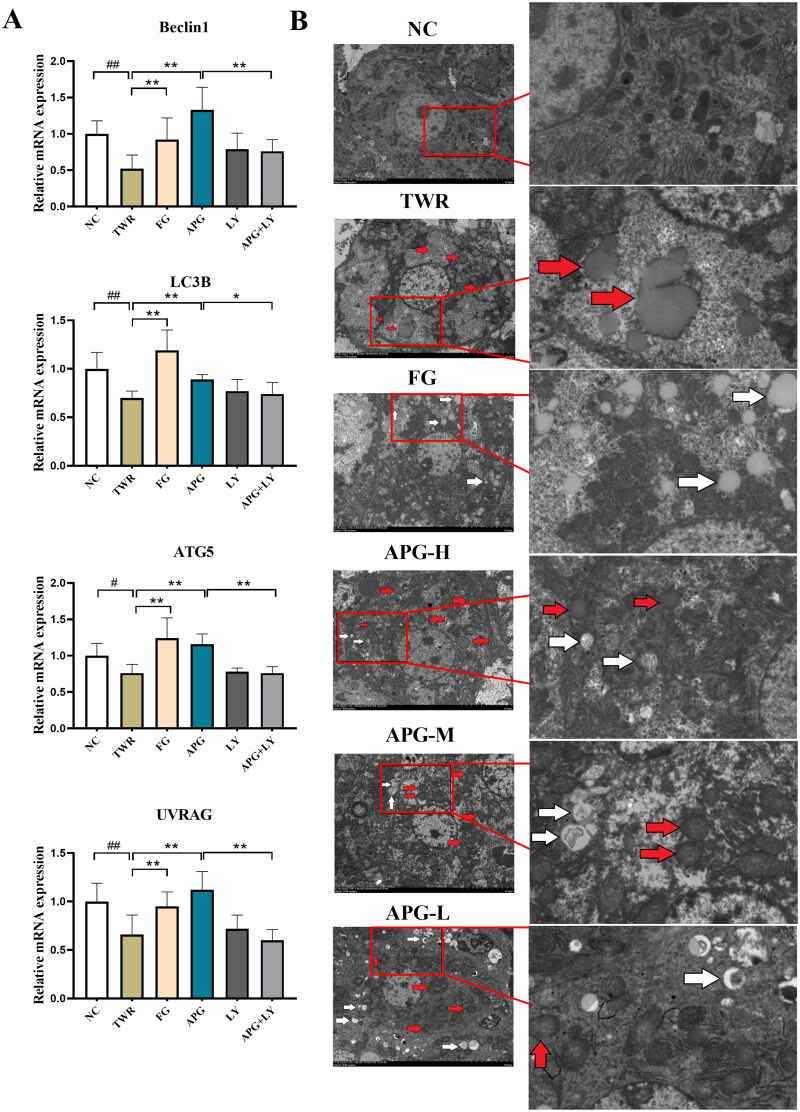
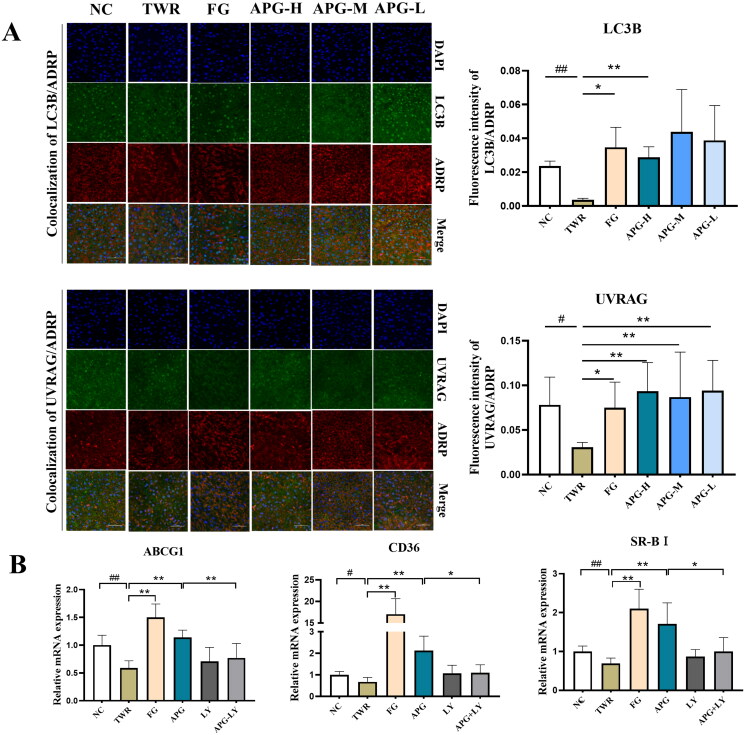
Materials and methods: ApoE-/- mice fed with a high-fat diet (HFD) for 18 weeks were used to establish atherosclerosis model. Oil-Red-O staining of the plaques in the aorta and the heart was used to determine the severity of atherosclerosis. The autophagy flux was evaluated by western blot and reverse transcription quantitative PCR (RT-qPCR). Then triton WR-1339 (TWR) was injected into muscles of C57BL/6 mice, and the role of autophagy was assessed by autophagy inhibitor LY294002 intervention. The transmission electron microscopy (TEM) and immunofluorescence microscopy analysis (IFM) were used to elucidate the lipid-lowering mechanism of apigenin.
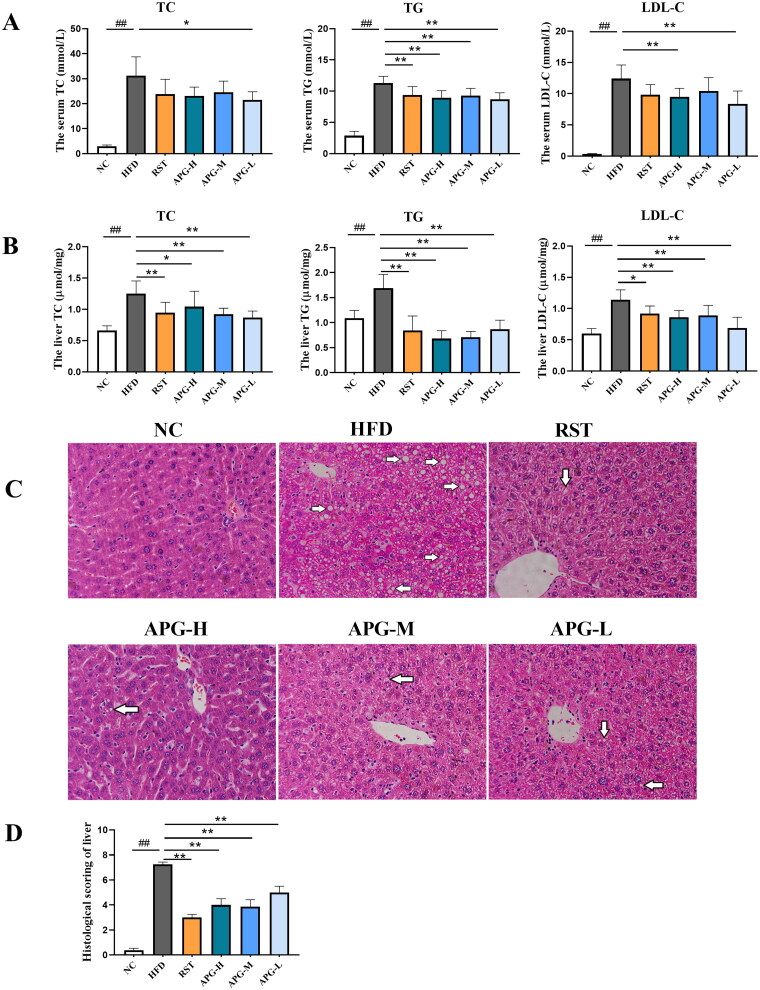
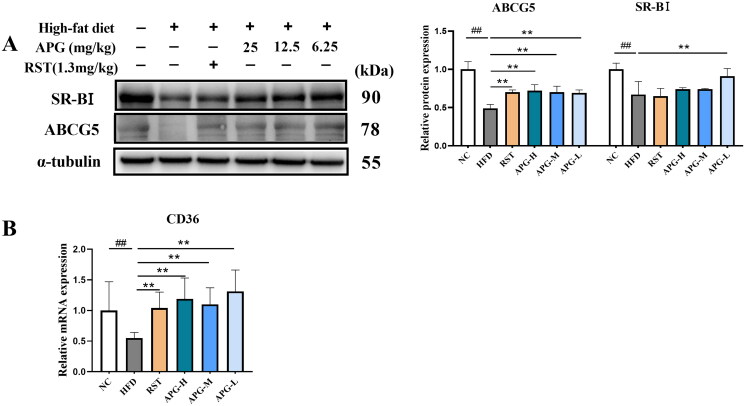
Results: In HFD-induced mice, apigenin inhibited the dangerous progression of atherosclerosis through decreasing lipid deposition in plaques, lowering serum and liver lipid contents, activating autophagy and promoting reverse cholesterol transport (RCT). In TWR-induced mice, apigenin reduced the serum and liver lipid levels, enhanced the autophagy flux and increased RCT, but the above effects of apigenin were weakened by LY294002. The TEM and IFM images revealed that apigenin promoted the formation of autophagosomes and the co-localization between autophagy proteins with lipid protein.
Discussion and conclusions: The lipid-lowering effects of apigenin were mediated through promoting RCT and enhancing selective lipophagy, meanwhile it provided a potential therapeutic option for atherosclerosis.
Keywords: Apigenin; dyslipidemia in atherosclerosis; reverse cholesterol transport; selective autophagy/lipophagy.
Conflict of interest statement
No potential conflict of interest was reported by the author(s).
Figures
Similar articles
-
Gualou-Xiebai herb pair and its active ingredients act against atherosclerosis by suppressing VSMC-derived foam cell formation via regulating P2RY12-mediated lipophagy.Phytomedicine. 2024 Jun;128:155341. doi: 10.1016/j.phymed.2024.155341. Epub 2024 Jan 7. Phytomedicine. 2024. PMID: 38518636
-
Tianxiangdan suppresses foam cell formation by enhancing lipophagy and reduces the progression of atherosclerosis.In Vitro Cell Dev Biol Anim. 2025 Mar;61(3):298-310. doi: 10.1007/s11626-024-01004-z. Epub 2025 Jan 14. In Vitro Cell Dev Biol Anim. 2025. PMID: 39808371
-
Fargesin alleviates atherosclerosis by promoting reverse cholesterol transport and reducing inflammatory response.Biochim Biophys Acta Mol Cell Biol Lipids. 2020 May;1865(5):158633. doi: 10.1016/j.bbalip.2020.158633. Epub 2020 Jan 25. Biochim Biophys Acta Mol Cell Biol Lipids. 2020. PMID: 31988050
-
Polydatin protects against atherosclerosis by activating autophagy and inhibiting pyroptosis mediated by the NLRP3 inflammasome.J Ethnopharmacol. 2023 Jun 12;309:116304. doi: 10.1016/j.jep.2023.116304. Epub 2023 Mar 2. J Ethnopharmacol. 2023. PMID: 36870461
-
Edgeworthia gardneri (Wall.) Meisn protects against HFD-induced murine atherosclerosis through improving gut microbiota-mediated intestinal barrier integrity.Atherosclerosis. 2025 Apr;403:119132. doi: 10.1016/j.atherosclerosis.2025.119132. Epub 2025 Feb 21. Atherosclerosis. 2025. PMID: 40015156
Cited by
-
Research Progress and Prospects of Flavonoids in the Treatment of Hyperlipidemia: A Narrative Review.Molecules. 2025 Jul 24;30(15):3103. doi: 10.3390/molecules30153103. Molecules. 2025. PMID: 40807276 Free PMC article. Review.
References
-
- Bouhlali E, Hmidani A, Bourkhis B, Khouya T, Harnafi H, Filali-Zegzouti Y, Alem C.. 2020. Effect of Phoenix dactylifera seeds (dates) extract in triton WR-1339 and high fat diet induced hyperlipidaemia in rats: a comparison with simvastatin. J Ethnopharmacol. 259:112961. doi:10.1016/j.jep.2020.112961. - DOI - PubMed
-
- Feng X, Yu W, Li X, Zhou F, Zhang W, Shen Q, Li J, Zhang C, Shen P.. 2017. Apigenin, a modulator of PPARgamma, attenuates HFD-induced NAFLD by regulating hepatocyte lipid metabolism and oxidative stress via Nrf2 activation. Biochem Pharmacol. 136:136–149. doi:10.1016/j.bcp.2017.04.014. - DOI - PubMed
MeSH terms
Substances
LinkOut - more resources
Full Text Sources
Medical
Miscellaneous