. 2025 Jun 10;93(6):e0059424.
doi: 10.1128/iai.00594-24. Epub 2025 May 23.

Acquisition of daptomycin resistance in patients results in decreased virulence in Drosophila

Affiliations

Acquisition of daptomycin resistance in patients results in decreased virulence in Drosophila

Brigitte Lamy et al. Infect Immun. .

Abstract

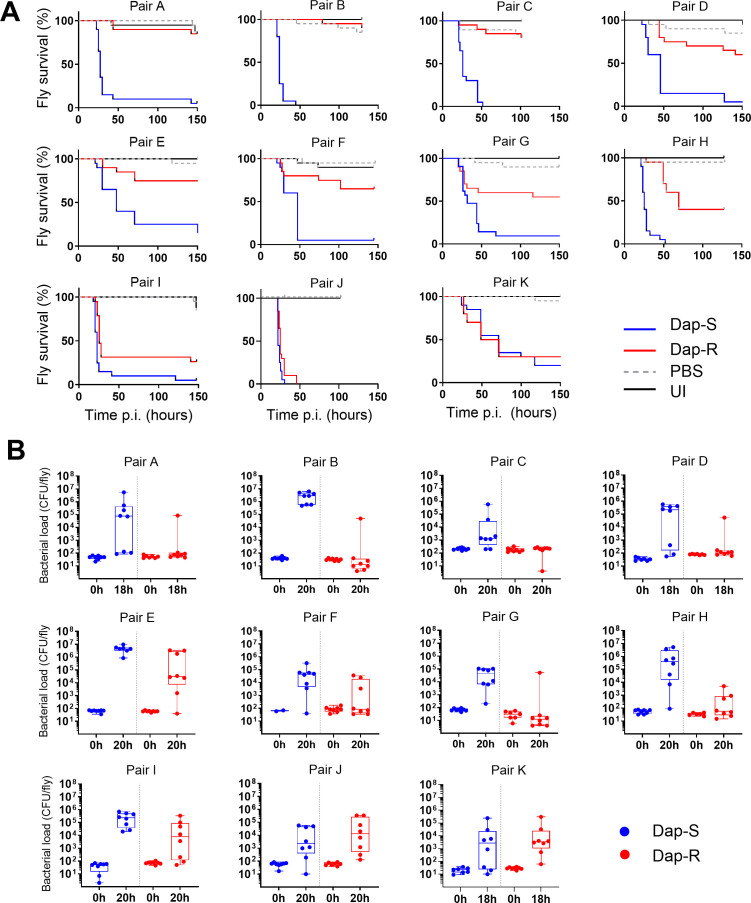
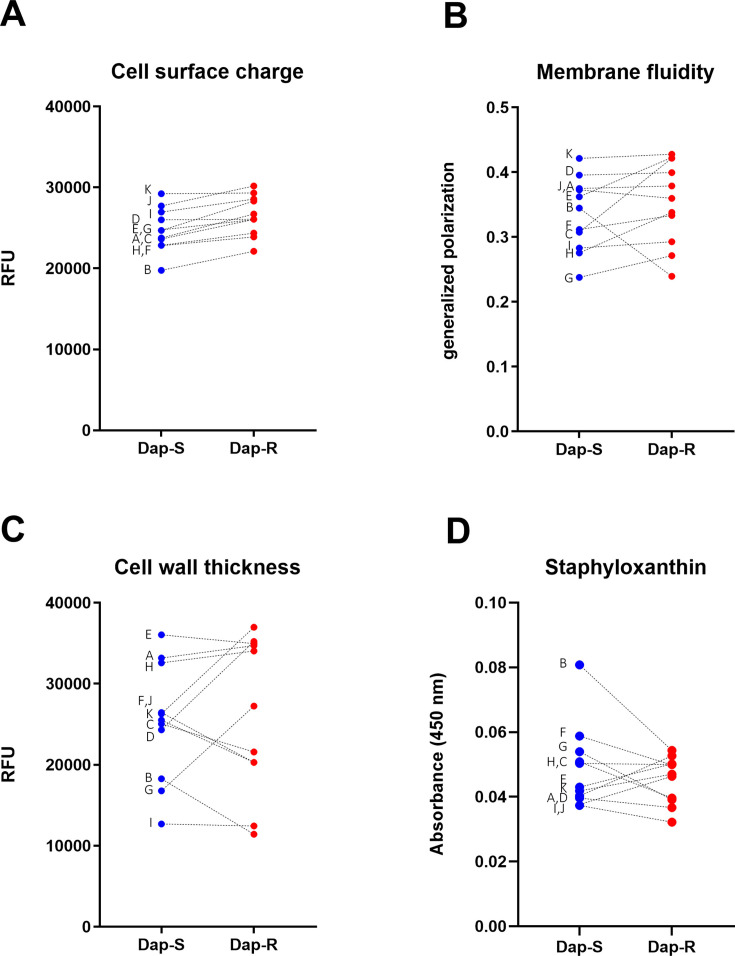
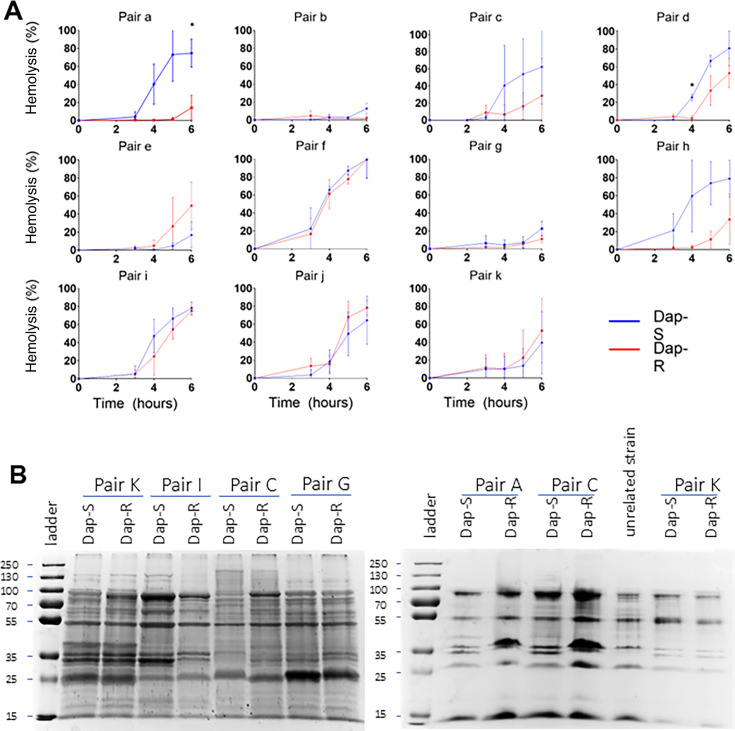
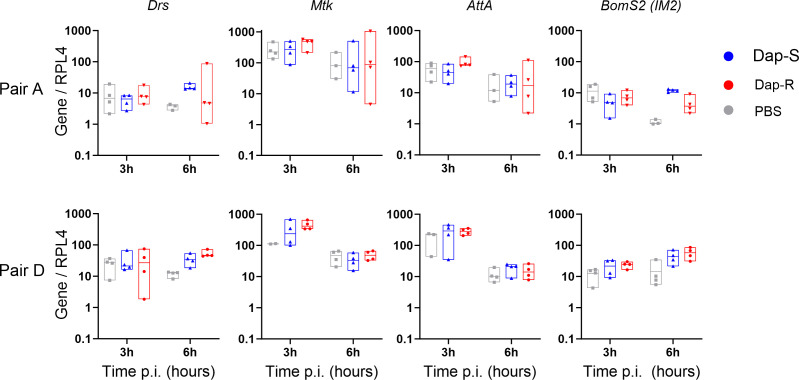
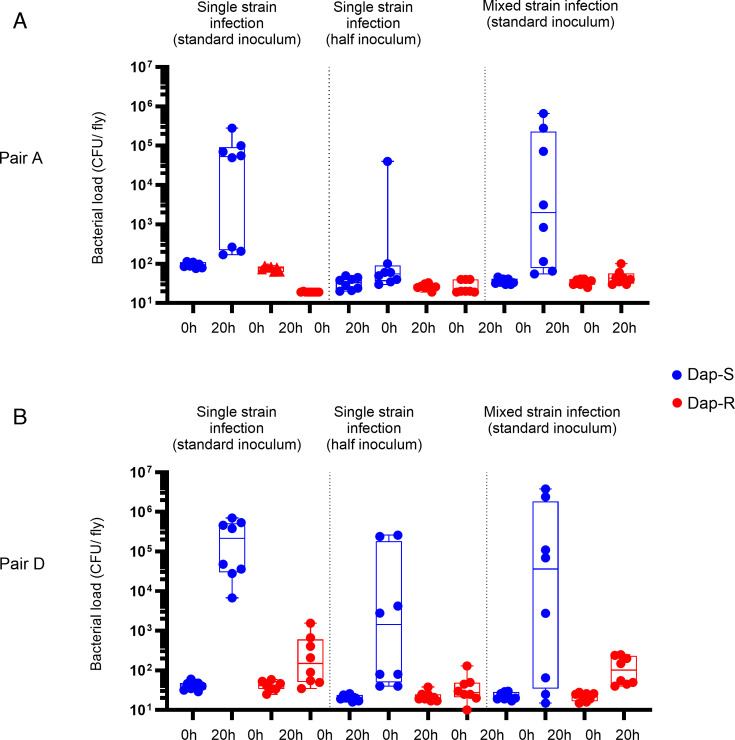
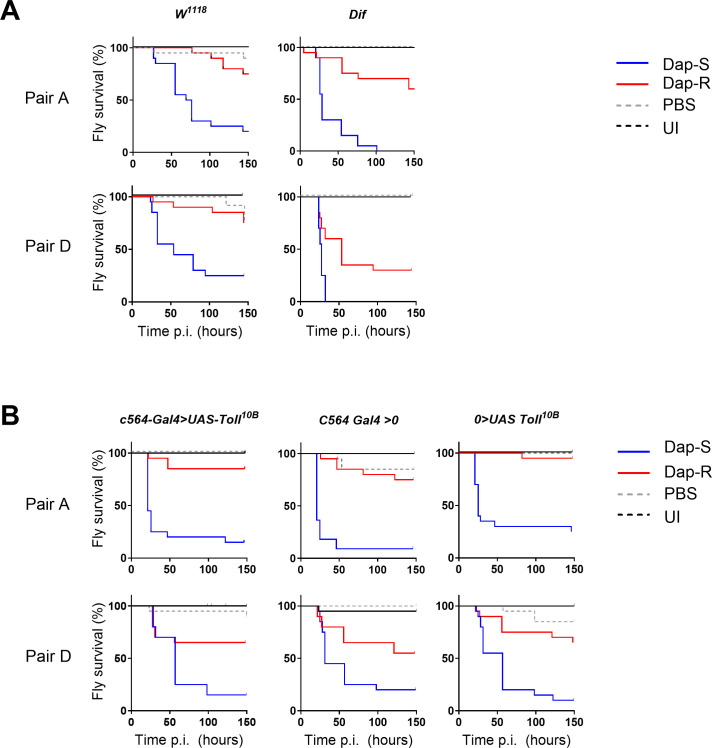
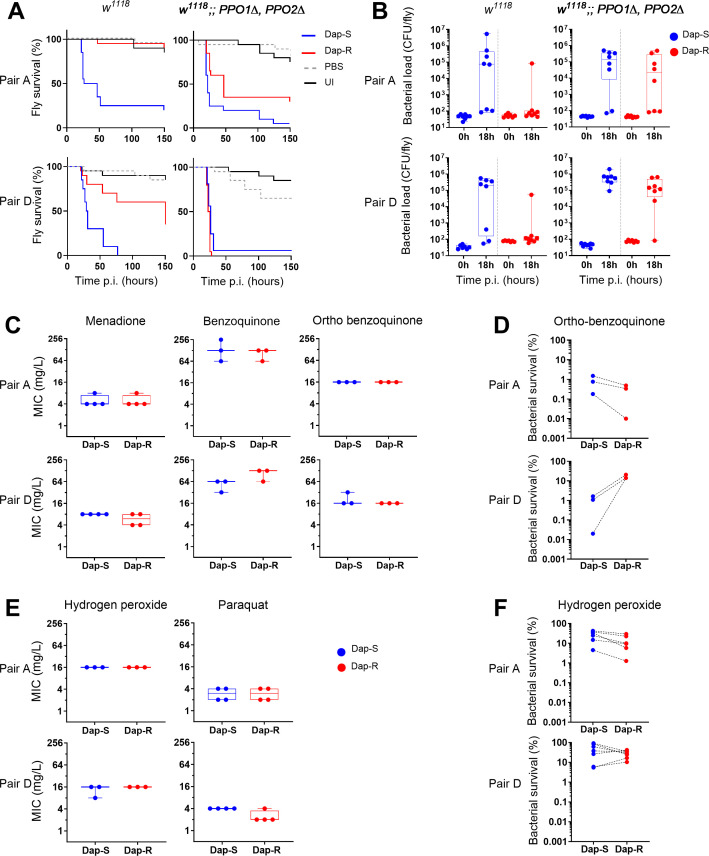
Staphylococcus aureus can acquire antimicrobial resistance, which in turn may affect its pathogenic potential. Using a panel of paired clinical isolates collected before and after daptomycin resistance acquisition, most frequently through a single mprF mutation, we show a relationship between increasing daptomycin minimum inhibitory concentration and reduced virulence in a Drosophila systemic infection model. Analyzing toxin production, in vitro bacterial growth characteristics, and cell surface properties, we failed to link daptomycin resistance-related attenuated virulence to either reduced virulence factor production, reduced fitness, or any of the cell surface characteristics investigated. Competition assays in Drosophila also did not support any altered ability in immune evasion. Instead, using a panel of mutant flies defective for various immune components, we show that this daptomycin resistance-related attenuated virulence is mostly explained by greater susceptibility to the activity of Drosophila prophenoloxidase, a tyrosinase involved in melanization, but not to antimicrobial peptides or Bomanin antimicrobial effectors. Further investigation could not link daptomycin resistance-related attenuation of virulence to differential susceptibility to reactive oxygen species or quinones prominently associated with phenoloxidase bacterial-killing activity. Taken together, it appears that daptomycin resistance attenuates Staphylococcus aureus virulence through enhanced sensitivity to phenoloxidase based on a complex mechanism. Our study provides new insights into the understanding of the crosstalk between antimicrobial resistance, escape from immune killing, and virulence.IMPORTANCEThis study advances current knowledge in the field of host-microbe interactions and antimicrobial resistance by exploring crosstalk between antimicrobial resistance and virulence. It shows how acquiring antimicrobial resistance can alter bacterial virulence and helps shape virulence. Relative to the parental staphylococcal strain, daptomycin-resistant clinical isolates most often varied by one single mutation in a gene involved in the composition of the bacterial membrane, and these strains were much less virulent when fruit flies were infected. The difference in virulence is unrelated to changes in bacterial toxin production, bacterial growth, immune evasion, or cell surface properties. Instead, resistant strains were more vulnerable to a host proenzyme involved in the antibacterial melanization response, an important response deployed throughout the arthropods. We predict that daptomycin resistance forces staphylococci to alter the composition of their cell surface, which causes the bacteria to become more vulnerable to killing by melanization.

Keywords: Drosophila melanogaster; Staphylococcus aureus; antimicrobial peptides; antimicrobial resistance; daptomycin; host-pathogen interaction; link between antimicrobial resistance and virulence; prophenoloxidase; virulence.


Conflict of interest statement

The authors declare no conflict of interest.

Figures

Fig 1
Fig 1
Daptomycin-resistant strains exhibit lower virulence and reduced growth in the fly relative to susceptible isolates. (A) Survival of wild-type (w1118) flies infected with Dap-S strain and Dap-R paired isolate. Each graph corresponds to one experiment with 20 flies per condition and is representative of at least two independent experiments with similar results. P-values were calculated using the log-rank test. P-values for survival differences with Dap-R isolate vs Dap-S paired isolate: pairs A–F and H, P ≤ 0.0001; pair G, P = 0.007; pair I, P = 0.0006; pair J, P = 0.046; pair K, P = 0.636; and PBS and UI, P > 0.05. (B) Strain colony counts at 0 h (input inoculum) and 18–20 h after injection of wild-type (w1118) flies with Dap-S strain and Dap-R paired isolate. Bacterial counts presented correspond to one experiment and are representative of two independent experiments. Boxplots represent the median, percentiles 25 and 75, and whiskers to the minimum and maximum values. P-values for bacterial numbers at 18–20 h post-infection (Dap-R vs Dap-S paired strain) were calculated using the Mann-Whitney test: pair A, P = 0.0104; pair B, P = 0.0002; pair C, P = 0.0342; pair D, P = 0.0779; pair E, P = 0.004; pair F, P = 0.0277; pair G, P = 0.0017; pair H, P = 0.0011; pair I, P = 0.0207; pair J, P = 0.36; and pair K, P = 0.64. Dap-S, daptomycin susceptible; Dap-R, daptomycin resistant; and UI, uninjected flies.
Fig 2
Fig 2
Cell surface properties do not correlate with daptomycin resistance or virulence. Data from three independent experiments. Dashed lines link paired strains; letters indicate pair name. Plots represent mean. Error bars are omitted for clarity. (A) Cell surface charge, P = 0.004, see also Fig. S2 for detailed results; (B) fluidity of cell membrane, P > 0.05, see also Fig. S3 for detailed results; (C) cell wall thickness, P > 0.05, see also Fig. S4 for detailed results; (D) cell surface carotenoid content, P > 0.05, see also Fig. S5 for detailed results. Data were analyzed by a two-tailed paired Student’s t-test. Dap-S, daptomycin susceptible; Dap-R, daptomycin resistant; and RFUs, relative fluorescence units.
Fig 3
Fig 3
Virulence changes are not driven by changes in toxin secretion. (A) Hemolytic activity of culture supernatants from all paired strains. Blood incubated in tryptic soy broth (TSB) as negative control; TSB containing 0.1% Triton X-100 as positive control, considered to represent 100% lysis. Error bars, where shown, represent the standard deviation of the mean. Data were analyzed by a two-way ANOVA with Sidak’s post hoc tests. P-values for the difference in hemolysis activity produced by Dap-S vs Dap-R. P-values < 0.05 are indicated with *. Pair A, P = 0.0375 (6 h); pair D, P = 0.0058 (4 h); all other P-values > 0.05. (B) 10% SDS-PAGE of 10-fold concentrated supernatants from 4 h cultures. All pairs shown on this gel exhibit the same MprF amino acid substitution (L826F). Gel representative of two independent assays. Dap-S, daptomycin susceptible; Dap-R, daptomycin resistant.
Fig 4
Fig 4
AMP genes are expressed at similar levels following infection with daptomycin-resistant and susceptible strains. Host AMP gene expression at 3 and 6 h after fly infection. Assessed AMPs are representative of immune pathways activated by bacterial infection. Expression levels of AMPs are shown normalized to Rpl4 and then to the mean value for uninjected flies. Boxplots represent the median and percentiles 25 and 75. Data were analyzed by ANOVA followed by Tukey’s post hoc test for multiple comparisons. Drs, pair A, 3 h: P > 0.05 for all comparisons; 6 h: P > 0.05 for all comparisons; pair D, 3 h: P > 0.05 for all comparisons; 6 h: Dap-S and PBS, P = 0.0523; Dap-R and PBS, P = 0.024; Dap-S and Dap-R, P > 0.05. Mtk and AttA, 3 and 6 h: P > 0.05 for all comparisons (all pairs). BomS2: pair A, 3 h: P > 0.05 for all comparisons; 6 h: Dap-S and PBS, P = 0.0004; Dap-R and PBS, P > 0.05; Dap-S and Dap-R, P = 0.0032; pair D, 3 h: P > 0.05 for all comparisons; 6 h: Dap-S and PBS, P > 0.05; Dap-R and PBS, P = 0.0341; Dap-S and Dap-R, P > 0.05. Dap-S, daptomycin susceptible; Dap-R, daptomycin resistant.
Fig 5
Fig 5
Daptomycin-susceptible strains do not confer protection on co-infected daptomycin-resistant bacteria. Strain colony counts at 0 h (input inoculum) and 20 h after injection of wild-type (w1118) flies with Dap-S strain, Dap-R paired strain, or Dap-S strain mixed with Dap-R paired strain. The ratio Dap-S:Dap-R in the mixed condition is 1:1; the total inoculum in co-infection experiments is the same as the standard inoculum used in other experiments. Bacterial counts presented correspond to one experiment representative of two independent experiments. Boxplots represent the median, percentiles 25 and 75, and whiskers to the minimum and maximum values. P-values for bacterial numbers at 20 h post-infection (Dap-R vs Dap-S paired strain) were calculated using a Kruskal-Wallis test with Dunn’s post hoc test for multiple comparisons. (A) Pair A, Dap-S/Dap-R co-infection assay. Single-strain infections were performed with an average input inoculum of 92 colony-forming unit (CFU)/fly (Dap-S) and 75 CFU/fly (Dap-R, standard inoculum) and of 26 CFU/fly (Dap-R) and 33 CFU/fly (Dap-S, half inoculum). Mixed strain infections were performed with an average of 36 CFU/fly (Dap-S) and 35 CFU/fly (Dap-R), which resulted in an average total inoculum of 71 CFU/fly. At 20 h, all P-values > 0.05, except: Dap-S vs Dap-R, standard inoculum: P = 0.05; Dap-S, half inoculum vs Dap-R, co-infection: P = 0.045. (B) Pair D, Dap-S/Dap-R co-infection assay. Single-strain infections were performed with an average input inoculum of 42 CFU/fly (Dap-S) and 37 CFU/fly (Dap-R, standard inoculum) and of 20 CFU/fly (Dap-S) and 22 CFU/fly (Dap-R, half inoculum). Mixed strain infections were performed with an average of 23 CFU/fly (Dap-S) and 22 CFU/fly (Dap-R), resulting in an average total inoculum of 45 CFU/fly. At 20 h, all P-values > 0.05, except Dap-S vs Dap-R, standard inoculum: P = 0.004; Dap-S vs Dap-R, half inoculum: P = 0.053; and Dap-S vs Dap-R, co-infection: P = 0.046.
Fig 6
Fig 6
Daptomycin resistance does not increase sensitivity to Toll-dependent antimicrobial effectors. Data presented for two pairs, pair A and pair D. (A) Survival of wild-type (w1118) and Dif-mutant flies infected with Dap-S or Dap-R paired strains. Survival curves presented correspond to one assay representative of at least two independent experiments with similar results. (B) Survival of control (C564-Gal4 > 0 and 0 > UAS-Toll10B) and Toll10b-expressing (C564-Gal4 > UAS-Toll10B) flies infected with Dap-S and Dap-R paired strains. Survival curves correspond to one assay representative of two independent experiments.
Fig 7
Fig 7
Dap-R staphylococcal virulence is affected by prophenoloxidase but cells are not more susceptible to quinones and reactive oxygen species. Data presented for 2 pairs, pair A and pair D. (A) Survival of wild type (w1118) and w1118; PPO1Δ PPO2Δ flies infected with either Dap-S strain or Dap-R paired strain. Survival analysis reveals similar mortality of PPO1Δ PPO2Δ double mutant flies whether infected with Dap-S or Dap-R strains. Survival curves presented correspond to one assay representative of at least two independent experiments with similar results. Survival curves presented correspond to one assay representative of at least two independent experiments with similar results. See also Fig. S7A for other pairs. (B) Bacterial numbers at 0 h (input inoculum) and 18 h after injection of wild type (w1118) or w1118; PPO1Δ PPO2Δ flies with Dap-S strain and Dap-R paired strain. Counts from one assay representative of at least two independent experiments. Bacterial load is similar Dap-R and Dap-S isolates in PPO1Δ PPO2Δ flies (pair A, median bacterial numbers at 18h : in w1118 , Dap-S, 7.6x10⁵ CFU/fly vs Dap-R, 72 CFU/fly; in PPO1Δ PPO2Δ, Dap-S, 1.4 x10⁵ CFU/fly vs Dap-R, 2.1 x10⁴ CFU/fly; Mann-Whitney test, P = 0.0104 (w1118), P = 0.4609 (PPO1Δ PPO2Δ); pair D, median bacterial numbers at 18h in w1118: Dap-S, 2.1 x10⁵ CFU/fly vs Dap-R, 112 CFU/fly; in PPO1Δ PPO2Δ: Dap-S, 6.0 x10⁵ CFU/fly vs Dap-R, 1.3 x10⁵ CFU/fly; Mann-Whitney test, P =0.0779 (w1118), P = 0.0379 (PPO1Δ PPO2Δ). CFU, colony forming unit. (C) Minimum inhibitory concentration of three quinones for Dap-S and Dap-R paired strains of pair A and pair D. No growth difference between Dap-R and Dap-S paired strains in presence of any of three tested quinones (menadione, benzoquinone, ortho-benzoquinone) (two-tailed paired Student’s t-test except for pair A/orthobenzoquinone, (Mann-Whitney test), P > 0.05 for all pairs). (D) In vitro survival of Dap-S and Dap-R paired strain of two pairs exposed to ortho-benzoquinone (16 mg/L) for 1 h, as determined by CFU counts. Two-tailed paired Student’s t-test, ortho-benzoquinone: pair A, P = 0.1665; pair D, P = 0.0144. (E) Minimum inhibitory concentration of two reactive oxygen species (ROS) for Dap-S and Dap-R paired strains of pair A and pair D. No growth difference between Dap-R and Dap-S paired strains in presence of any of two reactive oxygen species (hydrogen peroxide, paraquat) (two-tailed paired Student’s t-test except for pair A/ hydrogen peroxide and paraquat (Mann-Whitney test), P > 0.05 for all pairs). (F) In vitro survival of Dap-S and Dap-R paired strain of two pairs exposed to hydrogen peroxide (4 mM) for 1 h, as determined by CFU counts. Two-tailed paired Student’s t-test, hydrogen peroxide: pair A, P = 0.0127; pair D, P = 0.1947.

Similar articles

References

    1. Hindy J-R, Quintero-Martinez JA, Lee AT, Scott CG, Gerberi DJ, Mahmood M, DeSimone DC, Baddour LM. 2022. Incidence trends and epidemiology of Staphylococcus aureus bacteremia: a systematic review of population-based studies. Cureus 14:e25460. doi: 10.7759/cureus.25460 - DOI - PMC - PubMed
    1. Bai AD, Lo CKL, Komorowski AS, Suresh M, Guo K, Garg A, Tandon P, Senecal J, Del Corpo O, Stefanova I, Fogarty C, Butler-Laporte G, McDonald EG, Cheng MP, Morris AM, Loeb M, Lee TC. 2022. Staphylococcus aureus bacteraemia mortality: a systematic review and meta-analysis. Clin Microbiol Infect 28:1076–1084. doi: 10.1016/j.cmi.2022.03.015 - DOI - PubMed
    1. Le Moing V, Alla F, Doco-Lecompte T, Delahaye F, Piroth L, Chirouze C, Tattevin P, Lavigne J-P, Erpelding M-L, Hoen B, Vandenesch F, Duval X, VIRSTA study group . 2015. Staphylococcus aureus bloodstream infection and endocarditis - a prospective cohort study. PLoS One 10:e0127385. doi: 10.1371/journal.pone.0127385 - DOI - PMC - PubMed
    1. Habib G, Lancellotti P, Antunes MJ, Bongiorni MG, Casalta J-P, Del Zotti F, Dulgheru R, El Khoury G, Erba PA, Iung B, Miro JM, Mulder BJ, Plonska-Gosciniak E, Price S, Roos-Hesselink J, Snygg-Martin U, Thuny F, Tornos Mas P, Vilacosta I, Zamorano JL, ESC Scientific Document Group . 2015. 2015 ESC guidelines for the management of infective endocarditis: the task force for the management of infective endocarditis of the European Society of Cardiology (ESC)Endorsed by: European Association for Cardio-Thoracic Surgery (EACTS), the European Association of Nuclear Medicine (EANM). Eur Heart J 36:3075–3128. doi: 10.1093/eurheartj/ehv319 - DOI - PubMed
    1. Tabah A, Laupland KB. 2022. Update on Staphylococcus aureus bacteraemia. Curr Opin Crit Care 28:495–504. doi: 10.1097/MCC.0000000000000974 - DOI - PubMed

MeSH terms

LinkOut - more resources