. 2025 Jun 11;16(6):e0126925.
doi: 10.1128/mbio.01269-25. Epub 2025 May 23.

GSNOR plays roles in growth, pathogenicity, and stress resistance by modulating mitochondrial protein COX6B S-nitrosylation in Colletotrichum gloeosporioides

Affiliations

GSNOR plays roles in growth, pathogenicity, and stress resistance by modulating mitochondrial protein COX6B S-nitrosylation in Colletotrichum gloeosporioides

Xing Yang et al. mBio. .

Abstract

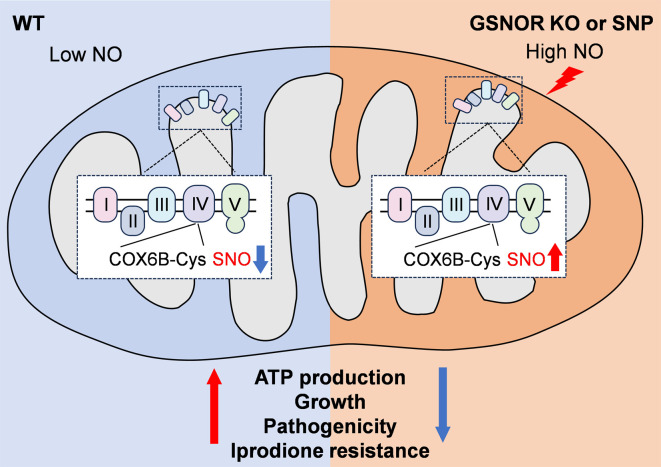
Nitric oxide (NO) serves as a versatile signaling molecule governing diverse biological processes, primarily through post-translational modifications such as S-nitrosylation. The enzyme glutathione S-nitrosoglutathione reductase (GSNOR) plays a central role in NO homeostasis by modulating cellular levels of S-nitrosoglutathione (GSNO), thereby controlling protein S-nitrosylation dynamics. However, the functional significance of GSNOR in fungal pathogenicity remains insufficiently characterized. In this study, we investigated the function of CgGSNOR in the phytopathogenic fungus Colletotrichum gloeosporioides. Deletion of CgGSNOR disrupted nitrosative homeostasis, leading to elevated NO accumulation, increased protein S-nitrosylation levels, and mitochondrial dysfunction as evidenced by reduced ATP production and altered ROS levels. Proteomic and structural analyses identified cytochrome c oxidase subunit 6B (CgCOX6B) as a key target of S-nitrosylation. Functional characterization revealed that CgCOX6B is essential for appressorial turgor maintenance and fungal pathogenicity. Site-directed mutagenesis demonstrated that three conserved cysteine residues (Cys42, Cys62, and Cys73) are critical for CgCOX6B function and are susceptible to S-nitrosylation-induced disruption. Notably, the CgCOX6B knockout strain exhibited increased sensitivity to Iprodione, a widely used fungicide, and this sensitivity was further amplified by NO donor treatment. Together, our findings uncover a GSNOR-dependent redox regulatory axis that links NO signaling, mitochondrial function, and fungal pathogenicity, offering potential targets for antifungal strategies via manipulation of NO signaling networks.IMPORTANCEColletotrichum gloeosporioides is a globally significant fungal pathogen responsible for anthracnose diseases, causing losses across a wide range of crops. Although nitric oxide (NO) signaling and its post-translational regulatory mechanism, S-nitrosylation, are known to play pivotal roles in fungal biology, their specific contributions to pathogenicity remain poorly characterized. This study identifies glutathione S-nitrosoglutathione reductase (GSNOR) as a critical regulator of NO homeostasis in C. gloeosporioides and demonstrates its critical role in regulating fungal growth, conidiation, and pathogenicity. We uncover cytochrome c oxidase subunit 6B (COX6B) as a key target of S-nitrosylation, required for fungal energy metabolism, host infection, and resistance to fungicides. Furthermore, we reveal that exogenous NO supplementation using sodium nitroprusside synergistically enhances the antifungal activity of Iprodione. These findings advance our understanding of redox regulation in fungal pathogenesis and highlight GSNOR and COX6B as promising molecular targets for developing antifungal approaches to reduce crop losses.

Keywords: Colletotrichum gloeosporioides; S-nitrosylation; cytochrome c oxidase subunit 6B (COX6B); fungal pathogenicity; glutathione S-nitrosoglutathione reductase (GSNOR).


Conflict of interest statement

The authors declare no conflict of interest.

Figures

Fig 1
Fig 1
Phenotypic analyses of the CgGSNOR mutant strains. (A) Colony morphology of wild-type (WT), ΔCgGSNOR, and Res-ΔCgGSNOR strains grown on PDA and MM plates after 5 d of incubation. (B) Colony diameter of WT, ΔCgGSNOR, and Res-ΔCgGSNOR strains on PDA and MM plates. (C) Conidiation of WT, ΔCgGSNOR, and Res-ΔCgGSNOR in liquid complete medium. (D) Microscopic images of conidia from WT, ΔCgGSNOR, and Res-ΔCgGSNOR. Scale bar = 20 µm. (E) Conidia length-to-width ratio for WT, ΔCgGSNOR, and Res-ΔCgGSNOR. (F) Germ tube length of WT, ΔCgGSNOR, and Res-ΔCgGSNOR strains after incubation for 4 h. Bars represent the mean ± standard deviation from three independent replicates. Different letters above bars indicate statistically significant differences (P < 0.05).
Fig 2
Fig 2
Pathogenicity assay and appressorium formation of WT, ΔCgGSNOR, and Res-ΔCgGSNOR strains. (A) Pathogenicity assessment of the WT, ΔCgGSNOR, and Res-ΔCgGSNOR strains on intact and pre-wounded rubber tree leaves. The disease symptoms were recorded at 3 d post-inoculation. The bar charts show the disease incidence and lesion diameters. (B) Appressorium formation of the mutant strains on artificial hydrophobic surfaces at 12 and 24 h post-inoculation. Scale bars = 20 µm. The bar chart shows the appressorium formation percentages. (C) Penetration assay on onion epidermis at 24 h post-inoculation. Germ tube (GT) and invasive hyphae (IH) are marked with arrows. Scale bars = 20 µm. The bar chart shows the IH formation percentage. Bars represent the mean ± standard deviation from three independent replicates. Different letters above bars indicate statistically significant differences (P < 0.05).
Fig 3
Fig 3
Detection of nitric oxide (NO) accumulation, superoxide (O2⁻) levels, and ATP production. (A) Detection of NO levels in WT and ΔCgGSNOR strains using the NO-sensitive fluorescent probe DAF-FM DA. BF: bright field. Scale bars = 20 µm. (B) Quantification of DAF-FM DA fluorescence intensity. (C) Detection of O2⁻ using DHE staining and co-localization with mitochondria using Tom20-GFP expression strains. (D) Quantification of DHE and TOM20-GFP fluorescence intensities. (E) Relative ATP content in WT and ΔCgGSNOR strains measured using a luciferase-based ATP assay kit. Relative fluorescence intensity was calculated with ImageJ. Bars represent the mean ± standard deviation from three independent samples, and each sample contains at least 20 hyphae. Asterisks indicate significant differences (*P < 0.05, **P < 0.01; ns, not significant).
Fig 4
Fig 4
Analysis of nitric oxide (NO) effect on appressorium development, turgor maintenance, and protein S-nitrosylation. (A) Appressorium formation assay in WT and ΔCgGSNOR strains treated with the NO donor sodium nitroprusside (SNP) or the NO scavenger Carboxy-PTIO (cPTIO). Red arrows indicate abnormal appressoria. The bar chart shows the appressorium formation percentages. (B) Turgor pressure maintenance of WT appressoria in the presence of 40% and 50% PEG8000, with or without SNP treatment. The normal and collapsed appressoria are indicated with blue and red arrows, respectively. Zoomed-in images show representative examples of normal versus collapsed appressoria. The bar chart shows the percentage of collapsed appressoria. Bars represent the mean ± standard deviation from three independent samples. Different letters indicate statistically significant differences (P < 0.05), and asterisks indicate significant differences (*P < 0.05, **P < 0.01; ns, not significant). (C) Western blot analysis of protein S-nitrosylation (SNO) in WT and ΔCgGSNOR strains treated with SNP or cPTIO. Protein loading was confirmed using Coomassie Brilliant Blue (CBB) staining.
Fig 5
Fig 5
Proteomic analysis of S-nitrosylated mitochondrial proteins in C. gloeosporioides strains. (A) Western blot analysis of mitochondrial protein S-nitrosylation (SNO) in WT and ΔCgGSNOR strains under untreated and sodium nitroprusside (SNP)-treated conditions. Protein loading was confirmed using Coomassie Brilliant Blue (CBB) staining. (B) Volcano plot of the proteomic analysis showing the differential regulation of S-nitrosylated proteins between ΔCgGSNOR and WT strains. (C) Heatmap showing the relative level of S-nitrosylation of the different regulated mitochondrial proteins.
Fig 6
Fig 6
Pathogenicity, appressorium formation, and penetration ability of the ΔCgCOX6B mutant. (A) Pathogenicity assays on intact and wounded rubber tree leaves and apple fruit inoculated with the WT and ΔCgCOX6B strains. The bar charts show the lesion diameters on leaves at 3 d post-inoculation and lesion diameters on apple fruits at 3 and 5 d post-inoculation. (B) Appressorium formation of the WT and ΔCgCOX6B strains on polyester surfaces at 12 h post-inoculation. The bar chart shows the appressorium formation percentages. (C) Turgor pressure maintenance of appressoria in the presence of 50% PEG8000. The normal and collapsed appressoria are indicated with white and red arrows, respectively. The bar chart shows the percentage of collapsed appressoria under treatment with 50% PEG8000. (D) Penetration assay on cellophane. After 3 d of incubation, the colonies along with the cellophane were removed from the PDA plates, and the plates were incubated for another 3 d. (E) Mitochondrial superoxide (O2⁻) levels and ATP content were assessed in WT, ΔCgGSNOR, and ΔCgCOX6B strains. Superoxide levels were measured using DHE staining, and ATP content was visualized by a fluorescent ATP probe ATP-RED 1. Scale bars = 20 µm. Bars represent the mean ± standard deviation from three independent samples. Different letters indicate statistically significant differences (P < 0.05), and asterisks indicate significant differences (*P < 0.05, **P < 0.01; ns, not significant).
Fig 7
Fig 7
Structural modeling and conformational impact of S-nitrosylation on key cysteine residues in CgCOX6B. (A) Predicted 3D structure of CgCOX6B showing the positions of four conserved cysteine residues: Cys32, Cys42, Cys62, and Cys73, highlighted in different colors. (B) Solvent-accessible surface area (SASA) of wild-type CgCOX6B and three S-nitrosylated variants (C42SNC, C62SNC, and C73SNC). (C) Structural alignment of wild-type and three S-nitrosylated variants of CgCOX6B. Root mean square deviation (RMSD) values are shown for each variant.
Fig 8
Fig 8
Functional analysis of cysteine residues in CgCOX6B. (A) Colony growth of the WT, ΔCgCOX6B, and cysteine site mutants, CgCOX6BC42S, CgCOX6BC62S, and CgCOX6BC73S, on PDA plates. The bar chart shows colony diameter after incubation for 5 d. (B) Pathogenicity assays on apple fruit. The bar charts show lesion diameters on apple fruits at 3 and 5 d post-inoculation. (C) Appressorium formation on polyester surfaces at 12 h post-inoculation. Scale bars = 20 µm. The bar chart shows the appressorium formation percentages. (D) Turgor pressure assessment of appressoria in the presence of 50% PEG8000. Scale bars = 20 µm. The bar chart shows the percentage of collapsed appressoria. Bars represent the mean ± standard deviation from three independent replicates. Different letters above bars indicate statistically significant differences (P < 0.05).
Fig 9
Fig 9
Role of CgCOX6B in stress resistance and synergistic effects of SNP and Iprodione. (A) Colony growth sensitivity of WT, ΔCgGSNOR, and ΔCgCOX6B strains under chemical stresses. The bar chart shows the sensitivity percentages for each strain. Different letters indicate statistically significant differences (P < 0.05). (B) Dose-dependent effects of sodium nitroprusside (SNP) on C. gloeosporioides colony growth when applied alone or in combination with Iprodione. The line chart illustrates the sensitivity to SNP alone or SNP in combination with Iprodione. The green line serves as a reference, representing the additive effect of SNP alone plus 14% inhibition by Iprodione. The black arrows highlight the observed synergistic effects between SNP and Iprodione. Data are presented as mean ± standard deviation from three independent replicates.
Fig 10
Fig 10
CgGSNOR dynamically regulates CgCOX6B S-nitrosylation to maintain mitochondrial homeostasis, growth, pathogenicity, and Iprodione resistance in C. gloeosporioides.

References

    1. Lamattina L, García-Mata C, Graziano M, Pagnussat G. 2003. Nitric oxide: the versatility of an extensive signal molecule. Annu Rev Plant Biol 54:109–136. doi: 10.1146/annurev.arplant.54.031902.134752 - DOI - PubMed
    1. Thomas DD, Ridnour LA, Isenberg JS, Flores-Santana W, Switzer CH, Donzelli S, Hussain P, Vecoli C, Paolocci N, Ambs S, Colton CA, Harris CC, Roberts DD, Wink DA. 2008. The chemical biology of nitric oxide: implications in cellular signaling. Free Radic Biol Med 45:18–31. doi: 10.1016/j.freeradbiomed.2008.03.020 - DOI - PMC - PubMed
    1. Radi R. 2018. Oxygen radicals, nitric oxide, and peroxynitrite: redox pathways in molecular medicine. Proc Natl Acad Sci USA 115:5839–5848. doi: 10.1073/pnas.1804932115 - DOI - PMC - PubMed
    1. Zorov DB, Juhaszova M, Sollott SJ. 2014. Mitochondrial reactive oxygen species (ROS) and ROS-induced ROS release. Physiol Rev 94:909–950. doi: 10.1152/physrev.00026.2013 - DOI - PMC - PubMed
    1. Scheler C, Durner J, Astier J. 2013. Nitric oxide and reactive oxygen species in plant biotic interactions. Curr Opin Plant Biol 16:534–539. doi: 10.1016/j.pbi.2013.06.020 - DOI - PubMed

MeSH terms

Supplementary concepts