

Test-Retest Reliability of Cervical Strength Testing Protocols with Handheld Dynamometer in Prepubertal and Pubertal Untrained Boys
- PMID: 40407457
- PMCID: PMC12101338
- DOI: 10.3390/jfmk10020173
Test-Retest Reliability of Cervical Strength Testing Protocols with Handheld Dynamometer in Prepubertal and Pubertal Untrained Boys
Abstract
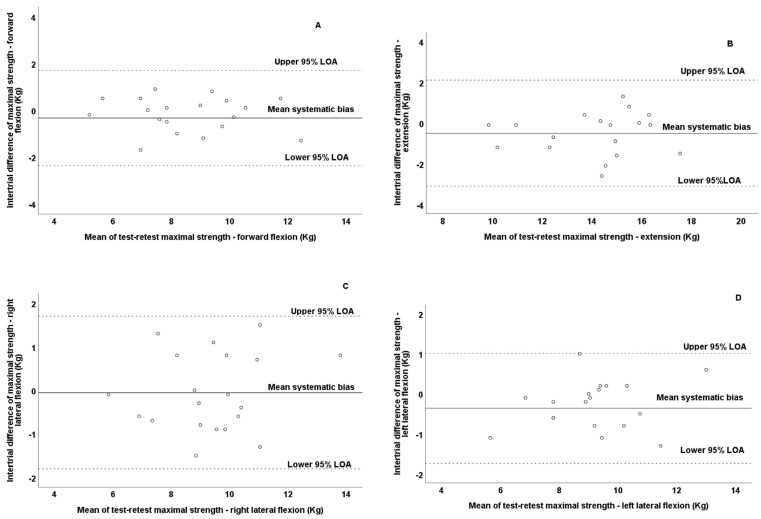
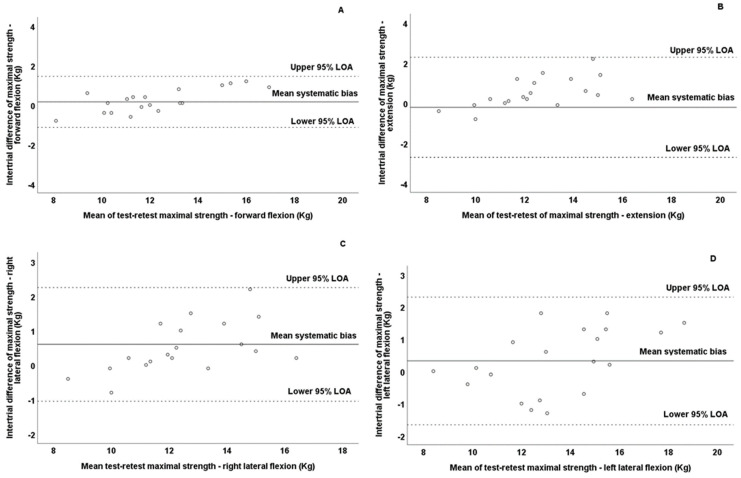
Background: The cervical spine plays an important role in several daily activities of children and adolescents, and thus, its evaluation using reliable protocols is of crucial importance. This study examined the test-retest reliability of cervical strength protocols using indices of absolute (standard error of measurement-SEM and 95% limits of agreement-LOA) and relative reliability (intraclass correlation coefficient-ICC). Methods: Twenty prepubertal (9.10 ± 0.61 years old) and twenty pubertal boys (13.6 ± 0.6 years old) participated in two assessment sessions separated by 48 h. During both sessions, maximal isometric strength (forward flexion, extension, and right-left lateral flexion) was assessed using a handheld dynamometer, and then, the cervical flexion-to-extension ratio (cervicalF/E ratio) was calculated. Results: According to our data analysis, good absolute and relative reliability was denoted for prepubertal boys in all cervical movements (ICC = 0.81-0.90; SEM% = 5.82-8.62); conversely, pubertal boys denoted high relative and absolute reliability in all directions of movements (ICC = 0.90-0.96; SEM% = 3.8-5.5). The cervicalF/E ratio showed moderate reliability in prepubertal (ICC = 0.71; SEM% = 9.11) and pubertal boys (ICC = 0.78; SEM% = 7). Conclusions: In conclusion, the isometric strength of cervical muscles, using a handheld dynamometer, showed acceptable reliability in prepubertal and pubertal boys; however, prepubertal boys demonstrated slightly lower reliability. Additionally, the assessment of the cervical F/E ratio should be interpreted with caution. However, it would be important to carry out future studies to strengthen the findings of the present study.
Keywords: developmental years; isometric evaluation; neck; reproducibility.
Conflict of interest statement
The authors declare no conflicts of interest.
Figures


Similar articles
-
Reliability of trunk strength measurements with an isokinetic dynamometer in non-specific low back pain patients: A systematic review.J Back Musculoskelet Rehabil. 2022;35(5):937-948. doi: 10.3233/BMR-210261. J Back Musculoskelet Rehabil. 2022. PMID: 35213350
-
Systemic pharmacological treatments for chronic plaque psoriasis: a network meta-analysis.Cochrane Database Syst Rev. 2017 Dec 22;12(12):CD011535. doi: 10.1002/14651858.CD011535.pub2. Cochrane Database Syst Rev. 2017. Update in: Cochrane Database Syst Rev. 2020 Jan 9;1:CD011535. doi: 10.1002/14651858.CD011535.pub3. PMID: 29271481 Free PMC article. Updated.
-
Systemic pharmacological treatments for chronic plaque psoriasis: a network meta-analysis.Cochrane Database Syst Rev. 2021 Apr 19;4(4):CD011535. doi: 10.1002/14651858.CD011535.pub4. Cochrane Database Syst Rev. 2021. Update in: Cochrane Database Syst Rev. 2022 May 23;5:CD011535. doi: 10.1002/14651858.CD011535.pub5. PMID: 33871055 Free PMC article. Updated.
-
Test-retest reliability and concurrent validity of three different handgrip dynamometers (Jamar, Jamar Plus+ and Biodex) in healthy young adults.Hand Ther. 2025 Jul 5:17589983251352104. doi: 10.1177/17589983251352104. Online ahead of print. Hand Ther. 2025. PMID: 40626051 Free PMC article.
-
Interventions targeted at women to encourage the uptake of cervical screening.Cochrane Database Syst Rev. 2021 Sep 6;9(9):CD002834. doi: 10.1002/14651858.CD002834.pub3. Cochrane Database Syst Rev. 2021. PMID: 34694000 Free PMC article.
Cited by
-
Intrasession and Intersession Reliability of Flexibility Tests During Developmental Years: The Effects of Sport, Age, and Sex.Sports (Basel). 2025 Jul 22;13(8):238. doi: 10.3390/sports13080238. Sports (Basel). 2025. PMID: 40863747 Free PMC article.
References
-
- Mandhwani S., Zia S., Shaikh E.S., Duarte D., Tanveer E. Association between Cell Phone Usage and Musculoskeletal Disorders in School Going Children. J. Musculoskelet. Res. 2022;25:2250003. doi: 10.1142/S0218957722500038. - DOI
LinkOut - more resources
Full Text Sources
