. 2025 Apr 28;13(2):16.
doi: 10.3390/proteomes13020016.

Intrinsic Disorder and Phase Separation Coordinate Exocytosis, Motility, and Chromatin Remodeling in the Human Acrosomal Proteome

Affiliations

Intrinsic Disorder and Phase Separation Coordinate Exocytosis, Motility, and Chromatin Remodeling in the Human Acrosomal Proteome

Shivam Shukla et al. Proteomes. .

Abstract

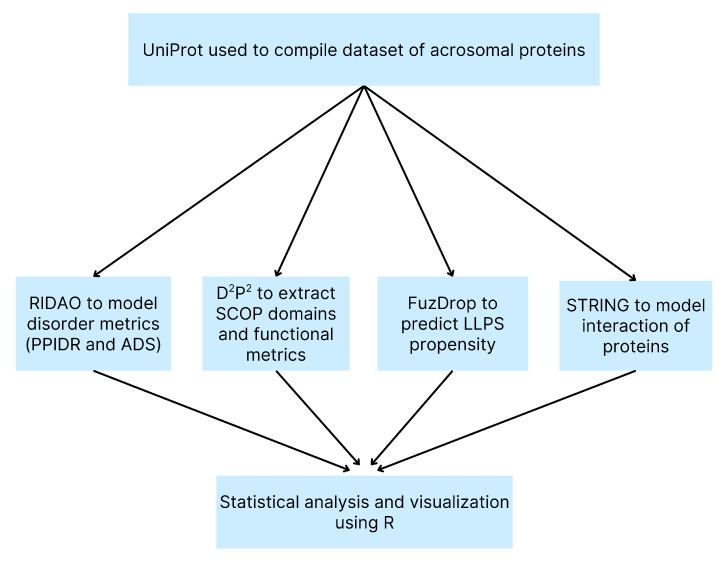
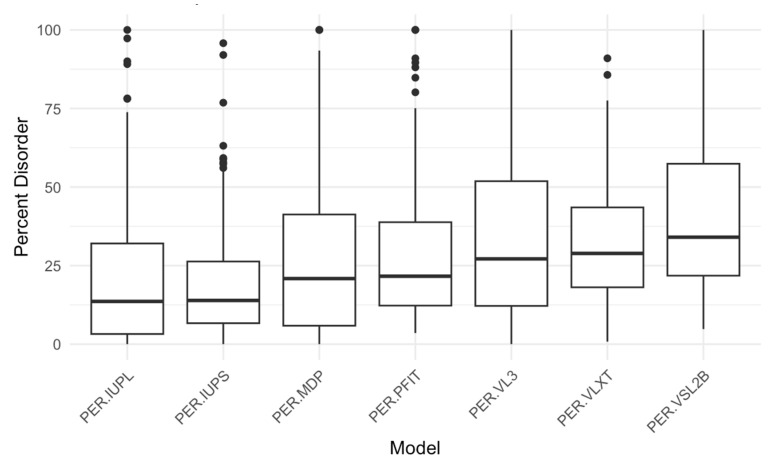
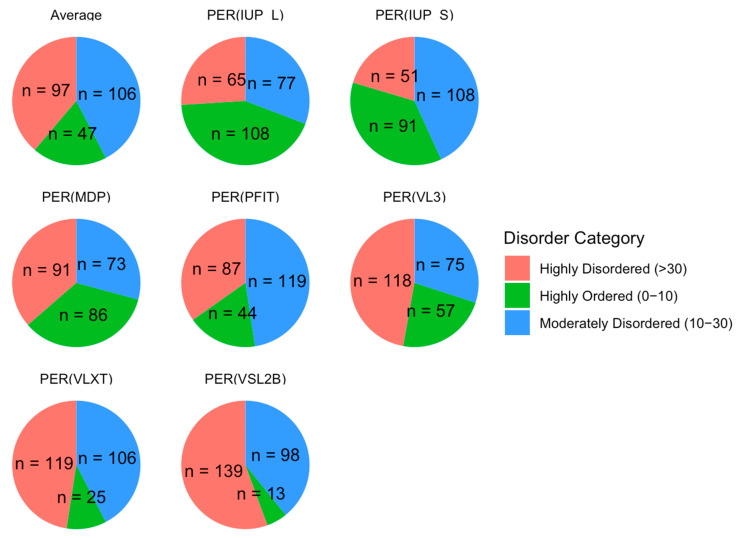
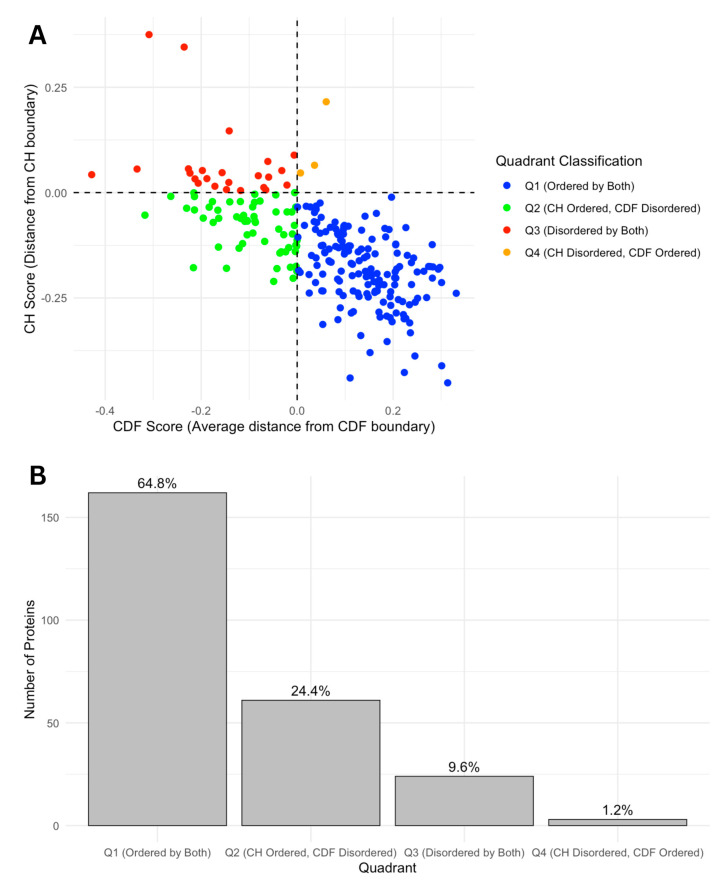
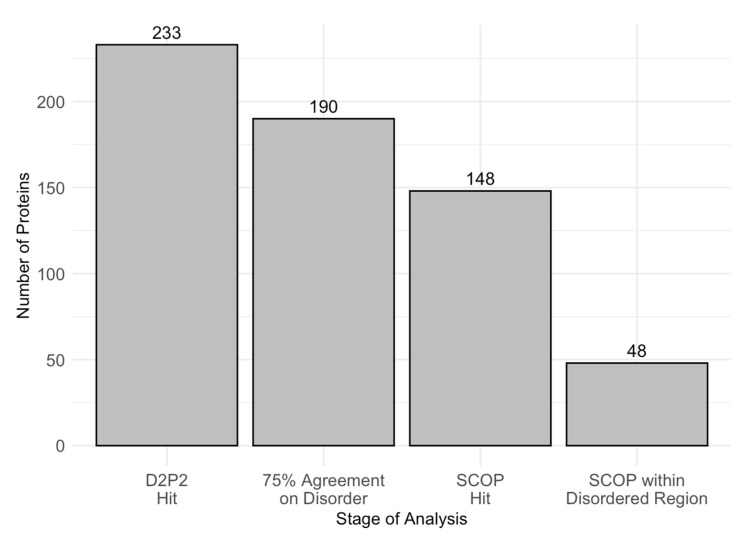
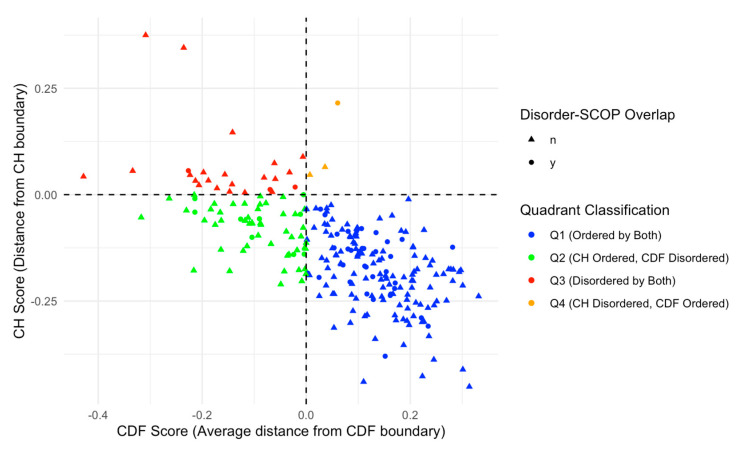
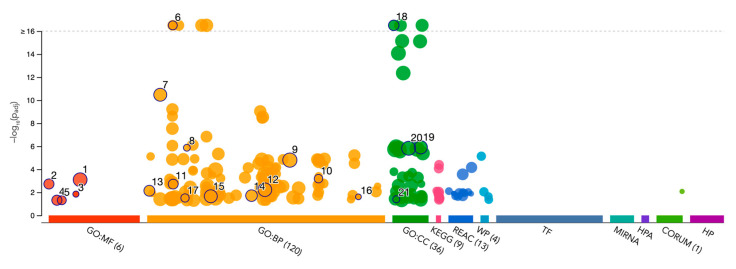
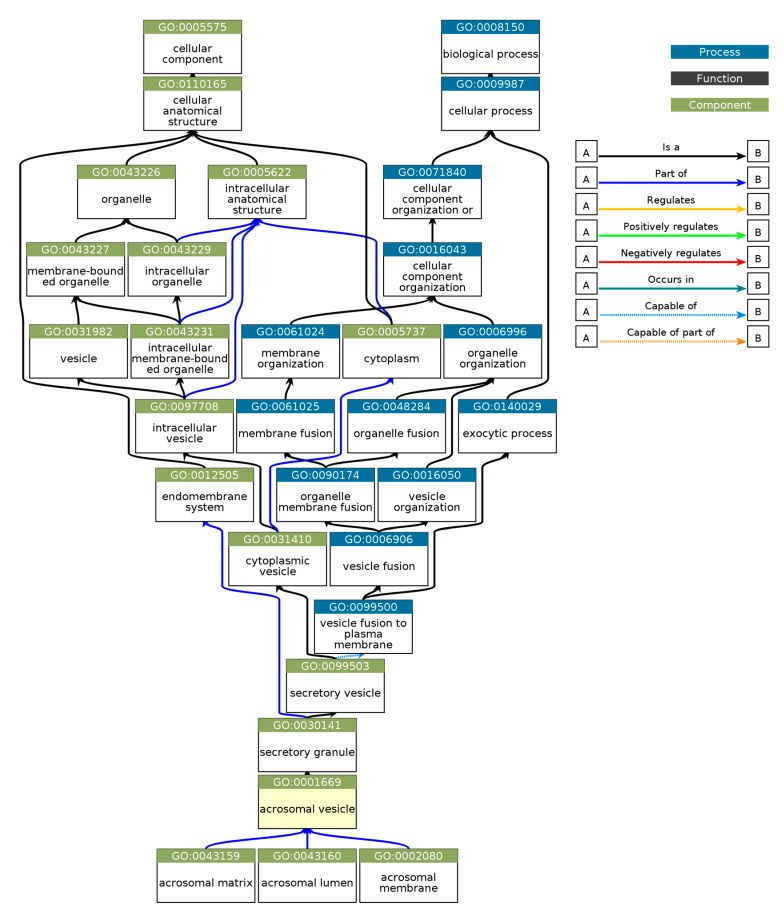
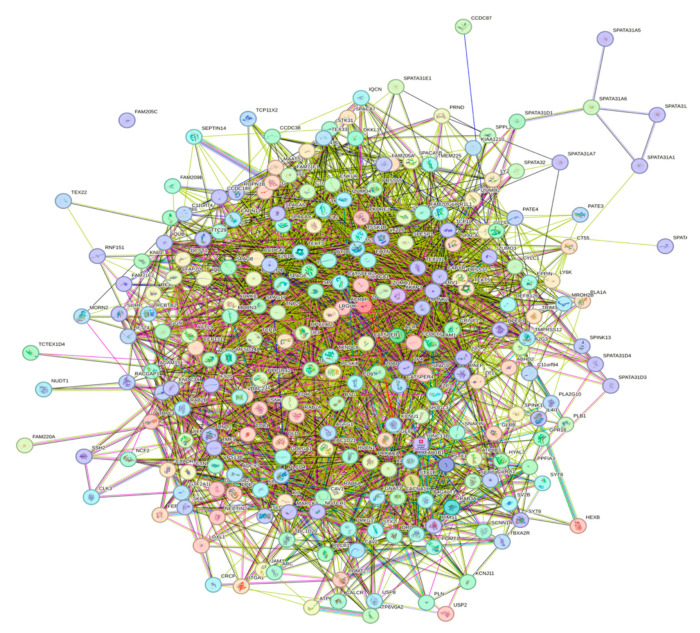
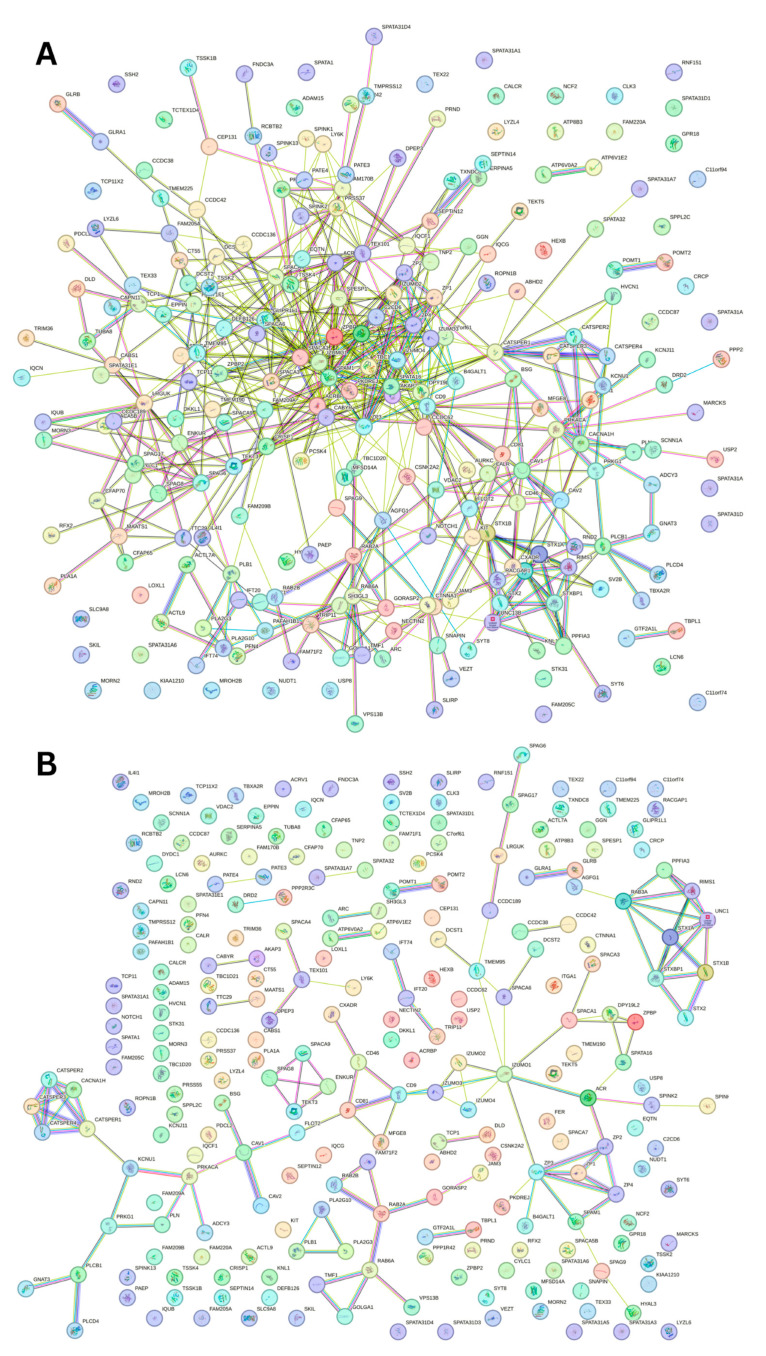
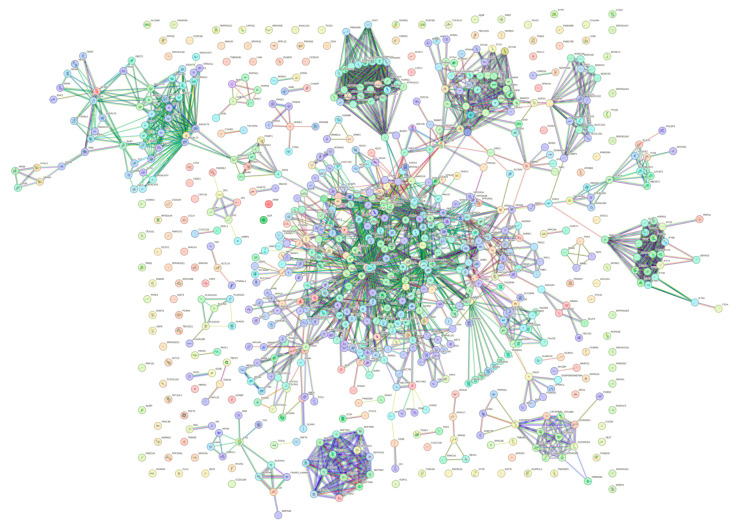
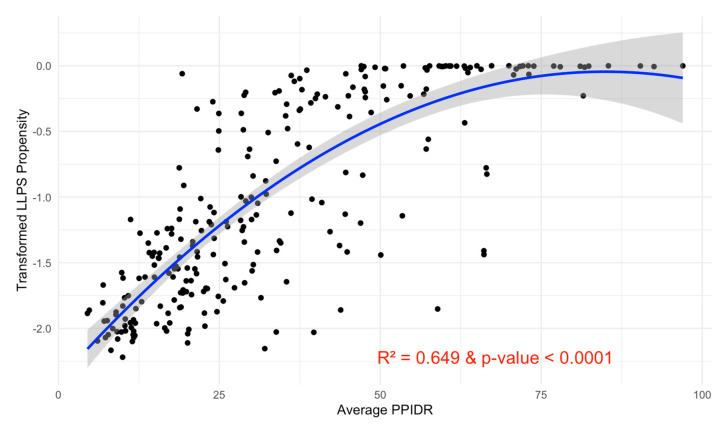
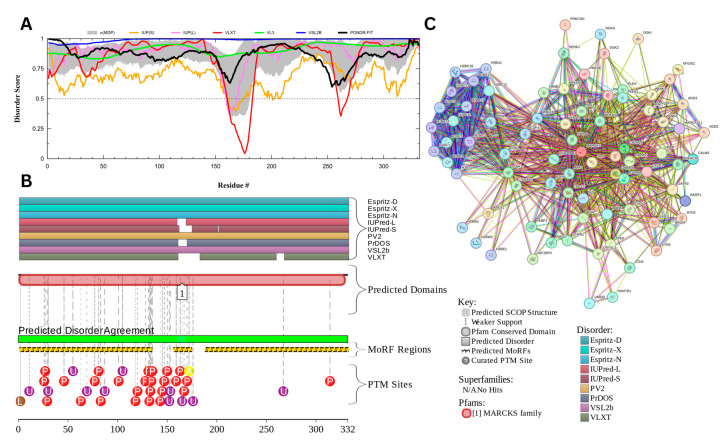
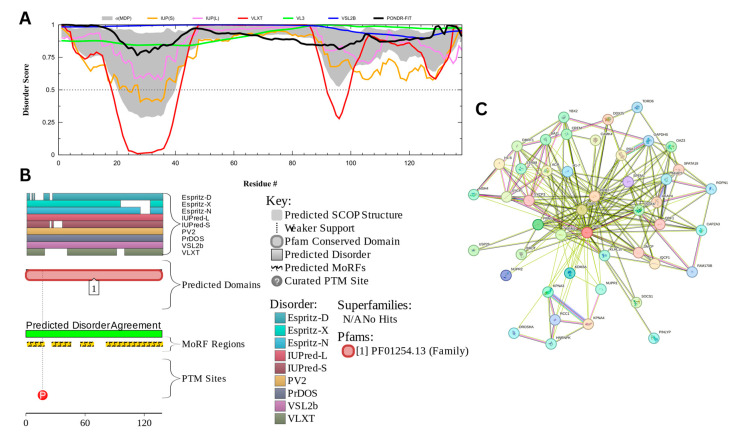
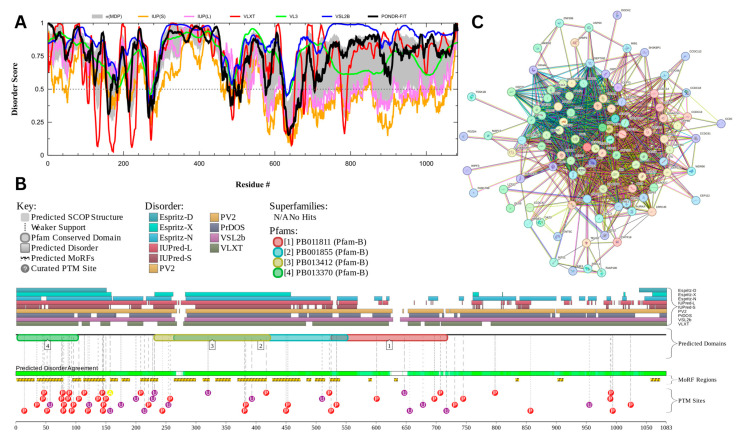
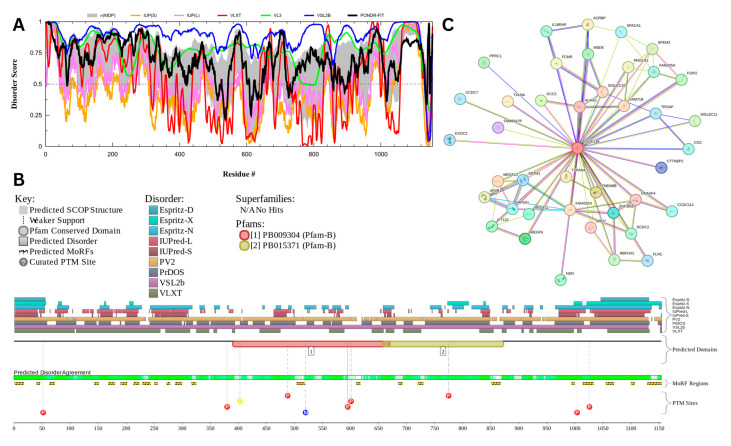
Intrinsic disorder refers to protein regions that lack a fixed three-dimensional structure under physiological conditions, enabling conformational plasticity. This flexibility allows for diverse functions, including transient interactions, signaling, and phase separation via disorder-to-order transitions upon binding. Our study focused on investigating the role of intrinsic disorder and liquid-liquid phase separation (LLPS) in the human acrosome, a sperm-specific organelle essential for fertilization. Using computational prediction models, network analysis, Structural Classification of Proteins (SCOP) functional assessments, and Gene Ontology, we analyzed 250 proteins within the acrosomal proteome. Our bioinformatic analysis yielded 97 proteins with high levels (>30%) of structural disorder. Further analysis of functional enrichment identified associations between disordered regions overlapping with SCOP domains and critical acrosomal processes, including vesicle trafficking, membrane fusion, and enzymatic activation. Examples of disordered SCOP domains include the PLC-like phosphodiesterase domain, the t-SNARE domain, and the P-domain of calnexin/calreticulin. Protein-protein interaction networks revealed acrosomal proteins as hubs in tightly interconnected systems, emphasizing their functional importance. LLPS propensity modeling determined that over 30% of these proteins are high-probability LLPS drivers (>60%), underscoring their role in dynamic compartmentalization. Proteins such as myristoylated alanine-rich C-kinase substrate and nuclear transition protein 2 exhibited both high LLPS propensities and high levels of structural disorder. A significant relationship (p < 0.0001, R² = 0.649) was observed between the level of intrinsic disorder and LLPS propensity, showing the role of disorder in facilitating phase separation. Overall, these findings provide insights into how intrinsic disorder and LLPS contribute to the structural adaptability and functional precision required for fertilization, with implications for understanding disorders associated with the human acrosome reaction.

Keywords: acrosomal proteins; acrosome; bioinformatics; fertility; human sperm; intrinsic disorder; proteins; reproduction; spermatogenesis; structure.


Conflict of interest statement

The authors declare no conflicts of interest. The funders had no role in the design of this study; in the collection, analyses, or interpretation of data; in the writing of this manuscript; or in the decision to publish the results.

Figures

Figure 1
Figure 1
Flowchart of Computational Methods. Overview of the bioinformatics pipeline used to analyze the human acrosomal proteome. A dataset of acrosomal proteins was compiled from UniProt and analyzed using RIDAO to predict intrinsic disorder (PPIDR and ADS), D²P² to identify SCOP domains and functional features, FuzDrop to evaluate LLPS propensity, and STRING to model protein-protein interactions. Outputs from all tools were integrated and statistically analyzed using R for visualization and interpretation.
Figure 2
Figure 2
Structural Representations of Selected Proteins. From left to right, the structures shown are: Arf-GAP domain and FG repeat-containing protein 1 (obtained via Solution NMR; PDB ID: 2D9L; [149,150], Sperm acrosome membrane-associated protein 6 (obtained via X-ray diffraction; PDB ID: 7TA2; [151]), and Voltage-dependent T-type calcium channel subunit alpha-1H (obtained via Cryo-EM; PDB ID: 7WLJ; [152]). Each structure is colored in a rainbow gradient from the N-terminus (blue) to the C-terminus (red), highlighting the secondary structural features, including α-helices, β-strands, and loops.
Figure 3
Figure 3
Predicted Structures of the Top 10 Most Disordered Proteins. AlphaFold was used to model the predicted structures of the 10 most disordered proteins in our dataset, creating a structural portrait gallery. Proteins are displayed by UniProt ID from left to right, starting with the top row: Calcium-binding and spermatid-specific protein 1 (UniProt ID: Q96KC9), regulating synaptic membrane exocytosis protein 1 (UniProt ID: Q86UR5), acrosomal protein SP-10 (UniProt ID: P26436), TATA element modulatory factor (UniProt ID: P82094), Golgin subfamily A member 1 (UniProt ID: Q92805), nuclear transition protein 2 (UniProt ID: Q05952), coiled-coil domain-containing protein 136 (UniProt ID: Q96JN2), myristoylated alanine-rich C-kinase substrate (UniProt ID: P29966), Cylicin-1 (UniProt ID: P35663), and centrosomal protein of 131 kDa (UniProt ID: Q9UPN4). Colors represent the predicted local distance difference test (pLDDT) scores: very high confidence (pLDDT > 90, dark blue), high confidence (90 > pLDDT > 70, light blue), low confidence (70 > pLDDT > 50, yellow), and very low confidence (pLDDT < 50, orange).
Figure 4
Figure 4
Percent Disorder Across Prediction Models. This boxplot compares the distribution of percent disorder (PER) predicted by seven different models: IUPred long, IUPred short, mean disorder propensity (MDP), PONDR-FIT, PONDR® VL3, PONDR® VLXT, and PONDR® VSL2B (PER-IUPL, PER-IUPS, PER-MDP, PER-PFIT, PER-VL3, PER-VLXT, and PER-VSL2B, respectively). Each box represents the interquartile range (IQR), with the median marked by a horizontal line and outliers shown as individual points. The PER-VSL2B model predicts the highest percent disorder overall, while models such as PER-IUPL and PER-IUPS show lower median values, indicating variability in disorder prediction across different tools.
Figure 5
Figure 5
Protein Disorder Categories by Model. This figure shows the distribution of proteins categorized into three disorder classes across multiple prediction models. Proteins are classified as highly disordered (>30% disordered residues, red), moderately disordered (10–30% disordered residues, blue), and highly ordered (0−10% disordered residues, green). Each pie chart corresponds to a specific prediction model. The numbers (n) represent the count of proteins within each disorder category for the respective model.
Figure 6
Figure 6
Scatter Plot of PPIDR vs. ADS Across All Models Analyzed. This scatter plot shows the relationship between PPIDR (percent disorder) and ADS (average disorder score) across multiple prediction models. Each dot represents a protein, colored by the respective disorder prediction model IUPred long, IUPred short, MDP, PONDR-FIT, PONDR® VL3, PONDR® VLXT, and PONDR® VSL2B (IUPL, IUPS, MDP, PFIT, VL3, VLXT, and VSL2B). A strong positive correlation is observed, with a correlation coefficient of r = 0.947 and a statistically significant p-value (p < 0.001), indicating a strong linear relationship between percent disorder and average disorder score.
Figure 7
Figure 7
(A) CH-CDF plot of intrinsic disorder status. This scatter plot displays the relationship between CH scores (distance from CH boundary) and CDF scores (average distance from CDF boundary), classifying proteins into four quadrants based on their intrinsic disorder status. Quadrants are defined as Q1 (Ordered by both CH and CDF boundaries, blue), Q2 (CH Ordered, CDF Disordered, green), Q3 (Disordered by both CH and CDF boundaries, red), and Q4 (CH Disordered, CDF Ordered, orange). This classification highlights the agreement or disagreement between CH and CDF disorder predictions. (B). Number and ratio of proteins in each quadrant. The bar chart shows the distribution of proteins across four quadrants based on CH-CDF disorder classification. The percentages on the top of each bar represent the percent of total proteins in that category.
Figure 8
Figure 8
Number of Proteins at Each Analysis Stage. This bar chart displays the number of proteins retained through successive stages of analysis. The stages include D2P2 hits (233 proteins), proteins with 75% agreement on disorder prediction (190 proteins), SCOP hits (148 proteins), and SCOP domains located within disordered regions (48 proteins). This stepwise filtering highlights the progressive narrowing of the dataset to identify proteins with structural disorder within SCOP domains overlap.
Figure 9
Figure 9
CH-CDF Plot with Disorder-SCOP Overlap. This plot illustrates the relationship between CH scores (distance from CH boundary) and CDF scores (average distance from CDF boundary) for proteins with and without disorder-SCOP overlaps. Data points are classified into four quadrants: Q1 (Ordered by both CH and CDF boundaries, blue), Q2 (CH Ordered, CDF Disordered, green), Q3 (Disordered by both CH and CDF boundaries, red), and Q4 (CH Disordered, CDF Ordered, orange). Circles (●) indicate proteins with disordered regions (classified by 75% agreement in disorder) that overlap with SCOP domains, while triangles (▲) indicate no overlap. This visualization highlights the distribution of structural classification across the disorder-CDF boundary space.
Figure 10
Figure 10
Gene Ontology Analysis of Disorder-Affected Proteins. This bubble plot displays enriched Gene Ontology (GO) terms for disorder-affected proteins across three GO categories: Molecular Function (GO:MF), Biological Process (GO:BP), and Cellular Component (GO:CC). The size of each bubble corresponds to the number of proteins associated with the term, while the y-axis represents the statistical significance (−log10 p-value). KEGG, Reactome (REAC), and other pathways are also included, illustrating the functional and structural roles of intrinsically disordered proteins within biological systems. Values above the dotted line threshold were capped.
Figure 11
Figure 11
Gene Ontology (GO) Hierarchical Annotation for ‘Acrosomal Vesicle’ (GO:0001669). This hierarchical chart depicts the Gene Ontology relationships for GO:0001669 (acrosomal vesicle), a cellular component critical for acrosome structure and function during fertilization. This chart traces the acrosomal vesicle as part of higher-level biological processes, such as vesicle fusion (GO:0099500), organelle membrane fusion (GO:0090174), and membrane fusion (GO:0061025). These components are further nested under broad categories like organelle organization (GO:0006996) and cellular anatomical structure (GO:0110165). The acrosomal vesicle is functionally linked to structures like the acrosomal matrix (GO:0043159), acrosomal lumen (GO:0043160), and acrosomal membrane (GO:0002080), highlighting its role in vesicle organization and exocytosis. This chart was created using EMBL’s European Bioinformatics Institute’s QuickGO tool.
Figure 12
Figure 12
Inter-PPI Network of Human Acrosomal Proteins with 0.15 Confidence. STRING-based analysis of the inter-set interactivity of 245 human acrosomal proteins at the low confidence interval (0.15) to ensure maximum inclusion. Interactions are based on experimental and predicted information. All proteins except for one (UniProt ID: A6NFA0) have determined interactions.
Figure 13
Figure 13
Inter-PPI Networks of Human Acrosomal Proteins with 0.4 and 0.7 Confidence. STRING-based analysis of the inter-set interactivity of 245 human acrosomal proteins at the (A) medium confidence interval (0.4) and (B) high confidence interval (0.7).
Figure 14
Figure 14
Global PPI Network at a 0.9 Confidence Interval. STRING-based analysis of 245 human acrosomal proteins with the 500 highest interacting proteins. The highest confidence was selected to see the most accurate interactions.
Figure 15
Figure 15
Relationship between Average PPIDR and Transformed pLLPS. This scatter plot illustrates the relationship between the average PPIDR of three models (x-axis) and transformed pLLPS (y-axis). A fitted regression line with a 95% confidence interval (shaded region) shows a significant relationship. The model explains 64.9% of the variance (R2 = 0.649) and is highly significant (p-value < 0.0001).
Figure 16
Figure 16
Functional Disorder Analysis of Myristoylated Alanine-Rich C-kinase Substrate (MARCKS) UniProt ID: P29966. (A) Intrinsic disorder profile generated by RIDAO. (B) Functional disorder profile generated by D2P2. (C) PPI network of MARCKS at 0.4 confidence interval.
Figure 17
Figure 17
Functional Disorder Analysis of Nuclear Transition Protein 2 (TNP2) UniProt ID: Q05952. (A) Intrinsic disorder profile generated by RIDAO. (B) Functional disorder profile generated by D2P2. (C) PPI network of TNP2 at a 0.4 confidence interval.
Figure 18
Figure 18
Functional Disorder Analysis of Centrosomal Protein of 131 kDA (CEP131). UniProt ID: (Q9UPN4) (A) Intrinsic disorder profile generated by RIDAO. (B) Functional disorder profile generated by D2P2. (C) PPI network of CEP 131 at a 0.4 confidence interval.
Figure 19
Figure 19
Functional Disorder Analysis of Cylicin-1 (CYLC1); UniProt ID: P35663. (A) Intrinsic disorder profile generated by RIDAO. (B) Functional disorder profile generated by D2P2. (C) PPI network of CYLC1 at a 0.4 confidence interval.
Figure 20
Figure 20
Functional Disorder Analysis of Coiled-Coil Domain-Containing Protein 136 (CCDC136); UniProt ID: Q96JN2. (A) Intrinsic disorder profile generated by RIDAO. (B) Functional disorder profile generated by D2P2. (C) PPI network of CCDC136 at a 0.4 confidence interval.

Similar articles

References

    1. Ito C., Toshimori K. Acrosome markers of human sperm. Anat. Sci. Int. 2016;91:128–142. doi: 10.1007/s12565-015-0323-9. - DOI - PubMed
    1. Abou-Haila A., Tulsiani D.R.P. Mammalian Sperm Acrosome: Formation, Contents, and Function. Arch. Biochem. Biophys. 2000;379:173–182. doi: 10.1006/abbi.2000.1880. - DOI - PubMed
    1. Florman H.M., Jungnickel M.K., Sutton K.A. Regulating the acrosome reaction. Int. J. Dev. Biol. 2008;52:503–510. doi: 10.1387/ijdb.082696hf. - DOI - PubMed
    1. Erenpreisa J., Vainshelbaum N.M., Lazovska M., Karklins R., Salmina K., Zayakin P., Rumnieks F., Inashkina I., Pjanova D., Erenpreiss J. The Price of Human Evolution: Cancer-Testis Antigens, the Decline in Male Fertility and the Increase in Cancer. Int. J. Mol. Sci. 2023;24:11660. doi: 10.3390/ijms241411660. - DOI - PMC - PubMed
    1. Price K.L., Presler M., Uyehara C.M., Shakes D.C. The intrinsically disordered protein SPE-18 promotes localized assembly of MSP in Caenorhabditis elegans spermatocytes. Development. 2021;148:dev195875. doi: 10.1242/dev.195875. - DOI - PMC - PubMed

LinkOut - more resources