

Simultaneous T1, T2, and T1ρ mapping of the myocardium using cardiac MR fingerprinting with a deep image prior reconstruction
- PMID: 40407793
- PMCID: PMC12309879
- DOI: 10.1002/mrm.30580
Simultaneous T1, T2, and T1ρ mapping of the myocardium using cardiac MR fingerprinting with a deep image prior reconstruction
Abstract
Purpose: To develop a cardiac MR fingerprinting (cMRF) approach using deep image prior reconstruction (DIP) to simultaneously map T1, T2, and T1ρ, and assess T1ρ in healthy subjects and patients with areas of enhancement on late gadolinium enhancement.
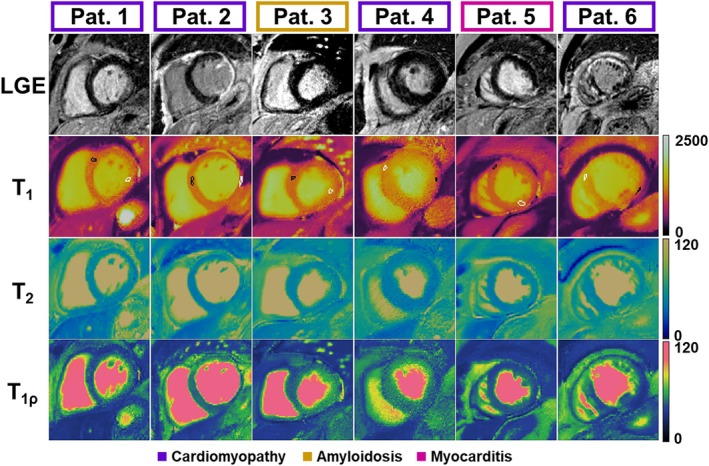
Methods: A 2D electrocardiogram-triggered cMRF sequence was developed to measure T1, T2, and T1ρ simultaneously. DIP reconstruction was evaluated for noise and artifact reduction compared to a low-rank reconstruction. Measurements were assessed in simulation and phantom for accuracy. T1ρ-cMRF maps were generated in 10 healthy subjects and six patients under evaluation for cardiomyopathy, myocarditis, and amyloidosis receiving gadolinium-based contrast agent-enhanced CMR at 1.5 T.
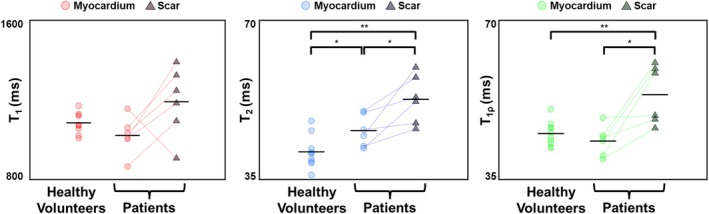
Results: T1ρ-cMRF maps showed excellent agreement with ground truth (RMS error = 3.0% ± 5.3%) and conventional methods (R2 = 0.99) in simulations and phantom experiments. Measured values in healthy subjects were consistent with literature (T1 = 1051 ± 63 ms, T2 = 41.4 ± 3.3 ms, and T1ρ = 45.5 ± 2.4 ms). DIP reconstruction reduced noise, indicated by lower coefficient of variation (Δ = 4.7), compared to low-rank reconstruction. Mean differences of 10.2 ms (p = 0.02) in T1ρ and 6.9 ms in T2 maps were observed between areas of enhancement on late gadolinium enhancement and normal-appearing myocardium in patients. Within individual patients, significant differences (p < 0.01) in T1, T2, and T1ρ were observed between American Heart Association segments with and without contrast enhancement.
Conclusion: The proposed T1ρ-cMRF sequence using DIP reconstruction enables simultaneous quantification of T1, T2, and T1ρ with decreased coefficient of variation compared to low-rank reconstruction. Simulation and phantom studies show good agreement with references. In vivo measurements were made in healthy subjects, and areas of contrast enhancement in patients showed elevated T2 and T1ρ relative to remote myocardium.
Keywords: MR fingerprinting; T1ρ; cardiac MRI; multiparametric mapping.
© 2025 The Author(s). Magnetic Resonance in Medicine published by Wiley Periodicals LLC on behalf of International Society for Magnetic Resonance in Medicine.
Conflict of interest statement
V. Murthy, J. Hamilton, and N. Seiberlich have received research grants from Siemens Healthineers. N. Seiberlich has received royalties from Siemens Healthineers for MRF. V. Murthy owns stock in General Elecric, Cardinal Health, Viatris, Pfizer, Amgen, Merck and Johnson & Johnson and stock options in lonetix. He is a paid consultant for INVIA Medical Imaging Solutions & Siemens Healthineers.
Figures


References
-
- van Oorschot JWM, Gho JMIH, van Hout GPJ, et al. Endogenous contrast MRI of cardiac fibrosis: beyond late gadolinium enhancement. J Magn Reson Imaging. 2015;41:1181‐1189. - PubMed
-
- Kaolawanich Y, Azevedo CF, Kim HW, et al. Native T1 mapping for the diagnosis of myocardial fibrosis in patients with chronic myocardial infarction. JACC Cardiovasc Imaging. 2022;15:2069‐2079. - PubMed
-
- Mavrogeni S, Apostolou D, Argyriou P, et al. T1 and T2 mapping in cardiology: “mapping the obscure object of desire.”. Cardiology. 2017;138:207‐217. - PubMed
MeSH terms
Substances
Grants and funding
- Siemens Healthineers
- R01AG059729/AG/NIA NIH HHS/United States
- U01DK123013/DK/NIDDK NIH HHS/United States
- R01 CA 263583/Division of Cancer Prevention, National Cancer Institute
- R01 HL153034/HL/NHLBI NIH HHS/United States
- R01 HL136685/HL/NHLBI NIH HHS/United States
- R01HL136685/HL/NHLBI NIH HHS/United States
- R01 HL163030/HL/NHLBI NIH HHS/United States
- R01 AG059729/AG/NIA NIH HHS/United States
- U01 DK123013/DK/NIDDK NIH HHS/United States
- R37 CA263583/CA/NCI NIH HHS/United States
- R01 HL163991/HL/NHLBI NIH HHS/United States
- 20SFRN35120123/American Heart Association
LinkOut - more resources
Full Text Sources
Medical
