. 2025 May 23;28(3):30.
doi: 10.1007/s10456-025-09982-8.

Human endothelial colony forming cells (ECFCs) require endothelial protein C receptor (EPCR) for cell cycle progression and angiogenic activity

Affiliations

Human endothelial colony forming cells (ECFCs) require endothelial protein C receptor (EPCR) for cell cycle progression and angiogenic activity

Sarah E J Chambers et al. Angiogenesis. .

Abstract

Vascular repair and regeneration are critical for tissue homeostasis. Endothelial colony forming cells (ECFCs) are vessel-resident progenitors with vasoreparative capacity and they offer an important avenue for allogeneic cytotherapy to achieve perfusion of ischemic tissues. Endothelial Protein C Receptor (EPCR) has been proposed as a marker for vascular endothelial stem cells, but its precise role in ECFC biology remains unknown. The current study has investigated the biological relevance of EPCR in ECFC function. Our data show that over 95% of ECFCs exhibit high EPCR expression. These levels surpassing CD34 and CD157, positions EPCR as a new robust ECFC immunophenotypic marker, alongside established markers CD31 and CD105. Functionally, depleting EPCR expression in ECFCs significantly diminished angiogenic activity, including proliferation, migration and tube formation. This knockdown also altered normal ECFC barrier function. Transcriptomic analysis indicated that knockdown of EPCR led to enrichment of gene signatures for cell cycle, TGF beta, and focal adhesion kinases. G1 cell cycle arrest was confirmed in ECFCs with depleted EPCR. Mechanistically, EPCR knockdown led to increased release of TGFβ2 and SMAD2/3 activation, coupled with increased p21, decreased pFAK, and increased transgelin. Additionally, we showed that quiescent ECFCs showed significantly lower EPCR expression when compared to proliferating ECFCs. In agreement with this, cell sorting experiments demonstrated that ECFCs with the highest EPCR expression exhibited the highest clonogenic capacity. In summary, our findings highlight that EPCR expression in ECFCs is critical for their angiogenic activity, by modulating cell cycle progression.

Keywords: Angiogenesis; Cell cycle; Endothelial colony forming cells; Endothelial progenitor; Protein C receptor; Transforming growth factor beta.


Conflict of interest statement

Declarations. Conflict of interest: RJM and AWS are co-founders and scientific advisors for VascVersa Ltd. Ethical approval: The study has ethical approval by the NRES Committee with REC reference 15/YH/0281.

Figures

Fig. 1
Fig. 1
ECFCs show widespread expression of EPCR on cell surface. a Cell surface expression by flow cytometry of EPCR (pink histogram), CD157 (orange histogram), and CD34 (blue histogram) relative to unstained sample (grey histogram). Violin plots show distribution of (b) % Expression and (c) MFI (median fluorescence intensity) for EPCR, CD157, and CD34, n = 9. d Immunofluorescence of EPCR (AF488) in green shows widespread distribution on cell surface. Nucleus stained with DAPI in blue. Scale bar 50 µm. One-way ANOVA was performed, ns = not significant, **p < 0.01; ***p < 0.001, ****p < 0.0001. e Procr average expression by cell type from a model of severe acute lung injury GSE211335. f Procr percentage expression across lung cell types and timepoints after injury g Spearman correlation of Procr transcript with reported markers of endothelial stemness and differentiation
Fig. 2
Fig. 2
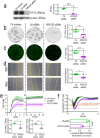
Expression of EPCR in ECFCs is essential for endothelial functionality. a PROCR silencing by PROCR siRNA confirmed in Western blot. Quantification of protein levels showed significant reduction in EPCR expression (49 kDa) relative to β-actin (42 kDa) in PROCR siRNA group compared to control untransfected and control siRNA groups, n = 4. Endothelial cell functional assays performed comparing control untransfected, control siRNA, and PROCR siRNA groups to include: b clonogenics assay and quantification of % colony area, n = 5, c tubulogenesis assay and quantification of % tube area, n = 6, d scratch migration assay from 0 to 6 h and quantification of distance migrated, n = 4, e barrier formation and quantification of cell index at 2.28 h and 12 h, n = 3 and f normalized cell index after thrombin treatment and quantification, n = 3. In all assays, control siRNA and PROCR siRNA groups are normalized to control untransfected, which is represented by the black dashed line, and analyzed by paired t-test. *p < 0.05, **p < 0.01; ***p < 0.001
Fig. 3
Fig. 3
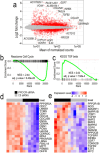
ECFCs with knocked-down EPCR by PROCR siRNA exhibited a negative enrichment for cell cycle gene signature. Bulk RNA-seq of 6 biological replicates highlighted 1,101 differentially expressed genes presented in (a) MA plot of PROCR siRNA vs control siRNA, n = 6. KEGG pathway analysis revealed that among the most down regulated gene signatures was CELL_CYCLE (b), and among the most up regulated was TGF_BETA_SIGNALING_PATHWAY (c). Heatmap showing cell cycle associated genes significantly downregulated (d) and upregulated (e) in PROCR siRNA compared to control siRNA
Fig. 4
Fig. 4
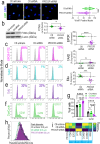
Knocking down PROCR in ECFCs halted the cell cycle in G1 phase. a Immunofluorescence staining of Ki67 (AF488 in green) in PROCR siRNA group vs control untransfected and control siRNA, nucleus stained with DAPI (blue), scale bar 50 µm. Violin plots show % ki67 positive nuclei quantified, n = 3 biological replicates, each technical replicate has been plotted. b PROCR silencing leads to decrease in PCNA (30 kDa) expression in western blot, relative to β-actin (42 kDa); quantification shows significant decrease in PCNA expression in PROCR siRNA group compared to control untransfected and control siRNA groups, n = 4. Control untransfected, control siRNA, and PROCR siRNA groups were assessed by flow cytometry and % expression quantified (in all plots grey histogram represents unstained control). c EPCR expression (pink histogram) and quantification, n = 6, d 7AAD expression (blue histogram) and quantification, n = 3. e EdU cell proliferation assay (purple histogram) and quantification, n = 5. f Cell cycle analysis using Vybrant dye cycle by flow cytometry (green histogram) shows distribution of G0/G1 (1st peak) and G2/M (2nd peak) phases of cell cycle. g Quantification of % cells within G0/G1 and G2/M phases n = 4, analyzed by 2-way ANOVA. h Histogram of PseudoDiameterMicrons generated from automated image analysis (AIA) using Attune CytPix. i RT-qPCR displayed as heatmap shows changes in gene expression in PROCR, G1 checkpoint genes (CDK, E2F2), G1 blocker genes (p53, p21), G2/M checkpoint genes (CCNA2, CCNB2), and apoptosis related BAX gene, comparing control untransfected, control siRNA, and PROCR siRNA groups, n = 6. ns = not significant, *p < 0.05, **p < 0.01; ***p < 0.001, ****p < 0.0001. In all graphs, the dotted line represents the average of control untransfected group
Fig. 5
Fig. 5
Diminished EPCR expression led to increased pSMAD2/3 and pERK via TGFβ2 signaling pathway as shown by Western blot (a) and densitometry quantification for pSMAD2/3 (b), pERK (c), Transgelin (d), and pFAK (e). f TGFβ2 secretion from control siRNA and PROCR siRNA assessed by ELISA. g Evaluation of TGFβ2 release when PROCR siRNA ECFCs were treated with Alk5 inhibitor SB525334. All data analyzed using a ratio paired t test, n = 4, *p < 0.05, **p < 0.01
Fig. 6
Fig. 6
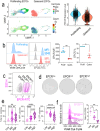
PROCR mRNA expression levels are associated with proliferative status in ECFCs a Expression of PROCR in scRNAseq of quiescent vs proliferating ECFCs. PROCR expression sub-divided by cell cycle phases using gene signatures, G1 (blue), G2M (yellow), S (red). b Cell cycle distribution by flow cytometry confirms quiescent ECFC monolayers (red histogram) are arrested in G1 phase and have loss of G2M peak compared to proliferating ECFCs (blue histogram). EPCR expression is presented as median fluorescence intensity (MFI). Grey histograms represent unstained control. Quantification of EPCR MFI and % expression analyzed by paired t-test, n = 4, *p < 0.05, **p < 0.01. c Contour plot shows gating strategy for EPCRlow, EPCRmid, and EPCRhigh populations which were sorted (by FACS) and plated for d clonogenic assay. e Violin plots show quantification of total number of colonies, as well as % high proliferative potential (HPP) and % low proliferative potential (LPP). Data analyzed by one-way ANOVA, ns = not significant, **p < 0.01, *** p < 0.001, ****p < 0.0001, n = 3 biological replicates, each technical replicate has been plotted. f Sorted populations of EPCRlow, EPCRmid, and EPCR.high were analyzed by flow cytometry for cell cycle distribution using Violet dye cycle and the ratio of G1/G2M populations quantified using one-way ANOVA, n = 4, *p < 0.05, **p < 0.01

References

    1. Melero-Martin JM (2022) Human endothelial colony-forming cells. Cold Spring Harb Perspect Med. 10.1101/cshperspect.a041154 - PMC - PubMed
    1. Reid E, Guduric-Fuchs J, O’Neill CL et al (2018) Preclinical evaluation and optimization of a cell therapy using human cord blood-derived endothelial colony-forming cells for ischemic retinopathies. Stem Cells Transl Med. 10.1002/sctm.17-0187 - PMC - PubMed
    1. Liao G, Zheng K, Shorr R, Allan DS (2020) Human endothelial colony-forming cells in regenerative therapy: a systematic review of controlled preclinical animal studies. Stem Cells Transl Med 9:1344–1352 - PMC - PubMed
    1. Blandinières A, Randi AM, Paschalaki KE et al (2023) Results of an international survey about methods used to isolate human endothelial colony-forming cells: guidance from the SSC on Vascular Biology of the ISTH. J Thromb Haemost. 10.1016/j.jtha.2023.06.014 - PubMed
    1. Medina RJ, Barber CL, Sabatier F et al (2017) Endothelial progenitors: a consensus statement on nomenclature. Stem Cells Transl Med 6:1316–1320 - PMC - PubMed

MeSH terms

Substances

LinkOut - more resources