. 2025 May 1;66(5):32.
doi: 10.1167/iovs.66.5.32.

Elevated Visual Crowding in CRB1-Associated Retinopathies: Understanding Functional Visual Deficits Using Child-Friendly Computerized Testing

Affiliations

Elevated Visual Crowding in CRB1-Associated Retinopathies: Understanding Functional Visual Deficits Using Child-Friendly Computerized Testing

Ana Catalina Rodriguez-Martinez et al. Invest Ophthalmol Vis Sci. .

Abstract

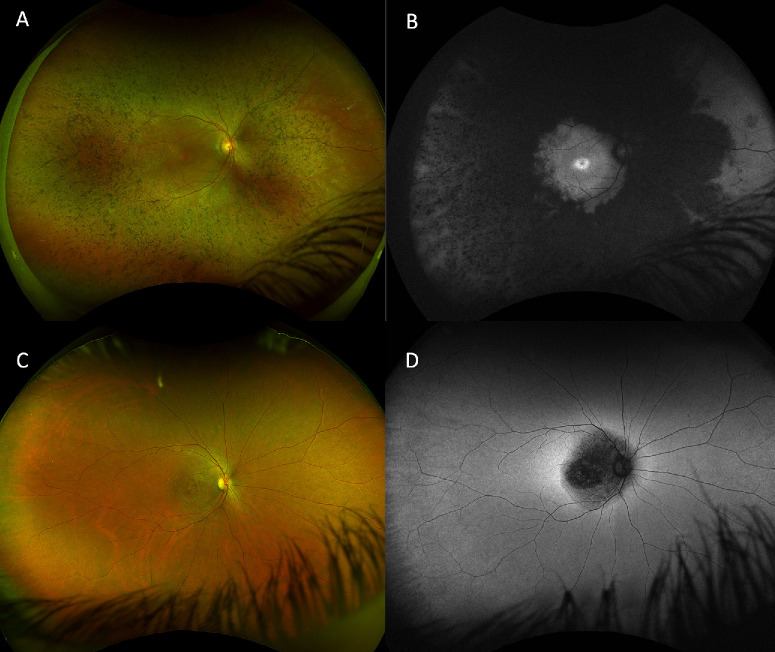
Purpose: Mutations affecting the CRB1 gene produce retinal dystrophies including early onset severe retinal dystrophy/Leber congenital amaurosis (EOSRD/LCA), retinitis pigmentosa (RP), cone-rod dystrophy (CORD), and macular dystrophy (MD). As treatment strategies advance toward clinical translation, there is a need to establish reliable outcome metrics and to better understand the visual deficits associated with CRB1 retinopathies. To this end, we measured visual acuity (VA) and crowding (the disruptive effect of clutter on object recognition), both key functions in spatial vision, using child-friendly computer-based tests, and gold-standard clinical measures.

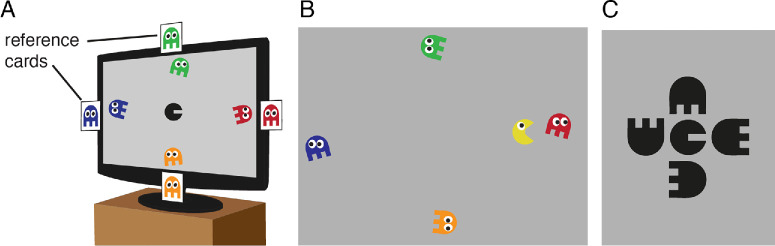
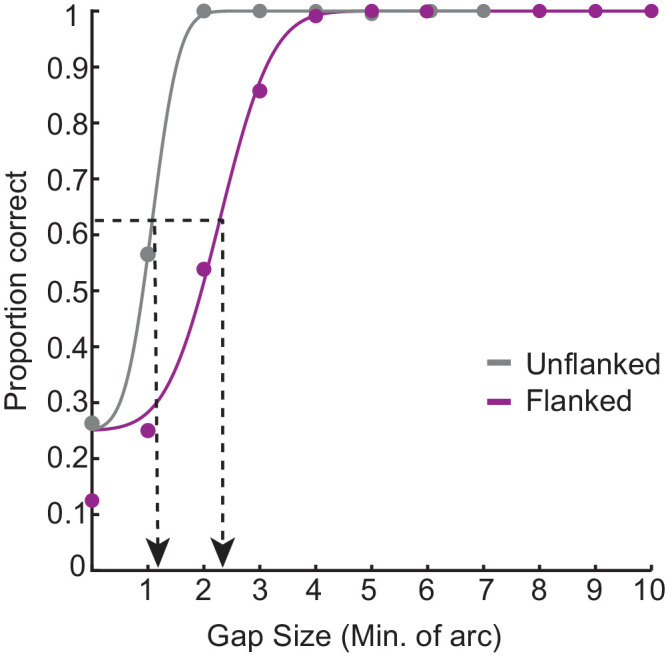
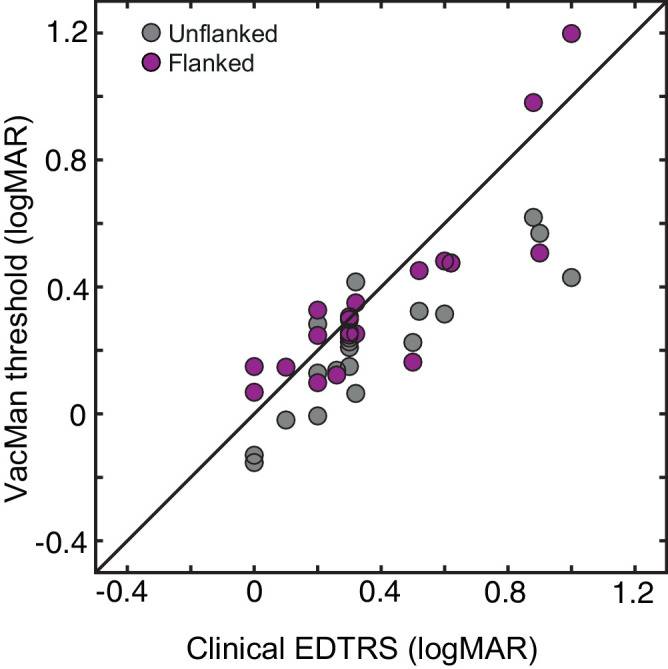
Methods: Patients with molecularly confirmed biallelic CRB1 pathogenic variants were compared with age-matched controls (n = 20 in each). Best-corrected visual acuity (BCVA) was measured with both Early Treatment Diabetic Retinopathy Study (ETDRS) and the computerized VacMan procedures (using an unflanked/isolated VacMan target), which also allowed measurement of crowding when surrounding flanker elements were added.

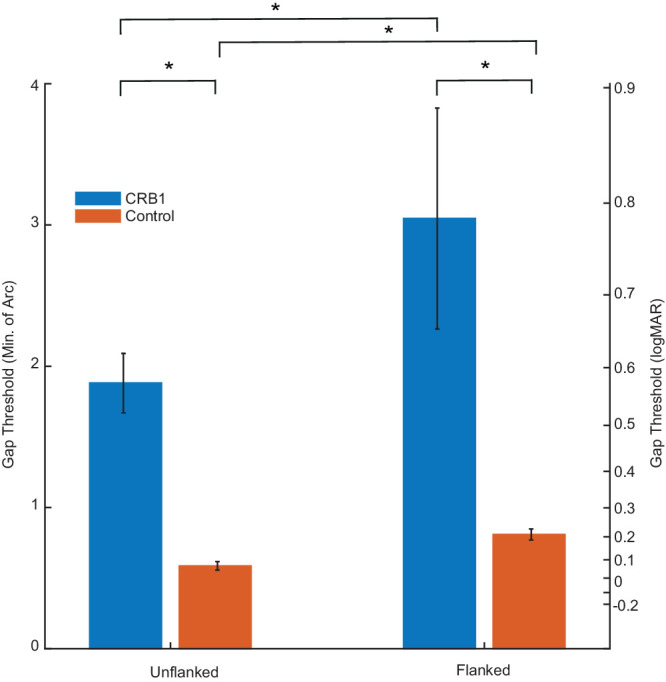
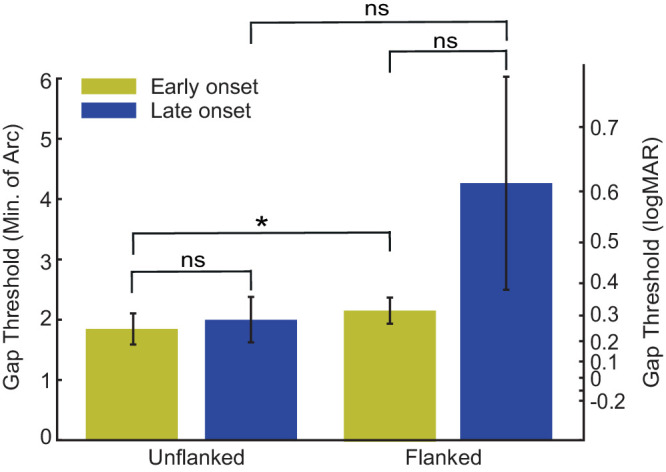
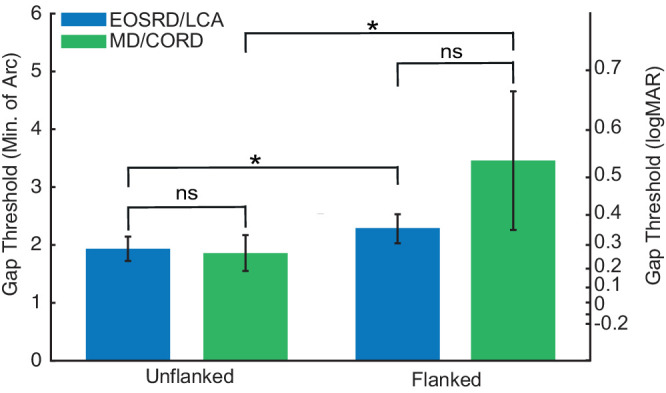
Results: Both acuity and crowding were significantly elevated in individuals with CRB1 retinopathy compared with controls. ETDRS acuity correlated with both the unflanked (r = 0.868, P < 0.001) and flanked VacMan thresholds (r = 0.748, P < 0.001). No statistically significant changes in crowding were observed with respect to CRB1 phenotype (EOSRD/LCA, CORD, or MD) or age of onset.

Conclusions: This study demonstrates for the first time that individuals with CRB1 retinopathy exhibit elevated crowding in their foveal vision compared with controls. Measuring crowding offers valuable insights into understanding functional visual deficits in CRB1 retinopathy and could be a useful metric for monitoring disease progression and treatment outcomes in inherited retinal diseases.


Conflict of interest statement

Disclosure: A.C. Rodriguez-Martinez, None; V.K. Tailor-Hamblin, None; B.E. Higgins, None; P.R. Jones, None; T.M. Dekker, None; R.H. Henderson, None; J.A. Greenwood, None; M. Moosajee, None

Figures

Figure 1.
Figure 1.
(A) An example trial of the unflanked VacMan task is depicted. Children reported the color of the ghost that VacMan was facing. Colored cards were present on the monitor edges for reference. (B) An example frame from the “reward animation.” (C) Depiction of the crowding stimuli. Ghosts were rendered achromatically and presented at random orientations at a fixed separation from VacMan. The task was as in A, with the reference cards assisting color memory.
Figure 2.
Figure 2.
Example responses and psychometric functions for an individual with CRB1 retinopathy. Circles plot the proportion of correct responses at each of the gap sizes presented, separately for the unflanked (grey) and flanked (purple) conditions. Solid lines plot the best-fitting psychometric function for each condition. Gap-size thresholds were taken at 62.5% correct, shown as the black dashed line and its corresponding location on the x-axis.
Figure 3.
Figure 3.
Spectrum of CRB1 retinopathy phenotypes depicted in widefield color fundus photographs and corresponding fundus autofluorescence (FAF) images. (A) Right eye of an 18-year-old male patient with CRB1-EOSRD showing peripheral bone spicules and generalized retinal degeneration seen as hypo-autofluorescence (AF) in the FAF image sparing the macular region and a hyper-autofluorescence signal around the fovea (B). (C) Right eye of a 34-year-old female patient with CRB1-MD revealing hypo-AF in the posterior pole with a surrounding hyper-AF ring (D).
Figure 4.
Figure 4.
Mean gap-size thresholds for both participant groups, plotted in minutes of arc (left y-axis), with comparison to their logMAR equivalents (right y-axis). The blue bars plot thresholds for the CRB1 group and the orange bars plot thresholds for the control group. Error bars represent the SEM, with asterisks indicating statistically significantly differences.
Figure 5.
Figure 5.
Gap-size thresholds (in logMAR) for CRB1 individuals for both the unflanked (grey filled circles) and the flanked (purple filled circles). The y-axis plots VacMan thresholds and the x-axis the clinical ETDRS logMAR values. The black line represents perfect correspondence between the two measures.
Figure 6.
Figure 6.
Gap-size thresholds for CRB1 participants divided by age-of-onset of disease, plotted in minutes of arc (left y-axis), with comparison to their logMAR equivalents (right y-axis). The green bars plot thresholds for the early onset CRB1 group and the red bar plots the thresholds for the late onset CRB1 group. Error bars represent the SEM, with * = significant and ns = not significant.
Figure 7.
Figure 7.
Gap-size thresholds for CRB1 participants divided by clinical phenotype, plotted in minutes of arc (left y-axis), with comparison to their logMAR equivalents (right y-axis). The blue bars plot thresholds for the EOSRD/LCA CRB1 group and the green bar plots the thresholds for the MD/CORD CRB1 group. Error bars represent the SEM, with * = significant and ns = not significant.
Figure 8.
Figure 8.
Box plots illustrating the reported enjoyability of the tests. (A) Percentage distribution of responses regarding the level of enjoyability when performing the VacMan test. (B) Percentage distribution of responses regarding the level of enjoyability when performing the ETDRS chart. (C) Preference distribution, with 88% of participants indicating a preference for the VacMan test.

Similar articles

References

    1. Rodriguez-Martinez AC, Higgins BE, Tailor-Hamblin V, et al. .. Foveal hypoplasia in CRB1-related retinopathies. Int J Mol Sci. 2023; 24(18): 13932. - PMC - PubMed
    1. Stehle IF, Imventarza JA, Woerz F, et al. .. Human CRB1 and CRB2 form homo- and heteromeric protein complexes in the retina. Life Sci Alliance. 2024; 7(6): e202302440. - PMC - PubMed
    1. Boon N, Wijnholds J, Pellissier LP. Research models and gene augmentation therapy for CRB1 retinal dystrophies. Front Neurosci. 2020; 14: 860. - PMC - PubMed
    1. Varela MD. CRB1-associated retinal dystrophies: genetics, clinical characteristics, and natural history. Am J Ophthalmol. 2023; 246: 107–121. - PMC - PubMed
    1. Henderson RH, Mackay DS, Li Z, et al. .. Phenotypic variability in patients with retinal dystrophies due to mutations in CRB1. Br J Ophthalmol. 2011; 95(6): 811–817. - PubMed

MeSH terms