. 2025 Jun 24;44(6):115734.
doi: 10.1016/j.celrep.2025.115734. Epub 2025 May 22.

Regulatory network analysis of Dclk1 gene expression reveals a tuft cell-ILC2 axis that inhibits pancreatic tumor progression

Affiliations

Regulatory network analysis of Dclk1 gene expression reveals a tuft cell-ILC2 axis that inhibits pancreatic tumor progression

Giovanni Valenti et al. Cell Rep. .

Abstract

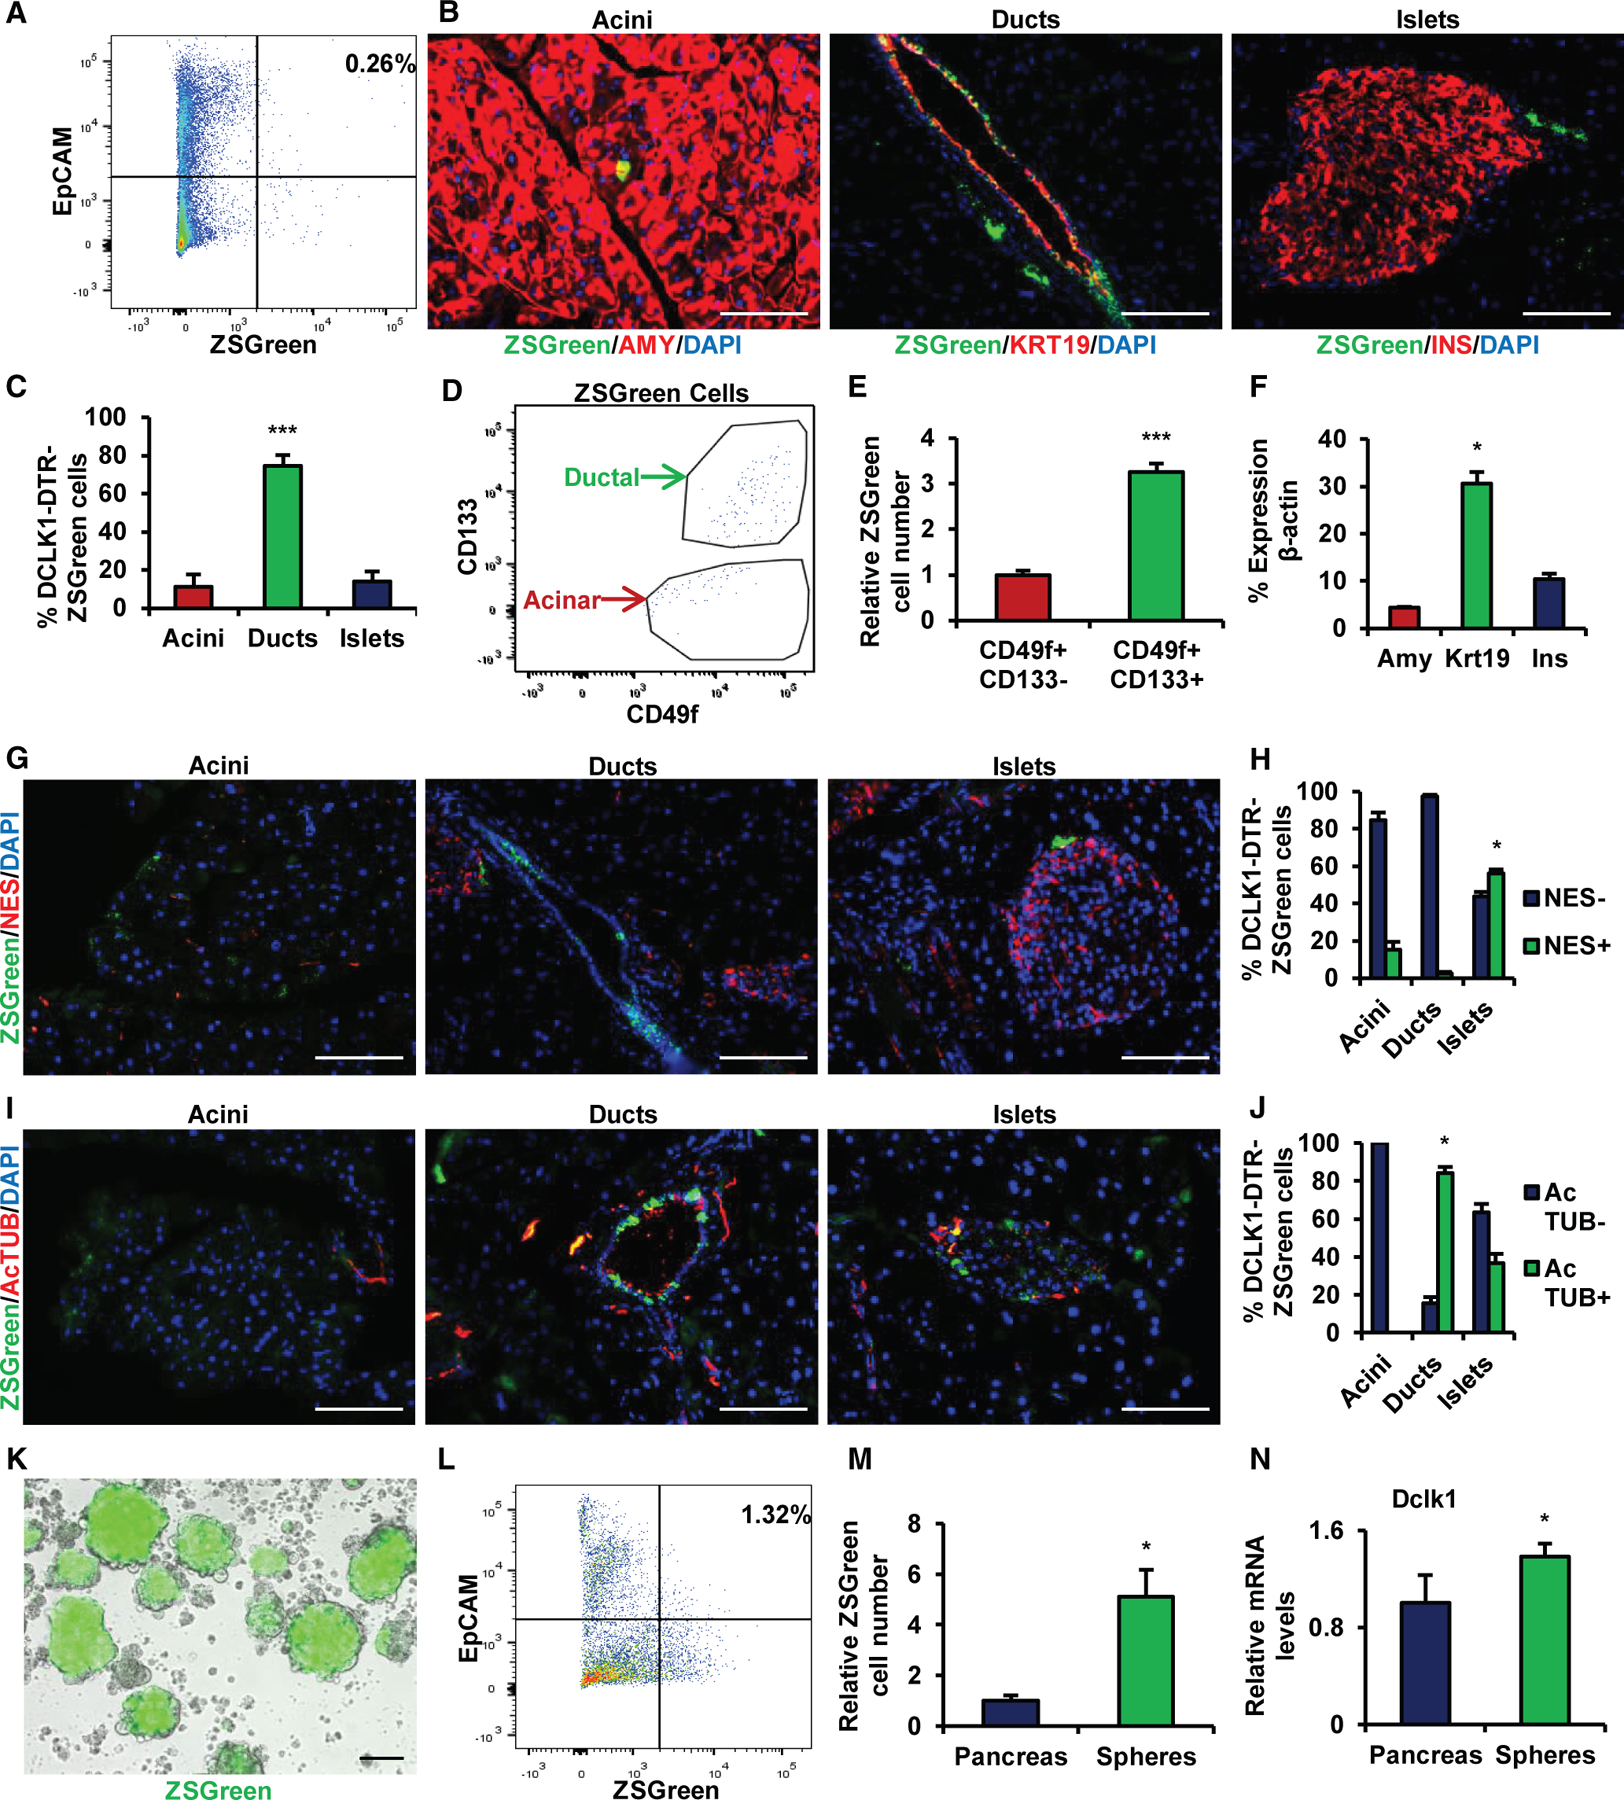
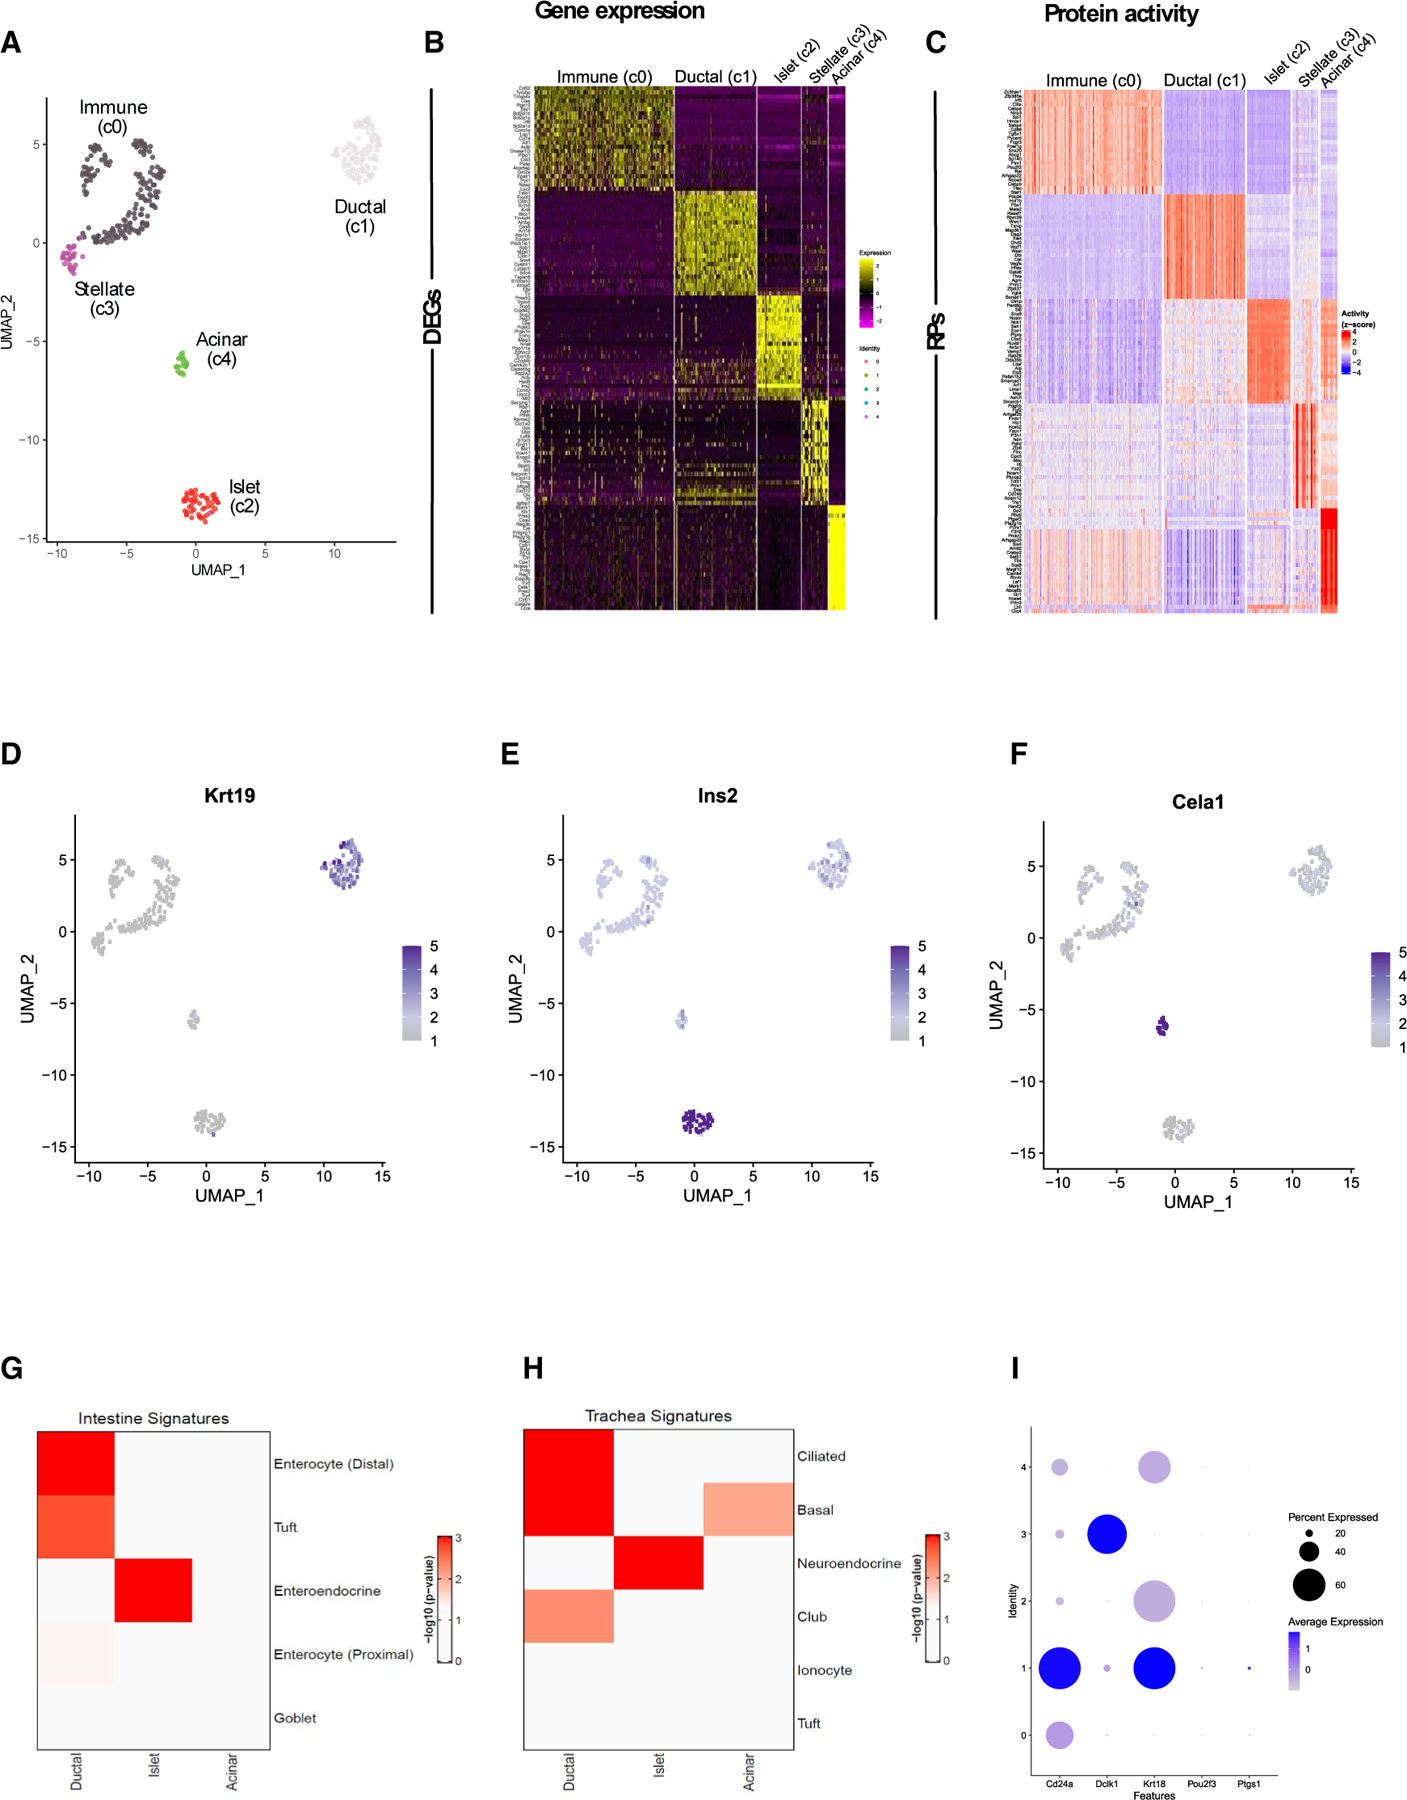
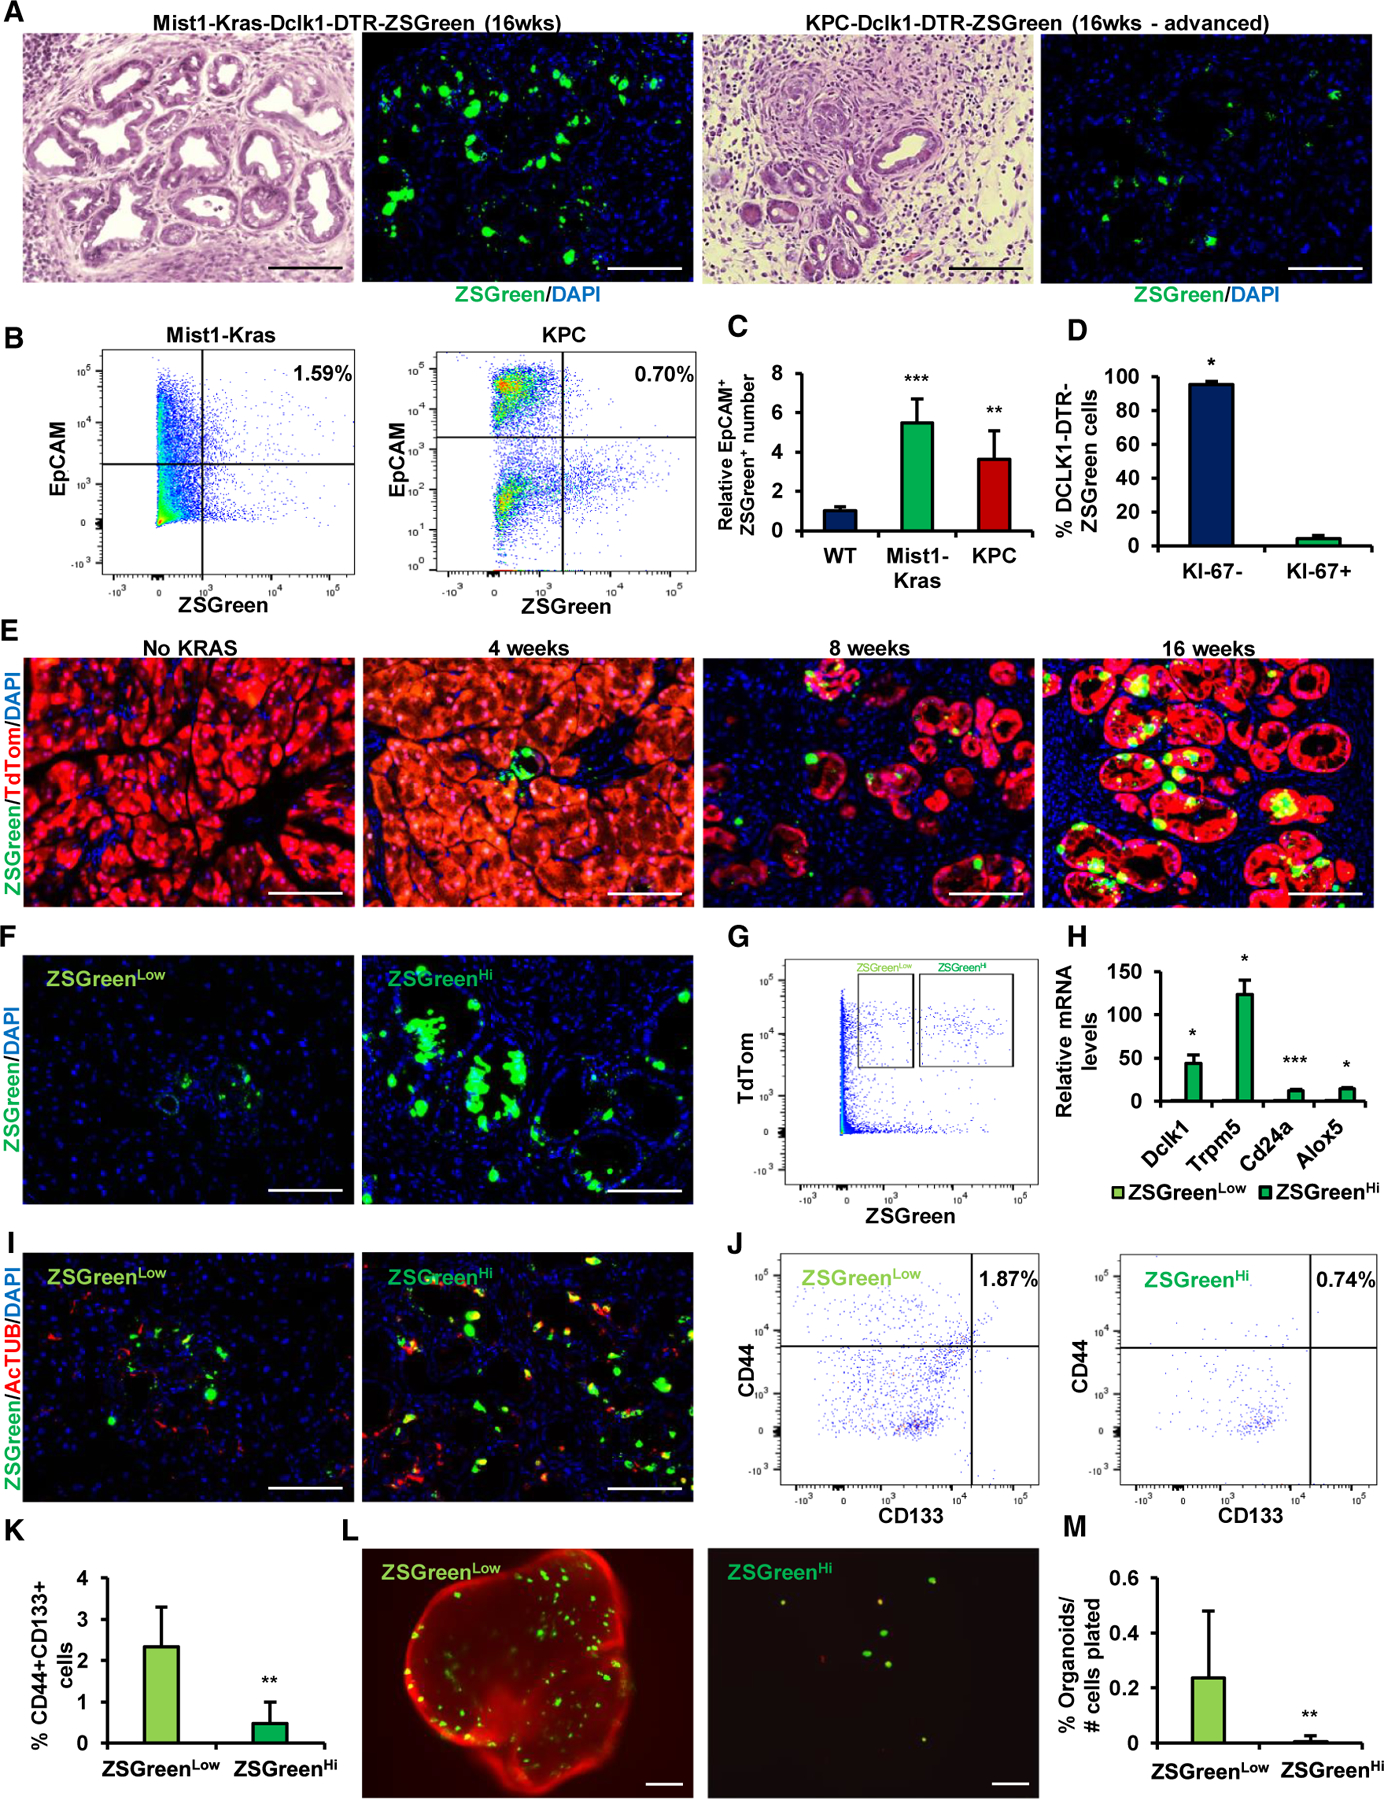
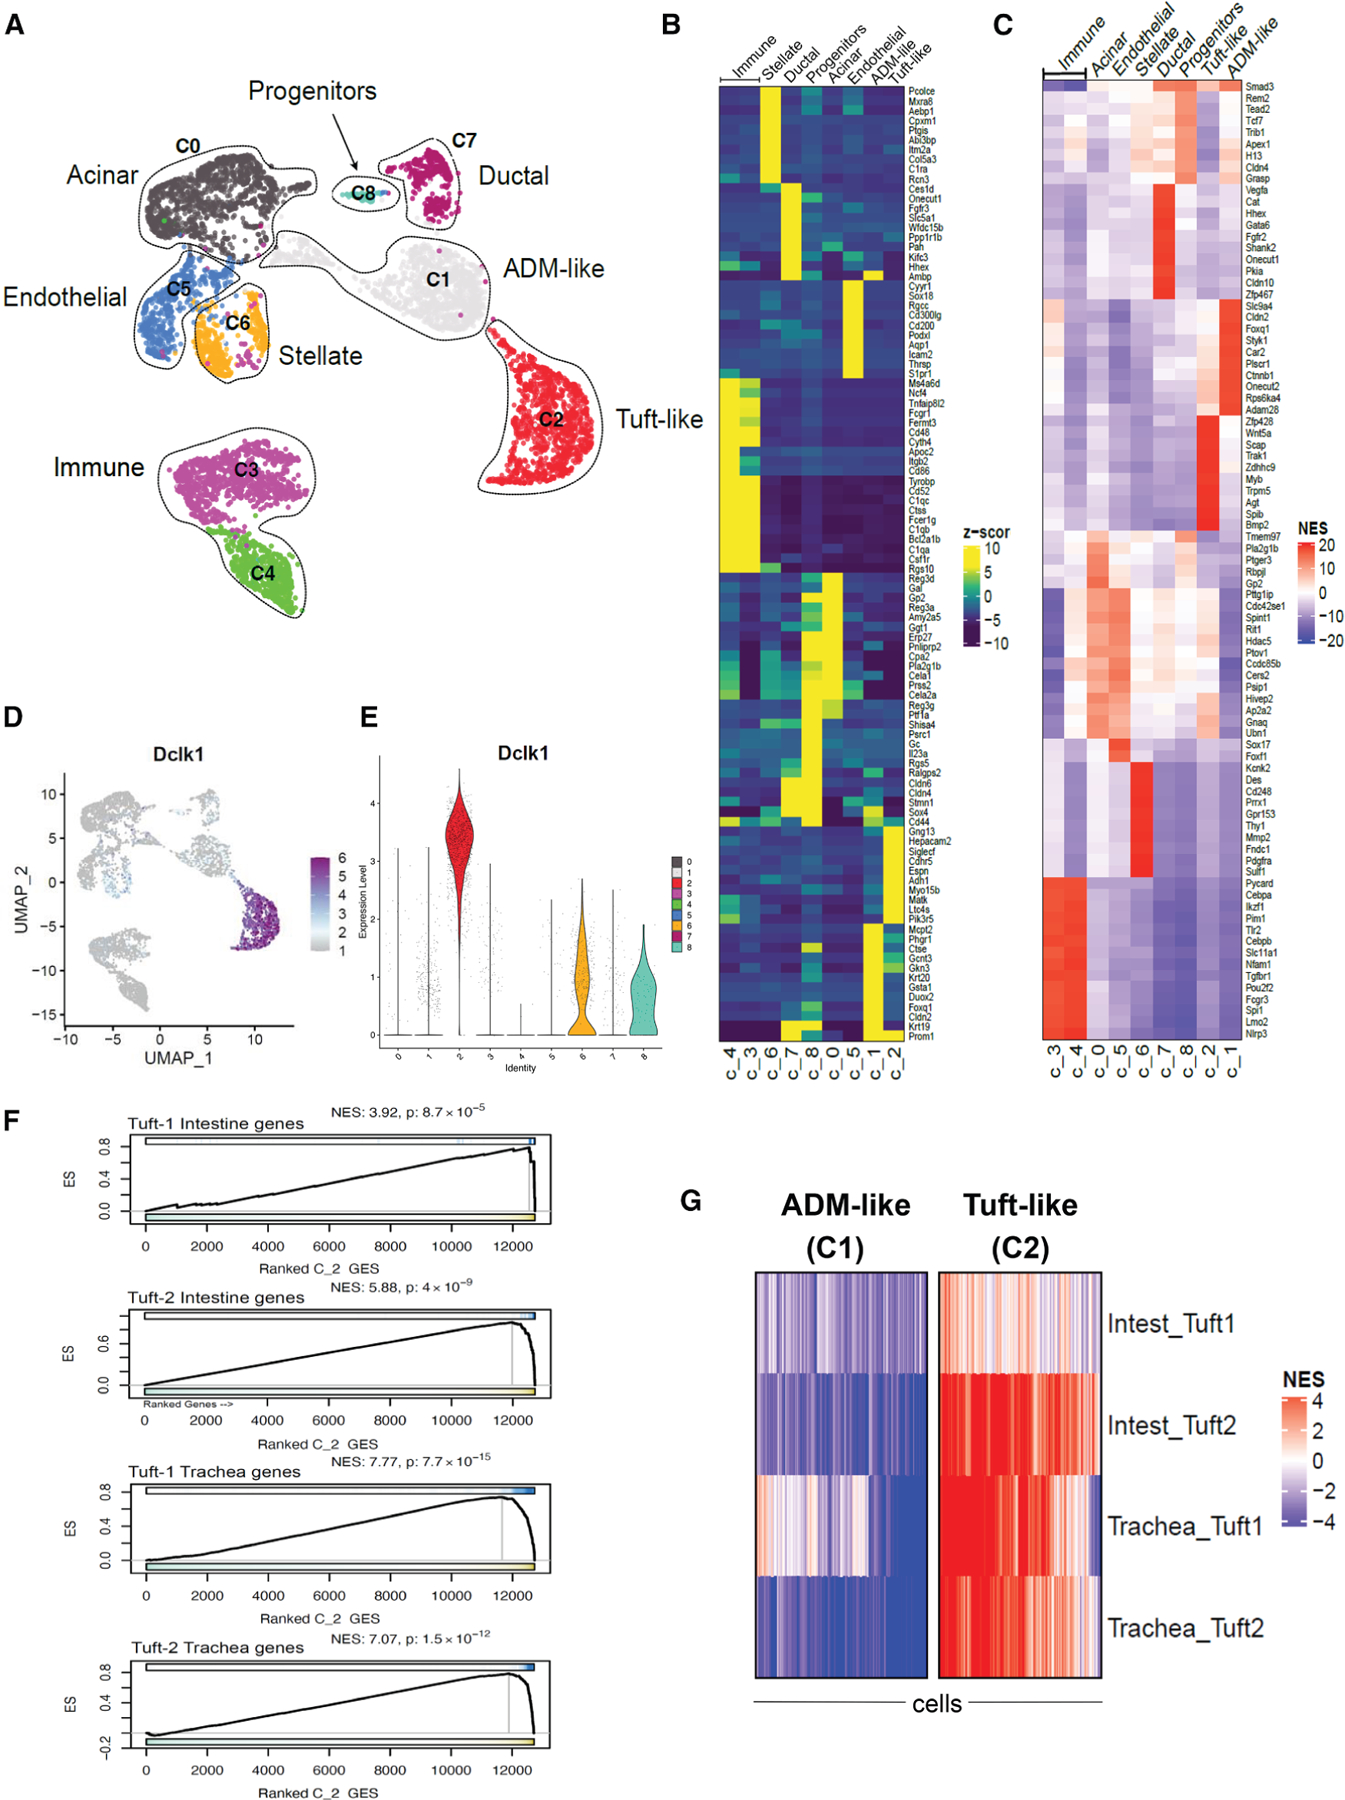
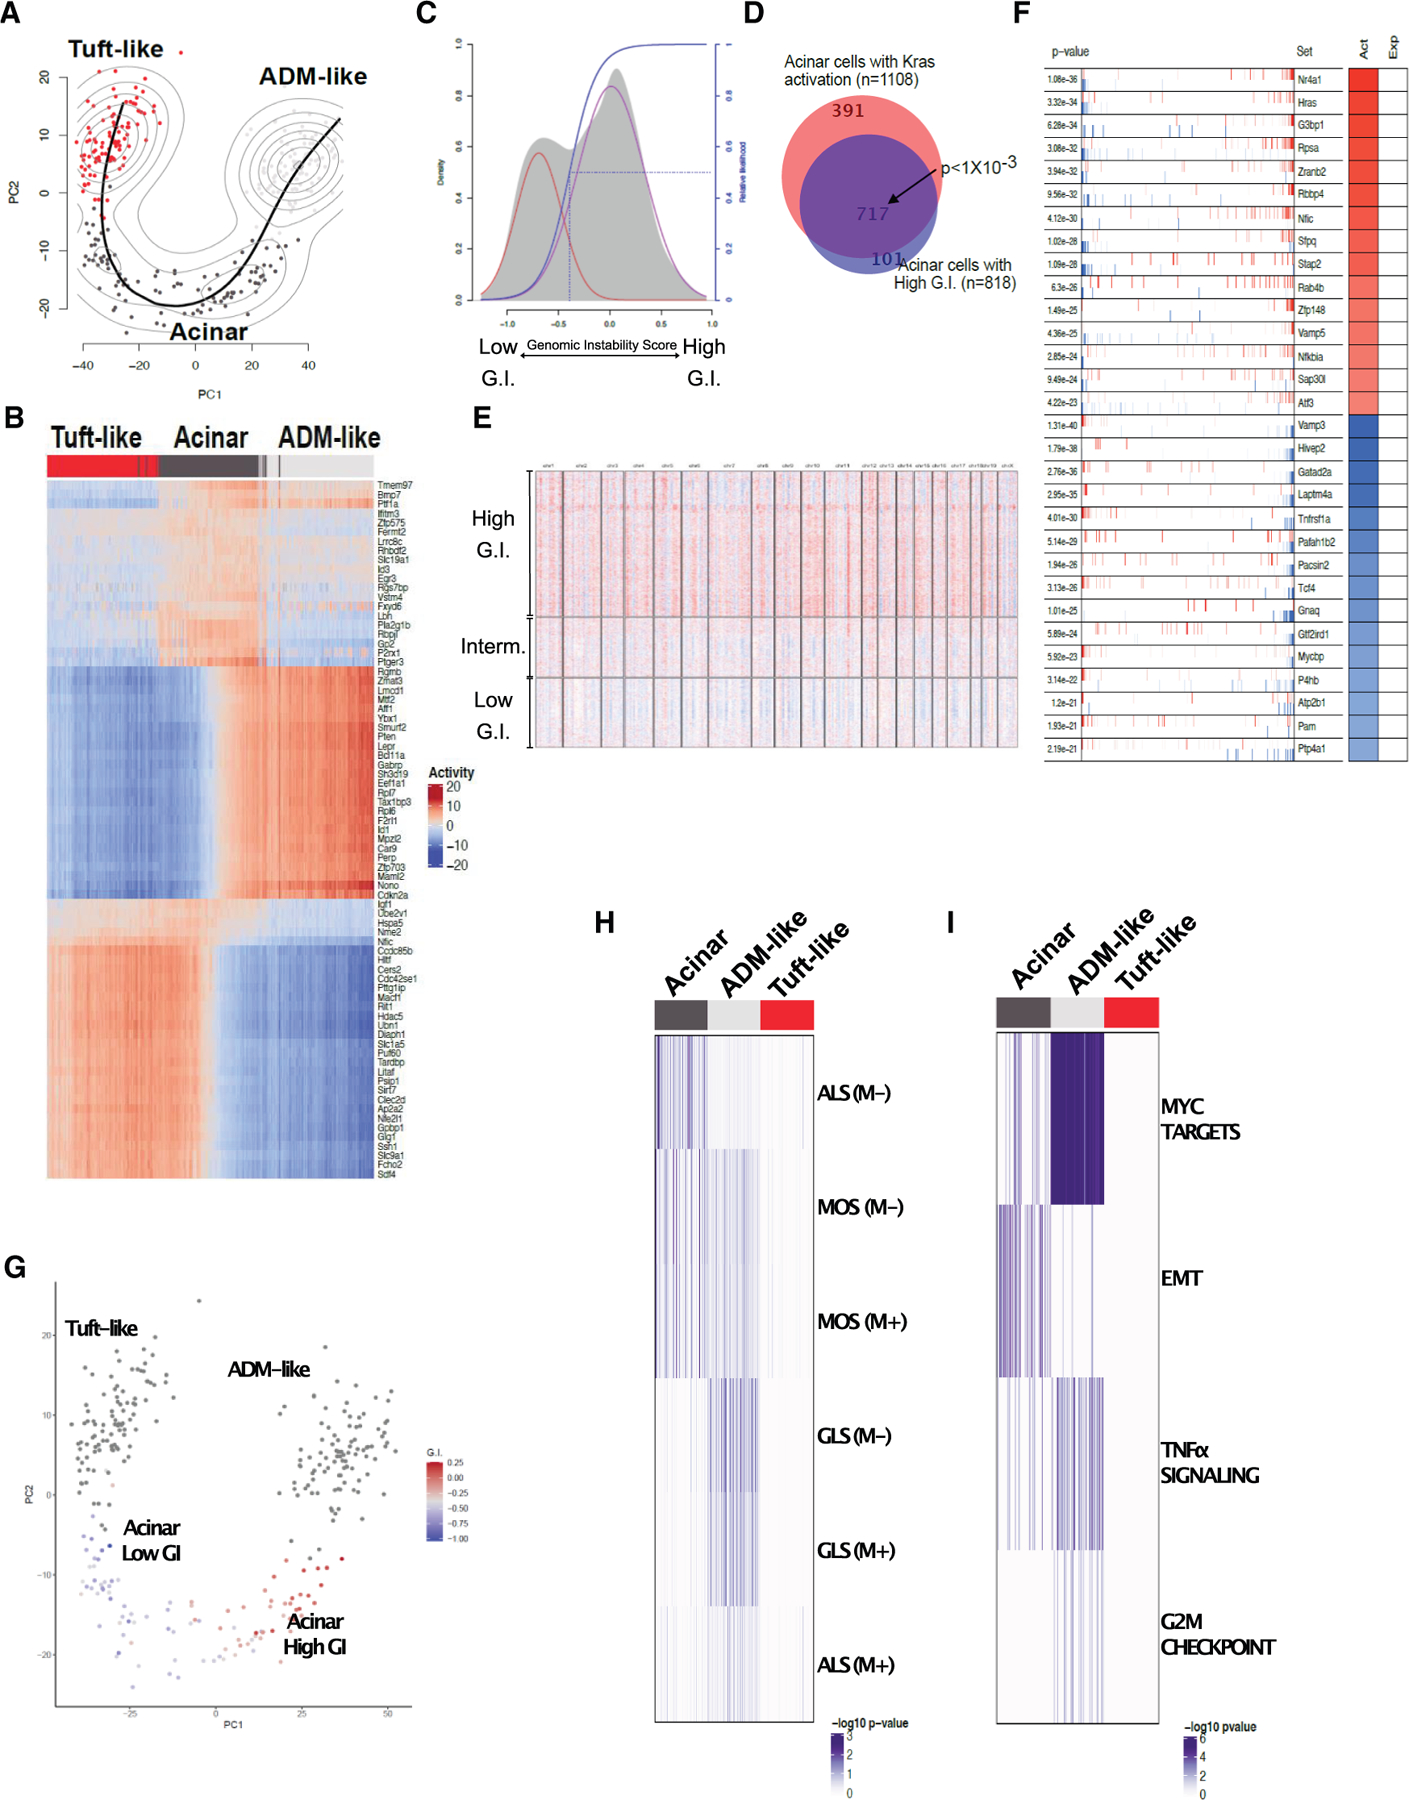
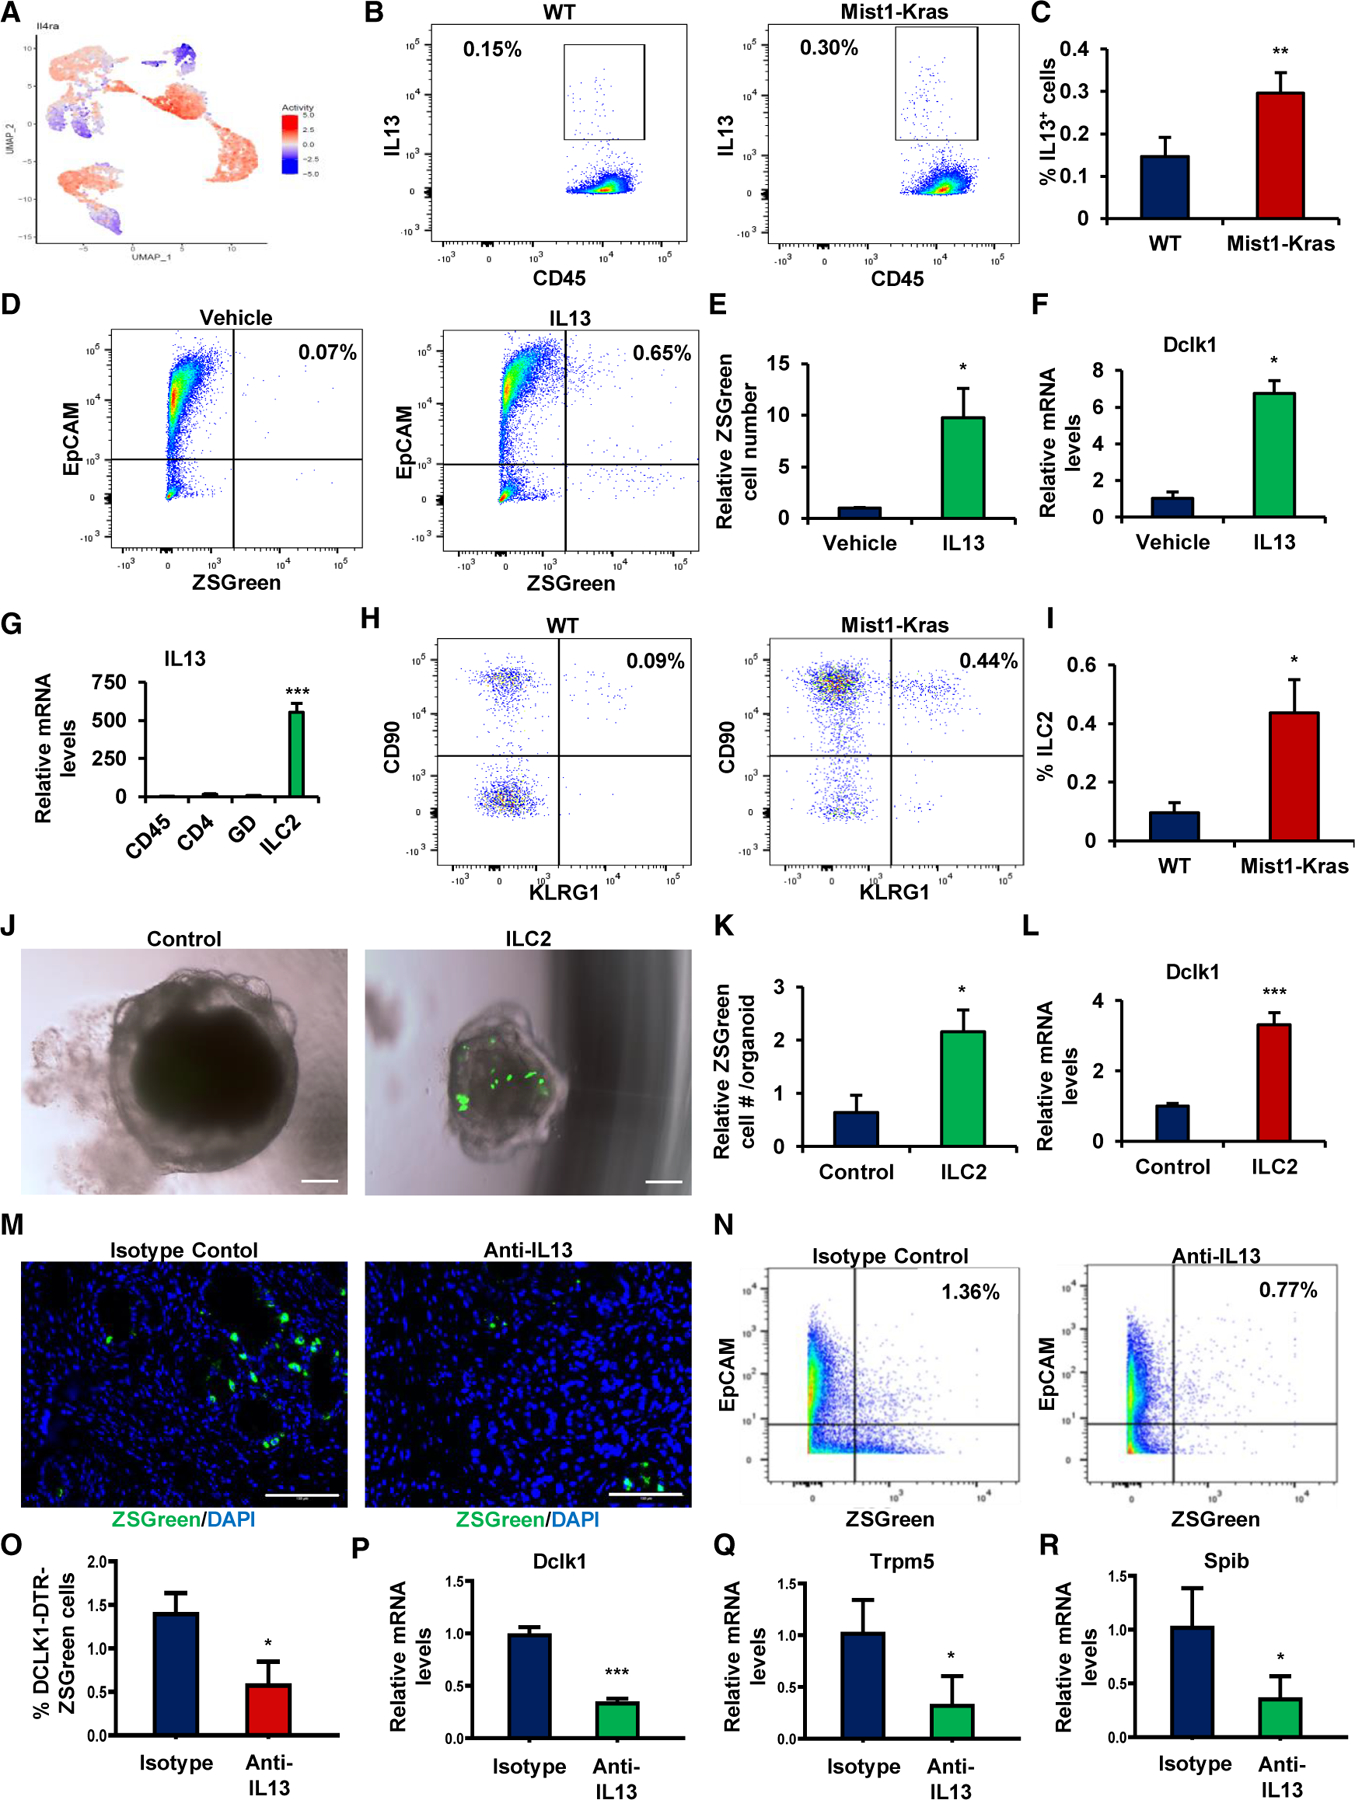
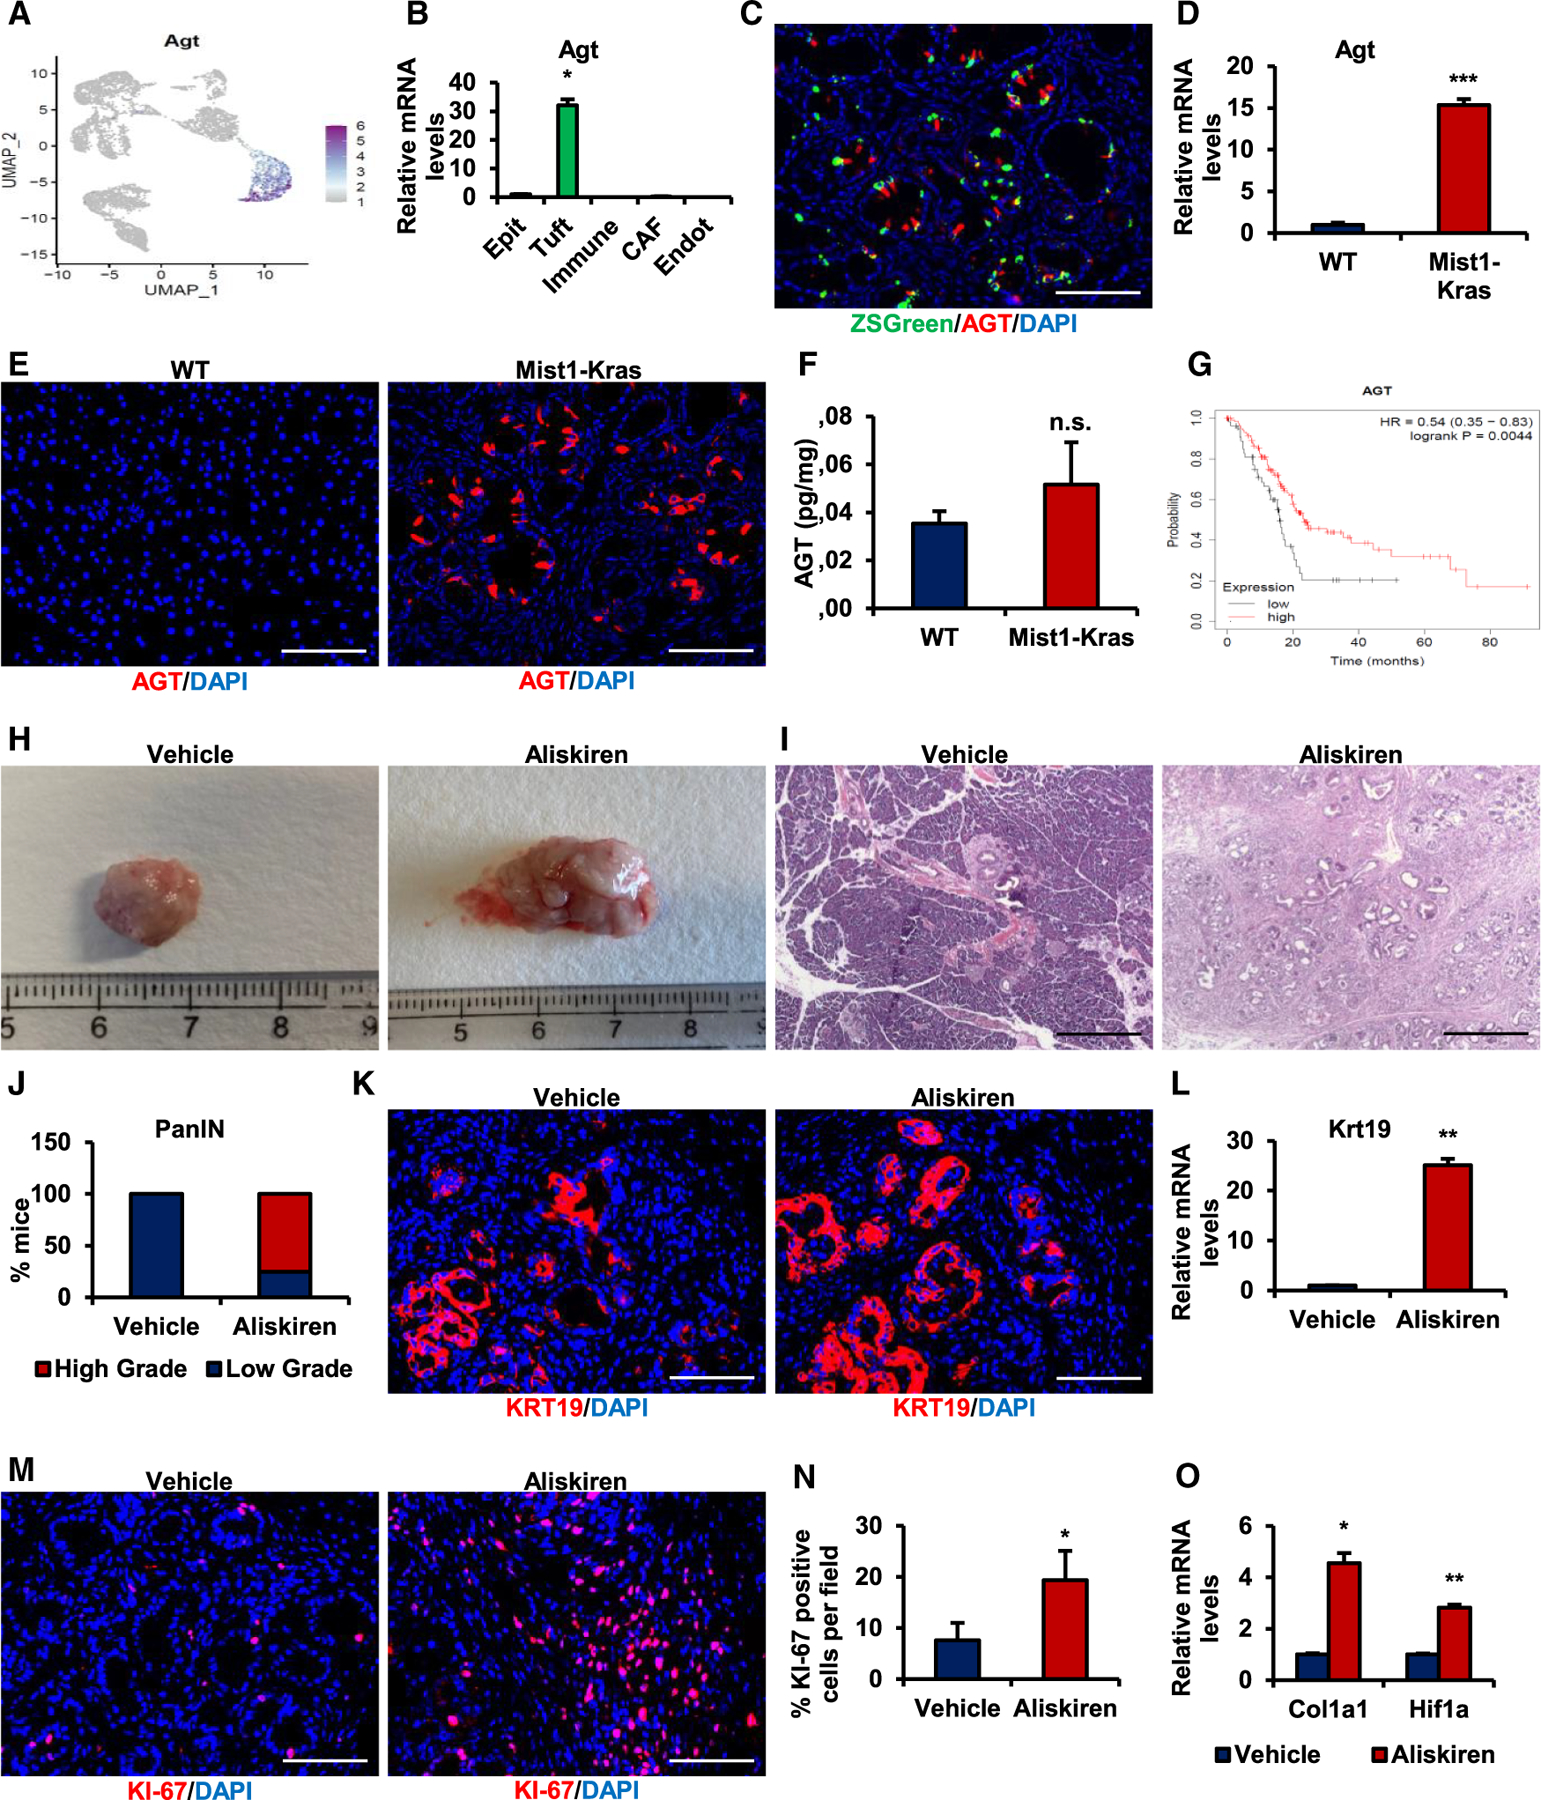
Doublecortin-like kinase 1 (Dclk1) expression identifies cells that are rare in normal pancreas but occur with an increased frequency in pancreatic neoplasia. The identity of these cells has been a matter of debate. We employed Dclk1 reporter mouse models and single-cell RNA sequencing (scRNA-seq) to define Dclk1-expressing cells. In normal pancreas, Dclk1 identifies subsets of ductal, islet, and acinar cells. In pancreatic neoplasia, Dclk1 identifies several cell populations, among which acinar-to-ductal metaplasia (ADM)-like cells and tuft-like cells are predominant. These two populations play opposing roles, with Dclk1+ ADM-like cells sustaining and Dclk1+ tuft-like cells restraining tumor progression. The generation of Dclk1+ tuft-like cells requires the transcription factor SPIB and is sustained by a paracrine loop involving type 2 innate lymphoid cells (ILC2s) and cancer-associated fibroblasts (CAFs) that provide interleukin (IL)-13 and IL-33, respectively. Dclk1+ tuft-like cells release angiotensinogen to restrain tumor progression. Overall, our study defines pancreatic Dclk1+ cells and unveils a protective tuft cell-ILC2 axis against pancreatic neoplasia.

Keywords: CP: Cancer; Dclk1; ILC2; pancreatic neoplasia; tuft cell.


Conflict of interest statement

Declaration of interests P.L. is director of Single-Cell Systems Biology at DarwinHealth, Inc., a company that has licensed some of the algorithms used in this article from Columbia University. A.C. is founder, equity holder, and consultant of DarwinHealth, Inc. Columbia University is also an equity holder in DarwinHealth, Inc.

Figures

Figure 1.
Figure 1.. Characterization of Dclk1+ cells in normal pancreas
Normal pancreas of Dclk1-DTR-ZsGreen mice.(A) Flow cytometry analysis of single cells for EpCAM and ZsGreen. (B) Immunofluorescence (IF) for amylase (AMY), keratin 19 (KRT19), and insulin (INS). (C) Quantification of ZsGreen cells localized in acini, ducts, and islets based on IF. (D) Flow cytometry analysis of ZsGreen+ cells for CD133 and CD49f. (E) Quantification of relative ZsGreen cell number within CD49f+CD133 and CD49f+CD133 populations. (F) RT-qPCR for expression of Amy, Krt19, and Ins in EpCAM+ZsGreen+ cells. (G–J) IF for nestin (NES) and acetylated tubulin (AcTUB) and related quantifications. (K) ZsGreen expression in non-adherent spheres grown. (L and M) Flow cytometry analysis of non-adherent spheres for EpCAM and ZsGreen and related quantification. (N) RT-qPCR for Dclk1 expression in non-adherent spheres. Scale bars: 100 μm. Means ± SD. Statistical significance was evaluated by Student’s t test. *p ≤ 0.05, **p ≤ 0.01, and ***p ≤ 0.001; n.s., not significant.
Figure 2.
Figure 2.. Single-cell transcriptomic and protein activity profiling of Dclk1+ normal pancreatic cell
(A) Uniform manifold approximation and projection (UMAP) based on VIPER activity showing different cell types identified by cluster analysis in Dclk1+ normal cells. (B) Heatmap showing differential expression between cell types in Dclk1+ normal cells. (C) Heatmap showing differential protein activity, as inferred by the VIPER algorithm, between cell types in Dclk1+ normal cells. (D–F) UMAPs showing differential expression of marker genes across different cell types in Dclk1+ normal cells. (G and H) Heatmaps showing the enrichment of publicly available gene expression signatures in ductal, islet, and acinar clusters identified in Dclk1+ normal cells. The p values were estimated by one-tailed gene set enrichment analysis (GSEA) with 1,000 permutations. (I) Dot plot shows the gene expression levels of tuft cell markers.
Figure 3.
Figure 3.. Single-cell transcriptomic and protein activity profiling of Dclk1+ normal pancreatic cells
(A) Hematoxylin and eosin (H&E) staining of pancreas from Mist1-Kras-Dclk1-DTR-ZsGreen mice and KPC-Dclk1-DTR-ZsGreen mice (area with advanced neoplasia) at 16 weeks. (B and C) Flow cytometry analysis for EpCAM and ZsGreen and related quantification. (D) Quantification of ZsGreen+ cells expressing KI-67 based on IF. (E) IF of pancreas of Mist1-Kras-Dclk1-ZsGreen-Rosa26-TdTomato mice not induced with tamoxifen (no KRAS) and 4, 8, and 16 weeks after tamoxifen administration for ZsGreen and TdTomato (TdTom). (F) IF of pancreas of Mist1-Kras-Dclk1-ZsGreen showing ZsGreen cells with low (ZsGreenLow) or high expression (ZsGreenHi). (G) Flow cytometry analysis of single TdTomato+ZsGreenLow and TdTomato+ZsGreenHi cells isolated from pancreas of Mist1-Kras-Dclk1-DTR-ZsGreen-Rosa26-TdTomato. (H) RT-qPCR for the expression of Dclk1, Trpm5, Cd24a, and Alox5 in cells isolated in (G). (I) IF for AcTUB. (J and K) Flow cytometry for CD133 and CD44 and related quantification. (L and M) Organoids and related quantification. Scale bars: 100 μm. Means ± SD. Statistical significance was evaluated by Student’s t test; *p ≤ 0.05, **p ≤ 0.01, and ***p ≤ 0.001; n.s., not significant.
Figure 4.
Figure 4.. Single-cell analysis of Dclk1+ cell states during early and late pancreatic tumorigenesis
(A) UMAP based on VIPER activity showing different cell types identified by cluster analysis, including Dclk1+ normal cells and Dclk1+ cells after Kras activation at 2 and 16 weeks. (B) Heatmap showing differential expression across cell types. (C) Heatmap showing differential protein activity across cell types. (D) UMAP showing Dclk1 expression. (E) Violin plots showing Dclk1 expression across clusters/cell types. (F) GSEA plots showing the enrichment of Tuft gene expression signatures derived from intestine and trachea in the gene expression signature of the tuft-like cell cluster (C2). Normalized enrichment score (NES) and p values were estimated by one-tailed GSEA with 1,000 permutations. (G) Heatmaps showing the enrichment of Tuft gene expression signatures derived from intestine and trachea in ADM-like (C1) and tuft-like (C2) cells. Normalized enrichment scores were estimated by one-tailed GSEA with 1,000 permutations.
Figure 5.
Figure 5.. Genomic instability and cell fate trajectories of Dclk1+ cells during early Kras-driven transformation
(A) PCA plot shows pseudo-trajectory analysis across tuft-like, acinar, and ADM-like cells. The most representative cells (n = 100) of each cluster/cell type were selected by silhouette analysis. (B) Heatmap showing top differential activated proteins of tuft-like, acinar, and ADM-like cells. Columns represent cells and are sorted based on the pseudo-trajectory. (C) Density plot showing distribution of genomic instability score (GIS) inferred from gene expression profiles of acinar cells with Kras activation at 2 weeks, compared to normal acinar cells. (D) Venn diagram showing the overlap between acinar cells with Kras activation after 2 weeks and acinar cells with high genomic instability as inferred by CNV analysis of single-cell gene expression profiles. The p value was estimated by Fisher test as implemented in the GenOverlap package. (E) Heatmap showing CNV inferred from single-cell gene expression profiles of acinar cells with Kras activation after 2 weeks compared to normal acinar cells. Columns represent genomic regions and rows represent cells. Red indicates amplification, blue indicates deletion. (F) VIPER plot shows the top differentially activated proteins between acinar cells with Kras activation after 2 weeks and high GIS compared to normal acinar cells. Regulatory target genes in each protein regulon (rows) are represented by vertical lines projected along the gene-expression signature. Red vertical lines represent positive targets, and blue lines represent negatively regulated targets. The two columns on the right represent the activation (Act) and gene expression (Exp) status of each regulator. (G) PCA plot showing the GIS of the acinar cells after 2 weeks of Kras activation, including tuft-like, acinar, and ADM-like cells. GIS correlates with pseudo-trajectory analysis (A), with the subset of acinar cells primed toward tuft-like cells showing lower GIS and acinar cells primed toward ADM-like cells showing higher GIS. The most representative cells (n = 100) of each cluster/cell type were selected for this analysis based on the silhouette analysis. (H) Heatmap showing the enrichment of the PDAC human subtypes in tuft-like, acinar, and ADM-like cells. The enrichment was estimated by one-tailed aREA test (as implemented in the VIPER package) with the top differentially activated proteins (n = 50) of each human subtype in protein activity signature of tuft-like, acinar, and ADM-like cells. (I) Heatmap showing the enrichment of the most enriched hallmark gene sets (www.gsea-msigdb.org) in tuft-like, acinar, and ADM-like cells. The enrichment was estimated by one-tailed aREA test. GSEA were performed on the most representative cells (n = 100) of each cluster/cell type selected based on the silhouette analysis.
Figure 6.
Figure 6.. IL-13-IL-4RA signaling regulates Dclk1+ cell expansion in Kras-driven pancreatic neoplasia
(A) UMAP showing VIPER-inferred differential protein activity of IL-4RA in Dclk1+ cells. (B and C) Flow cytometry analysis for IL-13 expression in immune cells (CD45) isolated from normal pancreas and pancreas from Mist1-Kras mice and related quantification. (D and E) Flow cytometry analysis for EpCAM and ZsGreen of organoids from pancreas of Kras-Dclk1-DTR-ZsGreen mice in the presence of vehicle or IL-13 and related quantification. (F) RT-qPCR for the expression of Dclk1. (G) RT-qPCR for the expression of Il13 in different immune cell populations in pancreas from Mist1-Kras mice: CD45+ immune cells, CD4+ T cells, γδ T cells, and ILC2s (LinCD45+CD127+CD90+KLRG1+). (H and I) Flow cytometry analysis for ILC2s in normal and Mist1-Kras mice and related quantification. (J and K) ZsGreen expression in organoids from Kras-Dclk1-DTR-ZsGreen pancreas cultured with or without ILC2s, with quantification. (L) RT-qPCR for the expression of Dclk1 in organoids. (M) IF for ZsGreen of pancreas from Mist1-Kras-Dclk1-DTR-ZsGreen mice treated with control IGG or anti-IL-13 blocking antibody for 8 weeks. (N and O) Flow cytometry analysis for EpCAM and ZsGreen and related quantification. (P–R) RT-qPCR for the expression of Dclk1, Cd24a, and Spib. Scale bars: 100 μm. Means ± SD. Statistical significance was evaluated by Student’s t test; *p ≤ 0.05, **p ≤ 0.01, and ****p ≤ 0.001; n.s., not significant.
Figure 7.
Figure 7.. AGT expression in Dclk1+ cells and its role in pancreatic tumor progression
(A) UMAP shows Agt expression in Dclk1+ cells. (B) RT-qPCR for Agt in epithelial cells (Epit), tuft cells, immune cells, CAFs, and endothelial cells (Endot) from Mist1-Kras-Dclk1-DTR-ZsGreen mice. (C) IF for ZsGreen and AGT. (D–F) RT-qPCR, IF, and ELISA for AGT in normal and Mist1-Kras pancreas. (G) Kaplan-Meier plot of overall survival in PDAC patients with high vs. low Agt expression. (H) Pancreas from Mist1-Kras mice treated with vehicle or aliskiren for 8 weeks. (I and J) H&E with PanIN grade quantification. (K) IF for KRT19. (L) RT-qPCR for Krt19. (M and N) IF for KI-67 with quantification. (O) RT-qPCR for Col1a1, Acta2, Cd31, and Hif1a. Scale bars: 100 μm. Means ± SD. Statistical significance was evaluated by Student’s t test; *p ≤ 0.05, **p ≤ 0.01, and ***p ≤ 0.001; n.s., not significant.

Update of

Similar articles

References

    1. Siegel RL, Miller KD, Fuchs HE, and Jemal A (2021). Cancer Statistics, 2021. CA Cancer J. Clin 71, 7–33. 10.3322/caac.21654. - DOI - PubMed
    1. Cancer Genome Atlas Research Network, and Cancer Genome Atlas Research Network (2017). Integrated Genomic Characterization of Pancreatic Ductal Adenocarcinoma. Cancer Cell 32, 185–203. e13. 10.1016/j.ccell.2017.07.007. - DOI - PMC - PubMed
    1. Brembeck FH, Schreiber FS, Deramaudt TB, Craig L, Rhoades B, Swain G, Grippo P, Stoffers DA, Silberg DG, and Rustgi AK (2003). The mutant K-ras oncogene causes pancreatic periductal lymphocytic infiltration and gastric mucous neck cell hyperplasia in transgenic mice. Cancer Res 63, 2005–2009. - PubMed
    1. Guerra C, Schuhmacher AJ, Cañamero M, Grippo PJ, Verdaguer L, Pérez-Gallego L, Dubus P, Sandgren EP, and Barbacid M (2007). Chronic pancreatitis is essential for induction of pancreatic ductal adenocarcinoma by K-Ras oncogenes in adult mice. Cancer Cell 11, 291–302. 10.1016/j.ccr.2007.01.012. - DOI - PubMed
    1. Gidekel Friedlander SY, Chu GC, Snyder EL, Girnius N, Dibelius G, Crowley D, Vasile E, DePinho RA, and Jacks T (2009). Context-dependent transformation of adult pancreatic cells by oncogenic K-Ras. Cancer Cell 16, 379–389. 10.1016/j.ccr.2009.09.027. - DOI - PMC - PubMed

MeSH terms

Substances

LinkOut - more resources