. 2025 May 23;9(6):e0717.
doi: 10.1097/HC9.0000000000000717. eCollection 2025 Jun 1.

Cholangiocarcinoma cells direct fatty acids to support membrane synthesis and modulate macrophage phenotype

Affiliations

Cholangiocarcinoma cells direct fatty acids to support membrane synthesis and modulate macrophage phenotype

Michele Dei Cas et al. Hepatol Commun. .

Abstract

Background and aims: Cholangiocarcinoma (CCA) is a globally rare, increasingly incident cancer. Metabolic reprogramming is common in cancer cells, and altered lipid homeostasis favors tumor development and progression. Previous studies have described lipid deregulation in HCC cells, while in CCA, the lipidome profile is still poorly characterized.

Methods: We used liquid chromatography-tandem mass spectrometry to examine the lipid level profile of intrahepatic CCA (iCCA) and non-tumor surrounding tissue from patients, as well as in patients' and healthy controls' sera.

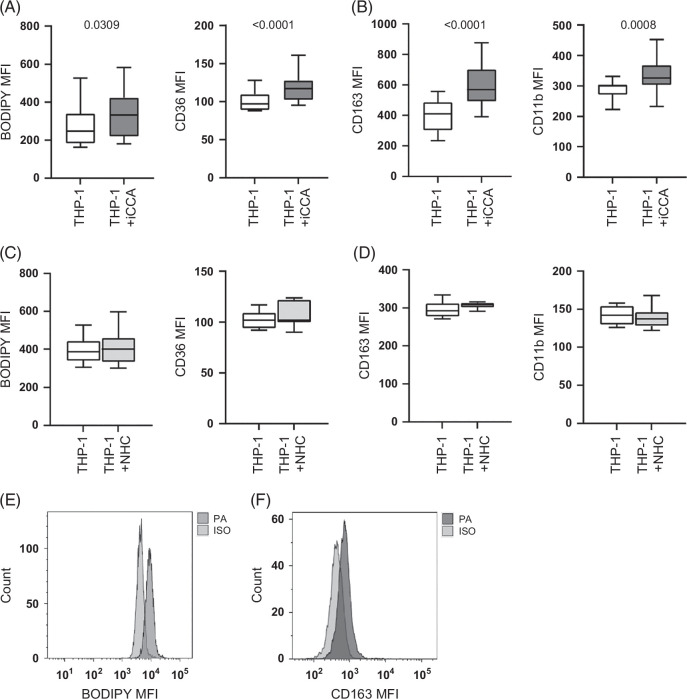
Results: All lipid classes were upregulated in tumor specimens and iCCA-derived sera. Newly synthesized fatty acids (FAs) accumulated in iCCA and were only marginally directed to mitochondrial β-oxidation and scarcely folded in lipid droplets as neutral species. Metabolic flux assay showed that FAs were instead redirected toward plasma membrane formation and remodeling, being incorporated into phospholipids and sphingomyelin. A distinct lipid droplet and macrophage distribution was revealed by immunohistochemistry and Imaging Mass Cytometry. Lipid droplets were fewer in iCCA than in normal tissue and present mainly in the intratumoral fibrous septa and in M2 macrophages. Monocytes modified their lipid content and phenotype in the presence of iCCA cells, and the same effect could be recapitulated by FA supplementation.

Conclusions: Our results reveal a profound alteration in the lipid content of iCCA tissues and demonstrate that FA accumulation prompts iCCA aggressiveness by supporting membrane biogenesis, generating bioactive lipids that boost proliferation, and by modifying macrophage phenotype.

Keywords: cholangiocarcinoma; fatty acid; lipid droplets; liver cancer; macrophages.


Conflict of interest statement

AL reports consulting fees from Advanz Pharma, AlfaSigma, Takeda, Ipsen, Dr Falk, Gilead, and GSK, speaker fees from Gilead, GSK, AbbVie, MSD, Advanz Pharma, AlfaSigma, GSK, and Incyte, and travel support from Ipsen. The remaining authors have no conflicts to report.

Figures

None
Graphical abstract
FIGURE 1
FIGURE 1
Lipidomic profile was altered in iCCA-derived tissue and sera. (A) Two-dimensional representation of PCA of the untargeted lipidomic profile of NT (light blue) and matched iCCA (pink) tissues (n=19, upper panel), and in HC-derived (light blue) and iCCA-derived (pink) sera (HC=14; iCCA=18, lower panel). (B) Heatmap showing the relative concentration of lipid subclasses in NT and matched iCCA tissues (n=19), using normalized intensities of lipids reordered in classes. (C) Analysis of FAs in NT and matched iCCA tissues (n=19). (D) Analysis of FAs in HC and iCCA-derived sera (HC=14; iCCA=18). (E) Analysis of saturated and unsaturated FAs in NT and matched iCCA tissues (n=19). iCCA-derived unsaturated FAs were separated into MUFA and PUFA (F). (G) Analysis of saturated and unsaturated FAs in HC-derived and iCCA-derived sera (HC=14; iCCA=18). iCCA-derived unsaturated FAs were separated into MUFA and PUFA (H). All lipidomic profiles were performed using high-resolution mass spectrometry. Shown are medians and 95% CI. The Wilcoxon test was used to compare NT and matched iCCA tissue, whereas Mann–Whitney was applied in comparing data from HC-derived and iCCA-derived sera. Abbreviations: FAs, fatty acids; HC, healthy control; iCCA, intrahepatic cholangiocarcinoma; MUFA, monounsaturated fatty acid; NT, non-tumoral; PUFA, polyunsaturated fatty acid.
FIGURE 2
FIGURE 2
Fatty acid synthesis is increased in iCCA. (A) Expression of the ACACA gene was measured in NT and matched iCCA tissues (n=17). A paired t test was used to compare data. (B) The correlation between ACACA and MKI67 expression was analyzed in 16 iCCA tumor tissues. (C–E and H) Expression of the membrane-associated transporters FABP5, FABP4, CD36, and LDLR gene in NT and matched iCCA tissues (FABP5, n=17; FABP4, n=16; CD36, n=17; LDLR, n=13). Wilcoxon test was used to compare data, except for FABP5 expression, where a paired t test was used. (F and G) CD36 expression in G2 (n=8) and G3 (n=9) tumors and in iCCA tissue stratified according to tumor size in millimeters (iCCA <5, n=7; iCCA >5, n=9). Median, minimum, and maximum values are shown in the box and whiskers plots; the unpaired t test was used to compare data. Abbreviations: ACACA, acetyl-CoA carboxylase alpha; CD36, cluster of differentiation 36; iCCA, intrahepatic cholangiocarcinoma; LDLR, low-density lipoprotein receptor; NT, non-tumoral.
FIGURE 3
FIGURE 3
Fatty acid flux toward β oxidation is impaired in iCCA tissue. (A and B) Expression of the ACADM gene in NT, matched iCCA tissues (n=16), and in iCCA tissue stratified according to G stage (iCCA-G2=7; iCCA-G3=9). The paired t test was used to compare data. (C and D) ACADM protein level was measured in NT, matched iCCA tissues (n=19), and in iCCA tissue stratified according to G stage (iCCA-G2=9; iCCA-G3=10). Representative image showing a Western blot of ACADM (lane 1=standard ladders; lanes 2, 3, 6, and 7=iCCA tissues; lanes 4, 5, 8, and 9=NT tissues). Shown are medians and 95% CI. The Wilcoxon test was used to compare data. (E) The correlation between ACADM and MKI67 expression was analyzed in 15 iCCA tissues. CAR content was quantified in NT, matched iCCA tissues (F; n=19), and in HC and iCCA-derived sera (G; HC=14; iCCA=18). Shown are medians and 95% CI. The Wilcoxon test was used to compare NT and matched iCCA tissue, whereas the Mann–Whitney U test was applied when comparing data from HC and iCCA-derived sera. (H) Expression of SLC25A20 was measured in NT and matched iCCA tissues (n=17). The paired t test was used to compare data. Abbreviations: ACADM, acyl-CoA dehydrogenase medium chain; CAR, acylcarnitine; iCCA, intrahepatic CCA; MKI67, proliferation marker Ki-67; NT, non-tumoral.
FIGURE 4
FIGURE 4
Glycolysis and pathways raising glucose content are enhanced in iCCA tissue. (A) Analysis of FBP1 gene expression in NT, matched iCCA tissues (n=19) and in iCCA tissue stratified according to tumor G stage (B, iCCA-G2=8; iCCA-G3=11), to the presence of vascular invasion (C, Y=yes, n=7; N=no, n=10) and to tumor size in millimeters (D, iCCA<5, n=7; iCCA>5, n=10). Vascular invasion was histologically defined by tumor cells infiltrating vessel walls with associated thrombi, or intravascular cancer cells mixed with thrombi. Median, minimum, and maximum values are shown in the box and whiskers plots. The Wilcoxon test was used to compare NT and matched iCCA tissue, while the unpaired t test was used to compare other data. Expression of the GLUT1 gene (E) was measured in NT and matched iCCA tissues (n=17) and in iCCA tissue stratified according to G stage (F, iCCA-G2=8, iCCA-G3=9). The Wilcoxon test was used to compare NT and matched iCCA tissue, while the unpaired t test was used to compare G2 and G3 tumors. Median, minimum, and maximum values are shown in the box and whiskers plots. (G, left panel) Expression of the GBA gene in NT and matched iCCA tissues (n=16). A paired t test was used. (G, right panel) The correlation between ACACA and MKI67 expression was analyzed in 17 iCCA tumor tissues. (H) Analysis of the glycated Cers (HexCer and LacCer, upper and lower panels, respectively) in NT and matched iCCA tissues (n=19, left panel), and in HC-derived and iCCA-derived sera (iCCA=29, HC=23, right panel). Shown are medians and 95% CI. The Wilcoxon test was used to compare matched data, while the Mann–Whitney U test was used to compare unpaired data. Abbreviations: FBP1, fructose-1,6-bisphosphatase; GBA, glucocerebrosidase; HC, healthy control; HexCer, hexosylceramide; iCCA, intrahepatic cholangiocarcinoma; LacCer, lactosylceramides; MKI67, proliferation marker Ki-67; NT, non-tumoral.
FIGURE 5
FIGURE 5
Lipid droplets, CD163+ M2 macrophage distribution, and perilipin expression in non-neoplastic parenchyma and in iCCA. (A1) In non-neoplastic parenchyma, small-sized and large-sized LDs (yellow-orange vacuoles) were detected in the cytoplasm of non-neoplastic cells, while bile ductular structures (asterisk) were negative. Hepatocytes also contained LDs (square). (A2) CD163 staining of A1 tissue identifies macrophages (circle) and hepatocytes (square) containing LDs. (B1) iCCA parenchyma showing a cluster of cells containing small-sized and medium-sized lipidic vacuoles. (B2) CD163 staining of B1 tissue highlights groups of LDs in the cytoplasm of CD163 immunopositive macrophages (circles). (C1) LDs distribution in fibrous bands (F) delimiting neoplastic growth between the liver parenchyma (N) and the tumor (K). The LDs are mainly detected adjacent to the tumor growing boundaries. (D1) Abundant, homogeneously distributed deposits of small-sized and medium-sized LDs mainly localized in the intratumoral fibrous bands (F) among intratumoral growing nodules (K). (C2 and D2) CD163 staining of C1 and D1 tissues. In C2, CD163+ cells containing LDs were found mainly next to iCCA cells. In D2, CD163+ immune cells containing LDs were identified in the fibrous part and sometimes intermingled with growing iCCA cells (circles). The images are the most representative of the 6 biopsies analyzed. (E) Spatial distribution of immune cell subsets within the iCCA tissue analyzed through Imaging Mass Cytometry. Marker expression profiles across all the acquired regions of interest (ROI) using MCD viewer visualization software are shown. A representative region of interest is shown at a higher magnification, together with its cell mask. (F) Shown is a distance plot of cell populations from the tumor patch. (G) Heatmap showing the 8 identified cell neighborhoods compositions and the relative cell type proportions z-score normalized per column (top). Cell masks colored by relative cell-neighborhood (bottom). (H) Expression of the perilipins PLIN1 and PLIN2 was measured in NT, matched iCCA tissues (n=17), and in iCCA tissue stratified according to G stage (iCCA-G2, n=8; iCCA-G3, n=9). The Wilcoxon test was used to compare matched data, while the Mann–Whitney U test was used to compare unpaired data. Abbreviations: iCCA, intrahepatic cholangiocarcinoma; NT, non-tumoral; PLIN, perilipins; TAM, tumor-associated macrophages; Tc, T cytotoxic.
FIGURE 6
FIGURE 6
Increased lipid content and phenotype alterations in THP-1 monocytes co-cultured with iCCA cells. The lipid content was measured in THP-1 after 4 hours of co-culture with 7 primary iCCA cell cultures (A, left panel) or NHC cell cultures (C, left panel) as BODIPY 505/515 expression (MFI). The THP-1 phenotype was evaluated as MFI of CD36 (A and C, right panels), CD163 (B and D, left panels), and CD11b (B and D, right panels). Shown are medians and 95% CI. The Mann–Whitney U test was used to compare data. The BODIPY 505/515 (E) and CD163 (F) expression after treatment with 200 μM of PA or ISO is represented. Abbreviations: iCCA, intrahepatic cholangiocarcinoma; ISO, isopropanol; MFI, mean fluorescence intensity; NHC, normal human cholangiocyte; PA, palmitic acid.
FIGURE 7
FIGURE 7
Quantitative metabolic flux assay indicates that fatty acid mobilization was directed to membrane remodeling and formation. Analysis of different membrane-forming lipid classes. PL species and SM (A) and Chol (B) in NT and matched iCCA tissues (n=19). (C, D) Analysis of the major neutral storage lipids in NT and matched iCCA tissues (n=19). Shown are medians and 95% CI. The Wilcoxon test was used to compare data. Analysis of storage (TG) and membrane-forming lipids PC, PE, and SM in NHC cell cultures and in primary iCCA cell cultures (n=3) at 6 (E) and 12 (F) hours. Panel (G) reports the membrane-to-storage lipids ratio. Shown are medians and 95% CI. The Mann–Whitney U test was used to compare data. Abbreviations: CE, cholesteryl esters; Chol, cholesterol; DG, diacylglycerols; iCCA, intrahepatic cholangiocarcinoma; LPC, lysophosphatidylcholine; LPE, lysophosphatidylethanolamine; MG, monoacylglycerol; NHC, normal human cholangiocyte; NT, non-tumoral; PC, phosphatidylcholine; PE, phosphatidylethanolamine; PI, phosphoinositide; PS, phosphatidylserine; SM, sphingomyelin; TG, triglyceride.
FIGURE 8
FIGURE 8
Increased synthesis and extrusion from the cells support the S1P autocrine role in iCCA tissues. Analysis of S1P and its precursor Sph in NT and matched iCCA tissues (A; n=11), and in HC and iCCA-derived sera (B; HC=23, iCCA=29). Shown are medians and 95% CI. The Wilcoxon test (A) or Mann–Whitney U test (B) was used to compare data. Gene expression analysis of the main S1P metabolizing enzymes (C, D, E), the main S1P transporters (F, G), and S1P receptor 3 (H) in NT and matched iCCA tissues (SPHK1, n=10; SGPP1, n=12; SGPL1, n=7; ABCC1, n=10; SPNS2, n=11; S1PR3, n=8). The Wilcoxon test (C–E, G, and H) or paired t test (F) was used to compare data. Abbreviations: ABCC1, ATP binding cassette subfamily C member 1; HC, healthy control; iCCA, intrahepatic cholangiocarcinoma; NT, non-tumoral; S1P, sphingosine-1-phosphate; S1PR3, sphingosine-1-phosphate receptor 3; SGPL1, sphingosine-1-phosphate lyase 1; SGPP1, sphingosine-1-phosphate phosphatase 1; Sph, sphingosine; SPHK1, sphingosine kinase 1; SPNS2, SPNS lysolipid transporter 2 sphingosine-1-phosphate.

References

    1. European Association for the Study of the Liver . EASL-ILCA Clinical Practice Guidelines on the management of intrahepatic cholangiocarcinoma. J Hepatol. 2023;79:181–208; [published correction appears in J Hepatol. 2023 Nov;79(5):1342. doi: 10.1016/j.jhep.2023.09.006]. - PubMed
    1. Brindley PJ, Bachini M, Ilyas SI, Khan SA, Loukas A, Sirica AE, et al. . Cholangiocarcinoma. Nat Rev Dis Primers. 2021;7:65. - PMC - PubMed
    1. Pavlova NN, Thompson CB. The emerging hallmarks of cancer metabolism. Cell Metab. 2016;23:27–47. - PMC - PubMed
    1. Snaebjornsson MT, Janaki-Raman S, Schulze A. Greasing the wheels of the cancer machine: The role of lipid metabolism in cancer. Cell Metab. 2020;31:62–76. - PubMed
    1. Paul B, Lewinska M, Andersen JB. Lipid alterations in chronic liver disease and liver cancer. JHEP Rep. 2022;4:100479. - PMC - PubMed