. 2025 May 23;11(21):eadt9446.
doi: 10.1126/sciadv.adt9446. Epub 2025 May 23.

PTMA controls cardiomyocyte proliferation and cardiac repair by enhancing STAT3 acetylation

Affiliations

PTMA controls cardiomyocyte proliferation and cardiac repair by enhancing STAT3 acetylation

Ning Liu et al. Sci Adv. .

Abstract

The adult mammalian heart has limited regenerative capacity due to the low proliferative ability of cardiomyocytes, whereas embryonic cardiomyocytes exhibit robust proliferative potential. Using single-cell RNA sequencing of embryonic hearts, we identified prothymosin α (PTMA) as a key factor driving cardiomyocyte proliferation. Overexpression of PTMA in primary mouse and rat cardiomyocytes significantly promoted cardiomyocyte proliferation and similarly enhanced proliferation in human iPSC-derived cardiomyocytes. Conditional knockout of Ptma in cardiomyocytes impaired neonatal heart regeneration. AAV9-mediated overexpression of Ptma extended the neonatal proliferative window and showed therapeutic promise for enhancing adult heart regeneration. Mechanistically, PTMA interacted with MBD3, inhibiting its deacetylation activity within the MBD3/HDAC1 NuRD complex. This inhibition increased STAT3 acetylation, which positively regulated STAT3 phosphorylation and activation of its target genes. These findings establish PTMA as a critical regulator of heart regeneration and suggest its potential as a therapeutic target for ischemic myocardial injury.


Figures

Fig. 1.
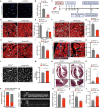
Fig. 1.. scRNA-seq of embryonic hearts reveals Ptma as a key factor driving cardiomyocyte proliferation.
(A) Schematic of the experimental design for screening cardiomyocyte proliferative factors. (B) The t-distributed stochastic neighbor embedding (t-SNE) visualization of the 15 clusters in embryonic hearts (n = 36,039 cells). ACM, atrial cardiomyocytes; VCM, ventricular cardiomyocytes; Endo, endocardial cells; EC, endothelial cells; MC, mesenchymal cells; FB, fibroblasts; SMC, smooth muscle cells; Epi, epicardial cells; IC, immune cells. (C) Violin plots of the expression of cell cycle gene Mki67 and Aurkb in VCM1-VCM6 cells. (D) Heatmap of the relationship between the blue module and cardiomyocyte proliferation traits (left), and scatter plot (right) presenting the module gene expression pattern in various stages of cardiomyocyte development. The correlation coefficients (r) values and the corresponding P values are shown in the rectangles and the brackets, respectively. (E) Gene Ontology (GO) terms of the blue module. (F) Venn diagram presenting the intersection of differential expressed genes in VCM1 and hub genes in the blue module (left), and the heatmap presenting the expression of 17 co-expressed genes in cardiomyocytes at differential heart developmental periods (right). (G to J) Representative images of EdU incorporation (G), pH3 (I) staining in neonatal mouse cardiomyocytes (NMCMs) infected with lenti-Ptma, lenti-Tubb5, and lenti-Tuba1b. Scale bars, 20 μm. Quantification of EdU (H)– and pH3 (J)–positive cardiomyocytes, n = 4. Data are presented as means ± SEM. By One-way analysis of variance (ANOVA) analysis, ***P < 0.001 (versus lenti-Ctrl); n.s. indicates that the P value is not significant. DAPI, 4′,6-diamidino-2-phenylindole.
Fig. 2.
Fig. 2.. PTMA promotes postnatal and adult cardiomyocyte proliferation in vivo.
(A) Schematic plot showing the experimental procedure for AAV9-delivered PTMA overexpression in neonatal hearts, created in BioRender (S. Gai, 2025), https://BioRender.com/q64z784, with modifications. (B to G) Representative images of immunostaining for EdU (B), pH3 (D), and Aurora B (F) heart sections. Scale bars, 5 μm [(B) and (F)] and 10 μm (D). Quantitative analysis of EdU (C)–, pH3 (E)–, and Aurora B (G)–positive cardiomyocytes at P8 mice hearts, n = 3. Data are presented as means ± SEM, by Student’s t test, *P < 0.05, **P < 0.01, and ***P < 0.001. (H) Schematic plot showing the experimental procedure for AAV9-delivered PTMA overexpression in adult hearts, created in BioRender (S. Gai, 2025), https://BioRender.com/q64z784, with modifications. (I to N) Representative images of immunostaining for EdU (I), pH3 (K), and Aurora B (M) heart sections. Scale bars, 10 μm [(I) and (M)] and 5 μm (K). Quantitative analysis of EdU (J)–, pH3 (L)–, and Aurora B (N)–positive cardiomyocytes at P70 mice hearts, n = 5. Data are presented as means ± SEM. By Student’s t test, *P < 0.05 and ***P < 0.001.
Fig. 3.
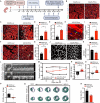
Fig. 3.. Ptma is required for cardiomyocyte proliferation and heart regeneration.
(A and B) Representative images (A) and quantitation of FUCCI+ cardiomyocytes (B), n = 4. Scale bars, 20 μm. (C) Schematic showing the experimental procedure in Ptma-cKO mice, created in BioRender (S. Gai, 2025), https://BioRender.com/q64z784. (D and E) Immunostaining for PTMA (green) and cTnT (red) post-AR. Scale bars, 20 μm (D). Quantitation of PTMA-positive cells in cardiomyocytes and non-cardiomyocytes, n = 3 (E). (F to K) Representative immunostaining images for EdU (F), pH3 (H) and Aurora B (J). Scale bars, 20 μm [(F) and (H)] and 10 μm (J). Quantitation of EdU (G)–, pH3 (I)–, and Aurora B (K)–positive cardiomyocytes at 7 dpr, n = 5. (L and M) Wheat germ agglutinin (WGA) staining. Scale bars, 20 μm (L). Quantification of cardiomyocyte size in hearts at 7 dpr, n = 6 (M). (N to P) Representative images of Masson’s trichrome staining. Scale bars, 1 mm (N). Quantification of the fibrosis area (O), and the number of regeneration or non-regeneration hearts at 28 dpr (P), n = 14 for Ptmafl/fl and n = 12 for Ptma-cKO group. (Q) M-mode echocardiography of the hearts at 28 dpr. (R to T) Echocardiography analyses of cardiac function of EF% (R), LVPW;s (S), and LVID;s (T) at 28 dpr, n = 14 for Ptmafl/fl and n = 12 for Ptma-cKO group. Data are means ± SEM. By Student’s t test [(B), (E), (G), (I), (M), and (O)] and by Mann-Whitney test (K), *P < 0.05, **P < 0.01, and ***P < 0.001.
Fig. 4.
Fig. 4.. PTMA overexpression extends heart regenerative window following MI injury.
(A) Schematic plot showing the experimental procedure for AAV9-delivered PTMA overexpression following MI injury at P8, created in BioRender (S. Gai, 2025), https://BioRender.com/c86w605. (B) Representative images of PTMA (green) and cTnT (red) co-staining. Scale bars, 20 μm. (C to I) Representative immunostaining images for EdU (C), pH3 (F), and Aurora B (H) heart sections. Scale bars, 20 μm [(C) and (F)] and 10 μm (H). Quantitative analysis of EdU (D)–, adjacent EdU (E)–, pH3 (G)–, and Aurora B (I)–positive cardiomyocytes in hearts at 3 dpi. (J and K) WGA staining. Scale bars, 20 μm (J). Quantification of cardiomyocyte size at 56 dpi, n = 5 (K). (L) Representative images of M-mode echocardiography of mice at 56 dpi. (M) Echocardiography analyses of EF% in mice hearts from 14 to 56 dpi, n = 6 (sham) and n = 10 (MI). (N to P) Echocardiography analyses showing the change in EF% (N), LVPW;s (O), and LVID;s (P) in mice hearts at 56 dpi relative to 3 dpi, n = 10. (Q and R) Representative images of Sirius red/Fast green staining. Scale bar, 1 mm (Q). Quantification of the scar size (R) in hearts at 56 dpi. Sirius red/Fast green staining marks myocardium (green) and fibrosis scar (red), n = 5. Data are presented as means ± SEM. By Student’s t test [(D), (E), (I), (K), (N), (O), (P), and (R)], by Mann-Whitney test (G), and by two-way ANOVA analysis (M), *P < 0.05, **P < 0.01, and ***P < 0.001.
Fig. 5.
Fig. 5.. AAV9-delivered Ptma gene therapy augments adult cardiac repair.
(A) Schematic diagram showing the experimental procedure of AAV9-delivered therapeutic potential in adult MI injury, created in BioRender (S. Gai, 2025), https://BioRender.com/q64z784. (B) Representative images of heart sections stained with PTMA (green) and cTnT (red). Scale bars, 20 μm. (C) Representative images of heart morphology from AAV9-Luc– and AAV9-Ptma–treated hearts. Scale bars, 2 mm. (D) Survival curves of AAV9-Ptma group compared to AAV9-Luc group after MI injury, n = 14 (AAV9-Luc) and n = 15 (AAV9-Ptma). (E) Representative images of M-mode echocardiography of mice at 56 dpi. (F) Analyses of changes in EF from 3 to 56 dpi, n = 7 (AAV9-Luc) and n = 10 (AAV9-Ptma). (G to I) Bar chart with individual data points showing changes in EF% (G), LVPW;s (H), and LVID;s (I) at 56 dpi relative to 3 dpi, n = 7 (AAV9-Luc) and n = 10 (AAV9-Ptma). (J and K) Representative images of Sirius red/Fast green staining of series of transverse sections after MI injury, myocardium (green), and myocardial fibrosis scar (red). Scale bar, 1 mm (J). Quantification of scar size, n = 5 (K). Data are means ± SEM. By Student’s t test [(B), (E), (G), (I), (M), and (O)] and by Mann-Whitney test (K), **P < 0.01, and ***P < 0.001.
Fig. 6.
Fig. 6.. AAV9-delivered Ptma gene therapy augments adult cardiac regeneration.
(A to F) Representative images of immunostaining for EdU (A), pH3 (C), and Aurora B (E). Scale bars, 20 μm (A) and 5 μm [(C) and (E)]. Quantitative analysis of EdU (B)–, pH3 (D)–, and Aurora B (F)–positive cardiomyocytes in adult hearts at 7 dpi, n = 5. (G to H) Representative images of isolated adult cardiomyocytes. Scale bars, 100 μm (G). Quantification of the total number of cardiomyocytes at 2 weeks post–MI injury, n = 4 (AAV9-Luc) and n = 5 (AAV9-Ptma) (H). (I to L) Representative images of RFP+ (I) and nGFP+ cardiomyocytes (K). Scale bars, 5 μm (I) and 10 μm (K). Quantification of the clusters of two or more RFP+ cardiomyocyte clones expansion (J) and nGFP+ cardiomyocyte clones expansion (L) 2 weeks post-MI, n = 4. Data are presented as means ± SEM. By Student’s t test, *P < 0.05, **P < 0.01, and ***P < 0.001.
Fig. 7.
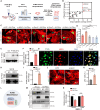
Fig. 7.. PTMA promotes hiPSC-CM proliferation.
(A) Schematic diagram showing the experimental procedure for Ad-PTMA treatment in hiPSC-CMs, created in BioRender (S. Gai, 2025), https://BioRender.com/c82t417. (B) Western blot of PTMA protein expression in hiPSC-CMs. (C to H) Representative images of EdU incorporation (C)–, pH3 (E)–, and Aurora B (G)–positive hiPSC-CMs treated with Ad-PTMA or Ad-Luc. Quantification of EdU (D)–, pH3 (F)–, and Aurora B (H)–positive hiPSC-CMs. Scale bars, 20 μm [(C) and (E)] and 10 μm (G), n = 4. (I) Hierarchical clustering of differentially expressed genes in Ad-PTMA versus Ad-Luc hiPSC-CMs as assessed by RNA-seq (adjusted P value < 0.05). (J) Volcano plot of 828 up-regulated and 805 down-regulated genes in Ad-PTMA versus Ad-Luc hiPSC-CMs, n = 3 in each group. (K) GO analysis of 828 up-regulated genes and 805 down-regulated genes in Ad-PTMA versus Ad-Luc hiPSC-CMs. Data are presented as means ± SEM. By Mann-Whitney test (D) and by Student’s t test [(F) and (H)], ***P < 0.001.
Fig. 8.
Fig. 8.. PTMA facilitates cardiomyocyte proliferation by inhibiting the deacetylation activity of MBD3/HDAC1 NuRD complex.
(A) Schematic showing the experimental procedure for identifying PTMA interacting proteins, created in BioRender (S. Gai, 2025), https://BioRender.com/j37x945. KD, knockdown. (B) The distribution of proteins identified from cardiomyocytes using Myc-tagged PTMA co-IP coupled mass spectrometry. (C) Representative immunostaining images for pH3. Scale bars, 20 μm. (D) Quantitative analyses of pH3+ cardiomyocytes, n = 3. (E and F) Western blot of MBD3 protein expression in tagged MYC antibody immunoprecipitation (IP) in cardiomyocytes (E). Quantification of MBD3 protein enrichment that normalized to control (Ctrl) group (F), n = 3 independent replicates. (G) Immunostaining of PTMA, MBD3, and DAPI in cardiomyocyte nuclei. Scale bars, 20 μm. (H and I) Western blot of PTMA protein expression in MBD3 antibody IP in neonatal cardiomyocytes (H) and the quantification of PTMA protein enrichment that normalized to immunoglobulin G (IgG), n = 3 independent replicates (I). (J and K) Representative images of immunostaining for pH3 in NRCMs. Scale bars, 20 μm (J). Quantitative analyses of pH3-positive cardiomyocytes, n = 3 replicates (K). (L) Schematic of MBD3/HDAC1 NuRD complex. (M and N) Western blot of HDAC1 and CHD4 in MBD3 antibody IP in hypoxia cardiomyocyte lysate [3% O2, (M)], immunoblot (IB). Quantification of HDAC1 and CHD4 enrichment in MBD3 IP, n = 4 independent replicates (N). Data are presented as means ± SEM. By one-way ANOVA analysis (D) and by Student’s t test [(F), (I), (K), and (N)], *P < 0.05 and ***P < 0.001; n.s. indicates the P value is not statistically significant.
Fig. 9.
Fig. 9.. PTMA promotes cardiomyocyte proliferation by acetylating STAT3.
(A and B) Western blot of Notch and STAT3 signaling pathway post-MI (A), and quantification of the protein expression, n = 3 (B). (C and D) Western blot of STAT3 protein expression in tagged MYC antibody IP in cardiomyocytes (C). Quantification of STAT3 protein enrichment that normalized to Ctrl group, n = 3 independent replicates (D). (E and F) Western blot of HDAC1 and acetylated lysine (Ac-K) in STAT3 antibody IP in hypoxia cardiomyocyte lysate [3% O2, (E)]. Quantification of protein enrichment, n = 4 independent replicates (F). (G and H) Western blot of STAT3 signaling pathway in hypoxia cardiomyocyte lysate [3% O2, (G)]. Quantification of the protein expression, n = 3 (H). (I and J) Western blot of STAT3 signaling pathway in hypoxia embryonic cardiomyocytes [3% O2, (I)]. Quantification of the protein expression, n = 4 replicates (J). (K and L) Western blot of STAT3 signaling pathway in hypoxia cardiomyocyte lysate [3% O2, (K)]. Quantification of the protein expression, n = 4 (L). GAPDH, glyceraldehyde-3-phosphate dehydrogenase. (M) Heatmap of STAT3 target gene expression in hypoxia cardiomyocyte (3% O2). (N and O) Representative images of immunostaining for pH3 in NRCMs. Scale bars, 20 μm (N). Quantitative analyses of pH3-positive cardiomyocytes, n = 4 replicates (O). Data are presented as means ± SEM. By Student’s t test [(B), (D), (F), (H), and (J)] and by one-way ANOVA analysis (O), *P < 0.05, **P < 0.01, and ***P < 0.001; n.s. indicates the P value is not statistically significant.
Fig. 10.
Fig. 10.. Schematic showing the mechanism of PTMA-regulated cardiomyocyte proliferation and cardiac repair.
Created in BioRender (S. Gai, 2025), https://BioRender.com/o67l028, with modification. PTMA interacts with MBD3, competitively inhibiting the deacetylation activity of MBD3/HDAC1 NuRD complex. This inhibition leads to increased acetylation of STAT3 and enhances STAT3 phosphorylation and the activation of genes related to cardiomyocyte proliferation and survival. Consequently, PTMA promotes cardiac regeneration and repair. OE, overexpression.

References

    1. Nowbar A. N., Gitto M., Howard J. P., Francis D. P., Al-Lamee R., Mortality from ischemic heart disease. Circ. Cardiovasc. Qual. Outcomes 12, e005375 (2019). - PMC - PubMed
    1. Zhu F., Meng Q., Yu Y., Shao L., Shen Z., Adult cardiomyocyte proliferation: A new insight for myocardial infarction therapy. J. Cardiovasc. Transl. Res. 14, 457–466 (2021). - PubMed
    1. French B. A., Kramer C. M., Mechanisms of post-infarct left ventricular remodeling. Drug Discov. Today Dis. Mech. 4, 185–196 (2007). - PMC - PubMed
    1. Konstam M. A., Kramer D. G., Patel A. R., Maron M. S., Udelson J. E., Left ventricular remodeling in heart failure: Current concepts in clinical significance and assessment. JACC Cardiovasc. Imaging 4, 98–108 (2011). - PubMed
    1. Barak Y., Hemberger M., Sucov H. M., Phases and mechanisms of embryonic cardiomyocyte proliferation and ventricular wall morphogenesis. Pediatr. Cardiol. 40, 1359–1366 (2019). - PMC - PubMed

LinkOut - more resources